


More tools
Use cases


You know your influencer program is working. Sales spike after a launch, the brand gets tagged hundreds of times, discount codes get used, etc. But when leadership asks for a report, you’re scrambling through screenshots, Drive folders, and a Google Sheet held together by faith and broken VLOOKUP formulas.
Your campaigns are performing, but you can’t prove it cleanly enough to protect your budget.
This guide walks through how to fix that. You’ll get a clear framework for what metrics to track, how to collect data without manually chasing every creator, and templates you can copy to make reporting a repeatable process.
👉 Here’s the reporting template. You can keep it open while reading through this article to understand which metrics go where and how to fill in each section.
Which metrics you track in your reports will depend on:
If you’re running a specific campaign (like a product launch) or a seasonal campaign (like BFCM), it’s also worth practicing campaign-level reporting to share how the campaign performed.
With all that said, these are the core KPIs most influencer reports should have:
Reach refers to the number of unique viewers and impressions are total views (including repeats). Reach tells you how far the campaign spread and impressions tell you how often it was seen. For awareness campaigns, these are your headline numbers.
Engagement rate is likes, comments, shares, saves expressed as a percentage of reach or followers. These metrics are useful for comparing creators against each other, but only when you’re using the same formula consistently. A nano creator’s 8% ER and a macro creator’s 1.5% ER aren't directly comparable without factoring in reach.
Raw link clicks show interest. CTR shows how compelling the content was relative to how many people saw it. This is where awareness campaigns and performance campaigns start to diverge – if you’re optimizing for traffic or conversions, CTR matters more than engagement.
These are the direct conversions that an influencer brings in for your brand.
A dollar estimate of what the organic exposure would have cost as paid media. It’s useful as a directional benchmark, not a precise measure.
These are internal benchmarks for your team. It includes things like sourced influencers, reply rates, affiliate opt-ins, paid collabs secured, content generated, budget signed/spent, gifting posting rates, etc.
Now that you know what to track, the next step is figuring out how to extract all this data – and how much of it you need to do manually.
Collecting performance numbers for influencer marketing reports is probably the most manual task there is in your to-do list. Luckily, you can automate a lot of the data collection using influencer marketing tools.
The manual route is asking creators for numbers (for brand awareness campaigns). Influencers can share screenshots of the reach, engagement, likes, shares, etc. But as you can expect, the manual way has lots of headaches:
The alternative is getting direct access – either through platform API permissions (like Instagram’s Business Account API or TikTok’s Creator Marketplace). But API access has its own limitations – not every creator has a business account, permissions need to be re-authenticated periodically, and each platform’s API returns different data in different formats, so you’re still stuck homogenizing everything yourself.
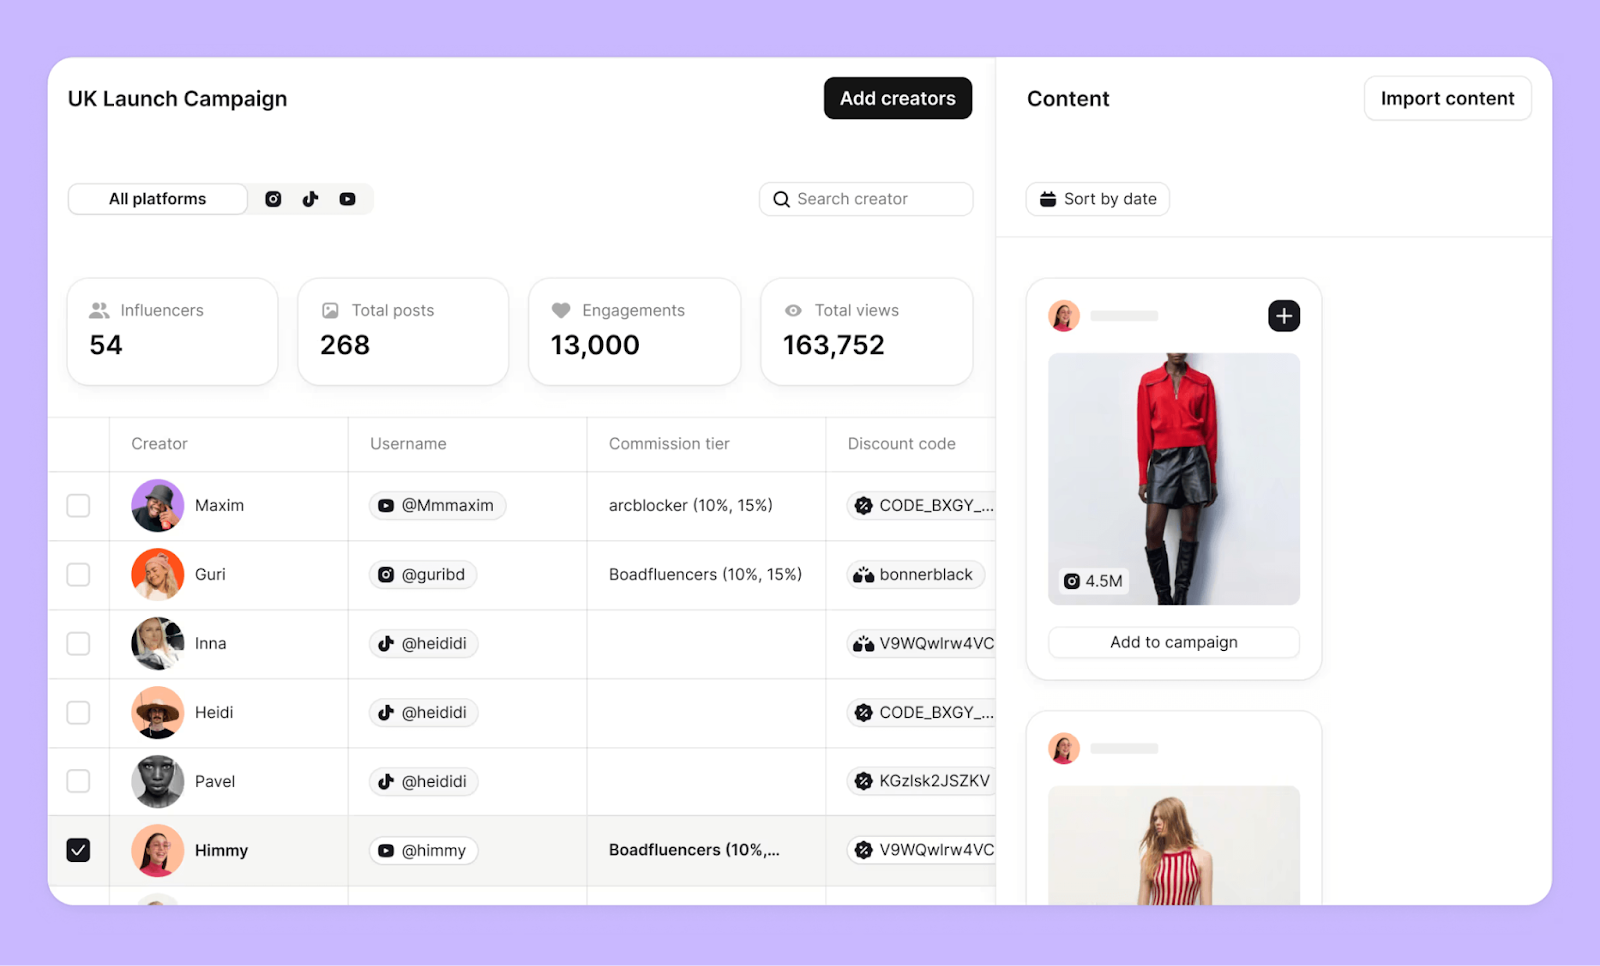
The best and easiest solution is using a tool like Modash to track creator content and its performance automatically. Here’s why:


For a handful of creators, screenshots and manual collection might be fine. But once your program grows past that, you need a tool like Modash that handles the data collection for you. Otherwise, reporting will always take away hours from your day that could’ve been used for other, more strategic tasks.
Many marketers – especially if they’re converting their influencers to affiliates – rely on UTM parameters, discount codes, or tracking links to accurately track an influencer’s performance.
The challenge is scaling these efforts manually. When you’re collaborating with 50+ creators with unique links and codes, tracking each one’s performance means jumping between Google Analytics, your affiliate dashboard, Shopify, and the spreadsheet where you’re logging it all. Every new creator adds another row to maintain and another data source to check.
That’s why it’s best to automate this task with tools like Modash. It integrates with your Shopify store, generates unique tracking links and discount codes for each creator automatically, and pulls all the performance data into one place. You can see individual creator performance, compare affiliates side by side, and filter by campaign or time period.

A spreadsheet might be enough for small campaigns where you’re only collaborating with a few affiliates. But once you’re managing unique codes and UTMs across dozens of creators, you need a centralized view – or you’ll spend more time collecting the data than actually analyzing it.
Spreadsheets and native analytics can carry a small program, but once you’re past ~20 active creators, a dedicated tool can save you a lot of time. The key thing to look for is whether the tool actually automates data collection or just gives you a nicer place to enter it manually.
With Modash, you can:
And all of this doesn’t even cover Modash’s other features – like influencer search (including AI discovery), doing influencer outreach, and managing creator payments – that make it a complete solution for influencer marketers.
After data collection comes the most crucial bit: converting it into a report that’s useful and easy to grasp.
A good influencer report isn’t a data dump. Instead, it’s a narrative that shows how your campaigns performed against the set KPIs and how your efforts contributed to the business’ bottom line. Here’s what to include and how to structure it:
Start with your One Big Number – this can be cost per acquisition, code redemptions, or total reach. Every report needs a single headline metric that defines success for that specific campaign. Everything else in the report should support or contextualize that number.
Beyond the core KPI, include your:
If you’re reporting on a brand awareness campaign, your supporting metrics might be reach, impressions, and engagement. If you’re reporting on a conversion-focused campaign, the metrics you’re looking for are performance-adjacent, i.e., clicks, conversions, and revenue.
But numbers alone don't hold attention. “10K sales” means nothing to a stakeholder. “10K sales, up 100% from last month, driven by three long-term partners who each did 5+ activations” tells a story. Every metric you include should come with context – what changed, why it changed, and what it means for the next campaign. Andreea Moise puts it well:
Any metric can become vanity if it's not grounded in insight and connected to outcomes. Even revenue. "Oh, look, we converted $50k in revenue this month through influencers. We're doing great!" – but if you spent $100k to get that and churn is over 10% and it's a mixed audience with separate goals that you have no idea how to retarget through content, it's not a long-term win. It's actually setting an impossible standard to scale and maintain for the team.

One more filter before you finalize your report: if a metric doesn’t affect your influencer marketing decisions in any way, cut it.
👉 Here’s a spreadsheet you can use to track all the data you’ll need for your report. However, the most seamless way to handle influencer marketing reporting is inside a platform like Modash, where most of this data is collected and structured automatically. The spreadsheet is a helpful resource if you’re not investing in a tool yet or want a quick-start framework.
Lead with a one-paragraph executive summary that shares what the campaign was, what the goal was, and whether it hit the target. Then break it into sections:


👉 Copy the reporting template to fill all this in – it’s structured around the framework above, so you can plug in your numbers as you go.
Match your visualization to the purpose of the meeting.
Use visuals over too much text to prove impact as much as possible. For example, use tables to show creator-level comparisons and charts for showing trends over time. But don’t spend hours building massive presentations when the time is better spent on actions that actually drive the business.
Pro tip: use a correlation chart showing sign-ups or sales spikes against influencers’ post live dates. It makes the impact of creator content obvious, especially for awareness campaigns where the value doesn’t always show up in code redemptions or tracked links.
These are two different views, and most reports need both.
What about the underperforming influencers? If you are reporting creator performance, don’t shy away from mentioning them. Marit Tiesma explains why:
[Underperforming creators] are part of the game. Top-performing influencers should balance that out. What doesn’t work should be evaluated to understand the why, and then be acted upon.

So instead of avoiding underperforming creators altogether, it’s worth evaluating why it happened. Was it the wrong creator fit, the wrong timing, or just a bad day for the algorithm?
It’s also worth remembering that an “underperforming” influencer isn’t necessarily a liability. Andreea explains:
Statistically, it’s impossible to have 80% influencers that drive sales in your program. In reality, it’s more like 10-20% that will perform and most of that performance will come from the cumulative effect too.
Just because an influencer doesn’t have the best performance metrics doesn’t mean they aren’t contributing.
That’s why it’s critical to always share data with context. Instead of just sharing numbers, include the factors that affect the performance – both at the campaign and the influencer level.
Remember: don’t review influencer performance in isolation. Your program is part of a broader marketing funnel. Compare your metrics to other channels – if influencer-driven traffic converts at double the rate of other sources with higher AOV, that’s a stronger case for scaling than any standalone revenue number.
There’s no one-size-fits-all approach to reporting. Your goals, company culture, and budget will determine what your reports look like. But seeing how other brands structure theirs can help you build your own.

Deeper Sonar, a portable sonar brand, allocates 70% of their marketing budget to their ambassador program.
Their core KPIs are impressions, reach, and website traffic source – tracked through a combination of Modash (for Instagram) and Google Analytics (for web traffic).
On a weekly basis, the team uses Modash to collect content from all long-term ambassadors, grouping it by country and platform. They filter for creators who posted that week, verify deliverables, and follow up with anyone whose expected content didn’t go live. This weekly check keeps the program from drifting without requiring a full report every time.
For stakeholder reporting, Deeper reports monthly. Their Head of Partnerships (Valeriia Chemerys) tracks impressions and reach from the first of the month to the current date, presenting it in a single slide with ranges. For example, “January reach was 223–780K and impressions were 1,102–2,210K.”
It’s lean, but it gives leadership a consistent pulse on the program without overcomplicating things. They also run separate meetings for specific campaigns like product launches or seasonal pushes.

Killstar, a gothic clothing brand, ran mostly gifting campaigns, keeping costs to COGS plus occasional creator fees. They tracked two things:
What stands out is their reporting structure. They ran two separate reports:
The content report included star influencers, top and bottom-performing content, budget spend, and objectives for the next month. The company also discusses highlights in bi-weekly all-hands marketing meetings, which keep influencer insights visible to adjacent teams like paid and organic social.
KoRo, a food company, uses influencer marketing primarily for brand awareness, especially when entering new markets. They track CAC, ROAS, and cost per order, with personalized voucher codes per creator. Content monitoring is manual – they rely on pre-set publishing dates, social media tags, and creators self-reporting when posts go live.
Their reporting cadence is straightforward:
There’s no single right answer, but most teams land on a weekly-monthly-quarterly rhythm – each serving a different purpose.
The most accurate [reporting frequency] by far for proving performance of a program is quarterly – weekly won’t catch a lot of impact, especially if you have long form content in the mix, and monthly might look inconsistent based on content volumes and hitting/missing 1-2 goals, but quarterly will always tell the truth on how the program is actually doing.
How often you should report also depends on your specific situation. Here are some factors to consider:
Knowing when to report is half the equation. The other half is making sure the report itself doesn’t undermine the data it’s presenting.
The reports that fall flat usually share the same handful of problems. Here are the common mistakes you should watch out for:
Many influencer marketers fall into the trap of mentioning metrics that don’t actually matter. Marit explains with an example:
I often see EMV being added; it's usually a large number that sounds impressive, but I find that most people can’t tell you what it actually means in terms of business impact.”
Figure out which metrics your stakeholders care about the most and ones that tie to revenue clearly – these are your core KPIs. Beyond that, every metric in your report should pass a simple test: does this number change how we make decisions? If the answer is no, it’s taking up space and diluting the metrics that actually matter.
Accounting for invisible metrics is one of the hardest problems to solve in influencer marketing. Marketing mix modeling and brand lift studies will prove efficiency, but they require company-wide infrastructure and aren’t always something an individual marketer can request.
The most accessible approach is post-purchase surveys – asking customers how they discovered the brand and what made them buy. It works better for always-on programs than one-off awareness campaigns, but it’s a practical starting point. You can also compare how influencer-sourced creative performs against brand-produced creative in paid social (CPM, CTR, revenue).
Marit also adds that product page testing is worth exploring:
You can see whether adding influencer reviews or content to a product page improves conversion rate or average order value. It’s smaller, but especially when you’re working with recognisable names, this might show the added impact of a partnership.”
Ultimately, influencer marketing ROI will always have a few blindspots. But if you have historical customer data and can combine it with an understanding of what your audience wants, watches, and where they spend time, the long-term impact of influencer marketing becomes visible even without perfect attribution.
If your team isn’t measuring performance the same way every time, your reports aren’t comparable – and data you can’t compare is data you can’t act on.
For example, if you’re calculating engagement rate based on followers one month and impressions the next, your reports become impossible to compare. If you switch between first-touch and last-touch attribution mid-campaign, your conversion data tells two different stories.
Pick a model and stick with it. Document it somewhere your team can reference. And when reporting to stakeholders, always note which attribution model you’re using – it preempts the “but how did you count this?” question and builds trust in the numbers.
And always account for other channels in your report. Don’t review influencer performance in isolation because you’re working as part of a funnel. Comparing your metrics to other channels contextualizes your results and is often the strongest argument for scaling your program. If influencer-driven traffic has a 20% higher AOV than paid social, that tells a clearer story than any standalone reach number.
The most crucial part of influencer marketing reporting is building a repeatable process so you’re not wasting time starting from scratch every cycle. Once the system is in place, reporting becomes a natural extension of how you run your program, not a separate task you dread.
If you haven’t already, grab the reporting template and start adapting it to your workflow. Keep evolving it as your program and strategy shift.
And if you need more templates to organize the rest of your influencer workflow, check out our free influencer marketing spreadsheet templates for tracking nearly every task you do.
But if you’re ready to stop pulling data manually altogether, try Modash free for 14 days – no credit card required.