


Mehr Tools
Use Cases
Rechtliches



An influencer marketing dashboard is only useful if it fits the size of your program.
Sounds obvious, right? And yet most brands either find themselves drowning in spreadsheets or grappling with a massively overengineered setup (hint: API connections, SQL queries, and warehouse migrations are a problem for enterprise data teams, not Shopify brands working with ~15 creators).
To help you get it right, I’m gonna walk you through how to pick the dashboard that fits your program stage and what, exactly, to put on it.
Oh, and I’ll also explain why you shouldn’t treat the numbers in your dashboard as gospel or rely on them to capture the full, 360-degree impact of influencer marketing.
Influencer marketing dashboards and reports might swim in the same pool, but they’re in different lanes. Or perhaps they’re in the same lane but at different times – not sure, I haven’t thought this metaphor through.
Anyway, let me get this back on track with some definitions:
🤓 Further reading: If you’re looking for reporting rather than dashboarding, head over to How to Report on Influencer Marketing (+ Templates).
Like I said in the intro, your goal for configuring an influencer marketing dashboard is to choose the build that fits your program size and maturity.
Broadly speaking, there are three “stages” of program, each with an ideal dashboard setup. I’m gonna walk through them here so you can figure out where your program currently sits…
Most articles like this will tell you that you’re insane to even think about using Excel or Google Sheets as your dashboard.
But that’s simply not true. If you’re…
…then you don’t need a dedicated tool. So keep your money in your pocket and use a spreadsheet instead.
Also, bear in mind that when we surveyed influencer marketers about this, 100% said they still use spreadsheets to manage their programs.
🤓 Further reading: For more stats like that, plus a free template to help you get started, check out 5 Spreadsheets for Influencer Marketers.
Sure, spreadsheets are totes viable for smaller programs (when did we, as a society, stop saying “totes”? 😢).
But pretty soon – AKA when you’re growing your program and/or expanding your number of creator partnerships – they’ll start seriously holding you back.
The good news is, once you reach this point, you’re gonna need to move everything out of spreadsheets and into a dedicated influencer marketing platform anyway. So you might as well keep your dashboard inside the same tool you’re using to find, manage, and pay influencers rather than investing in a separate build.
Modash is the perfect fit here. Our built-in influencer and campaign tracking tools give an at-a-glance view of all your key numbers, like:
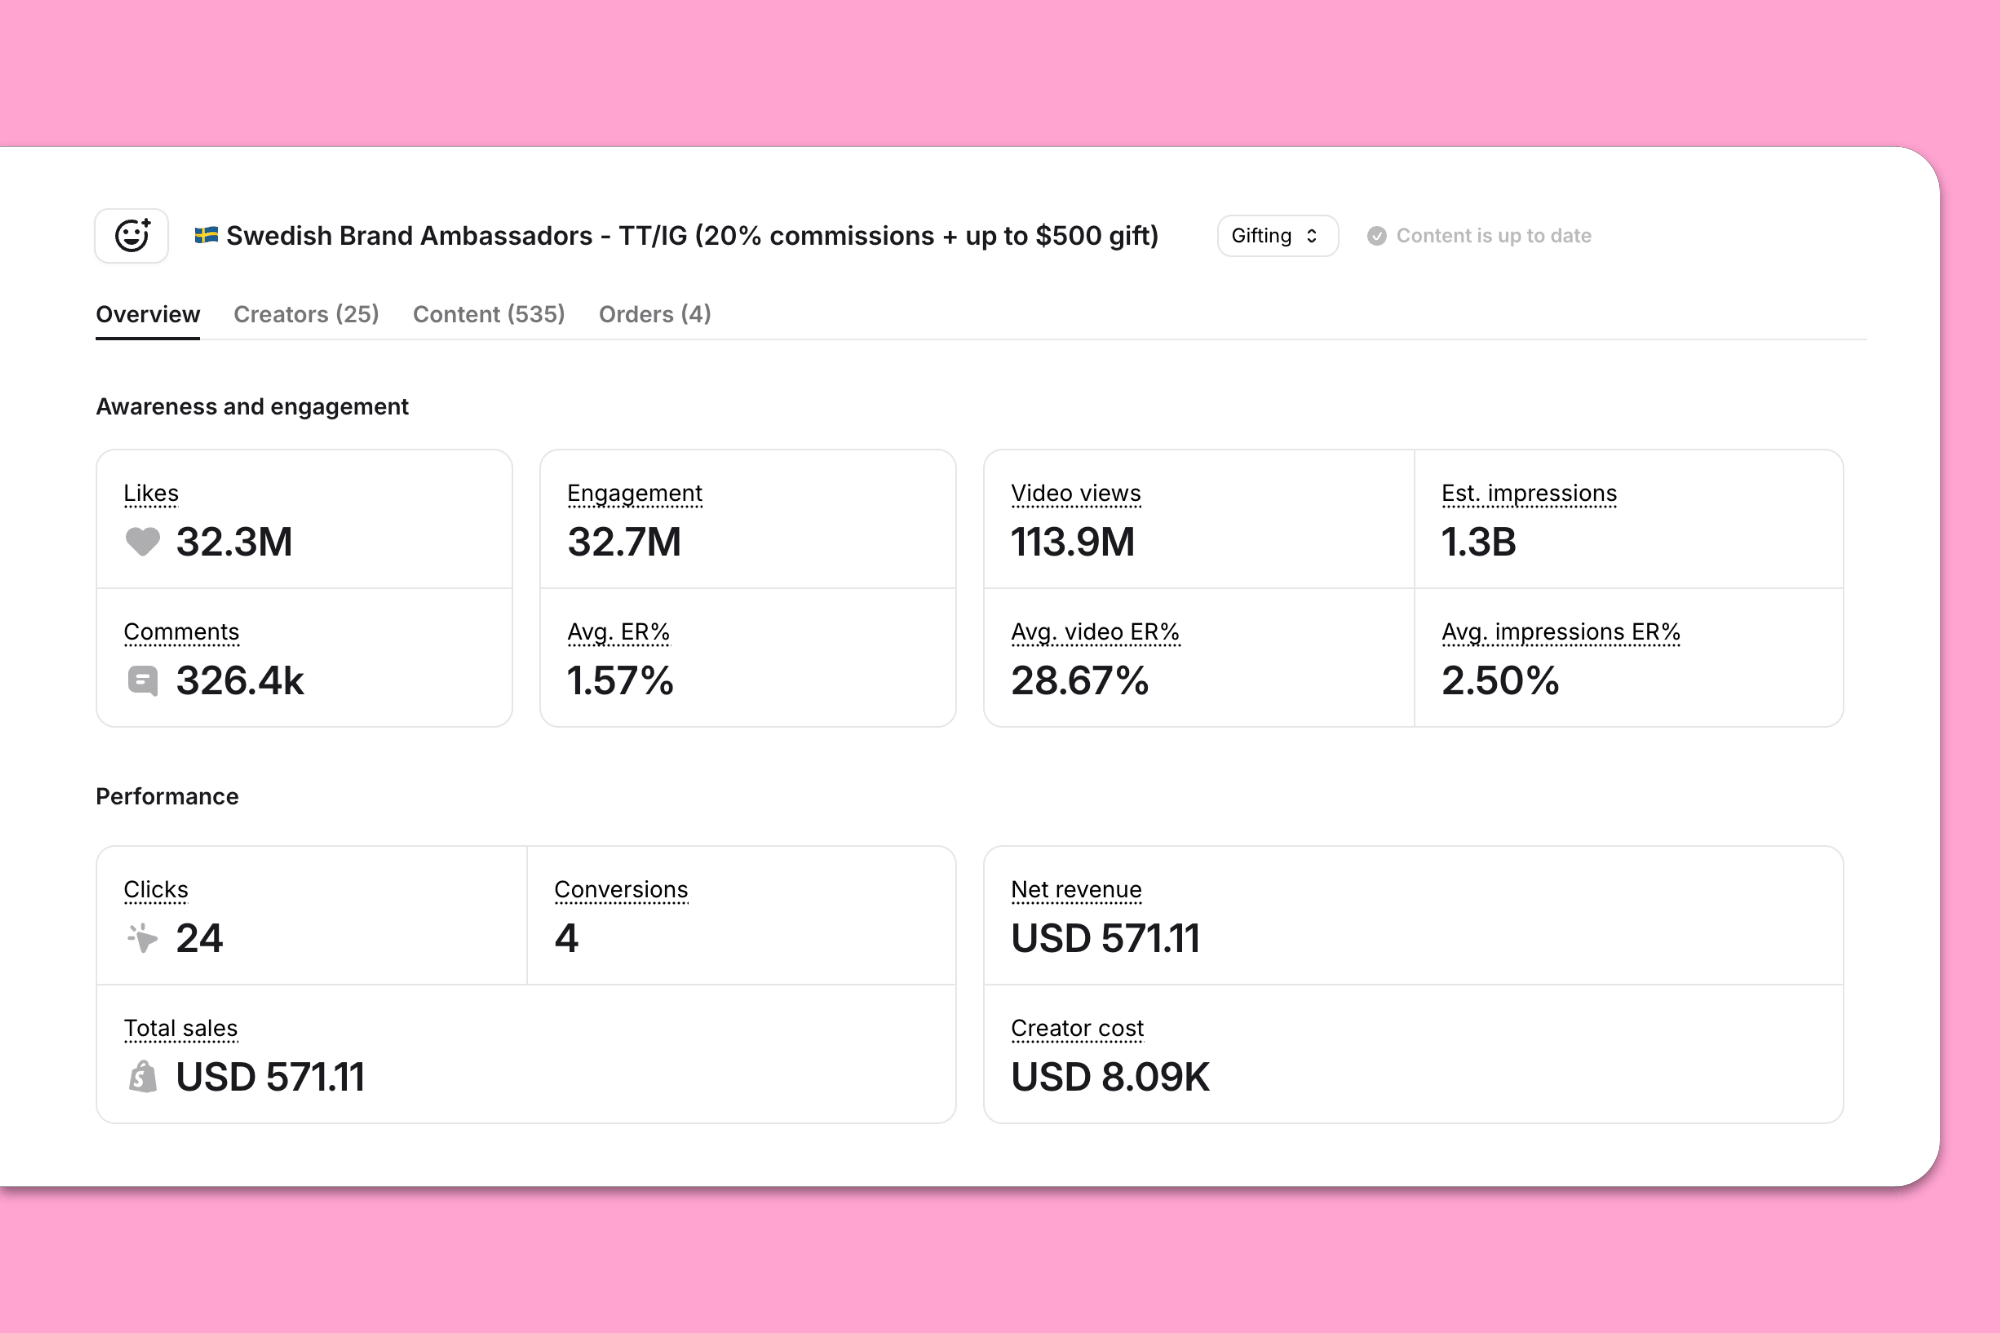
Your Modash dashboard automatically calculates engagement rate, EMV, CPM, and ROAS – so you don’t have to – and offers a per-creator breakdown of cost, clicks, revenue, and return, so you know who’s performing (and who isn’t).
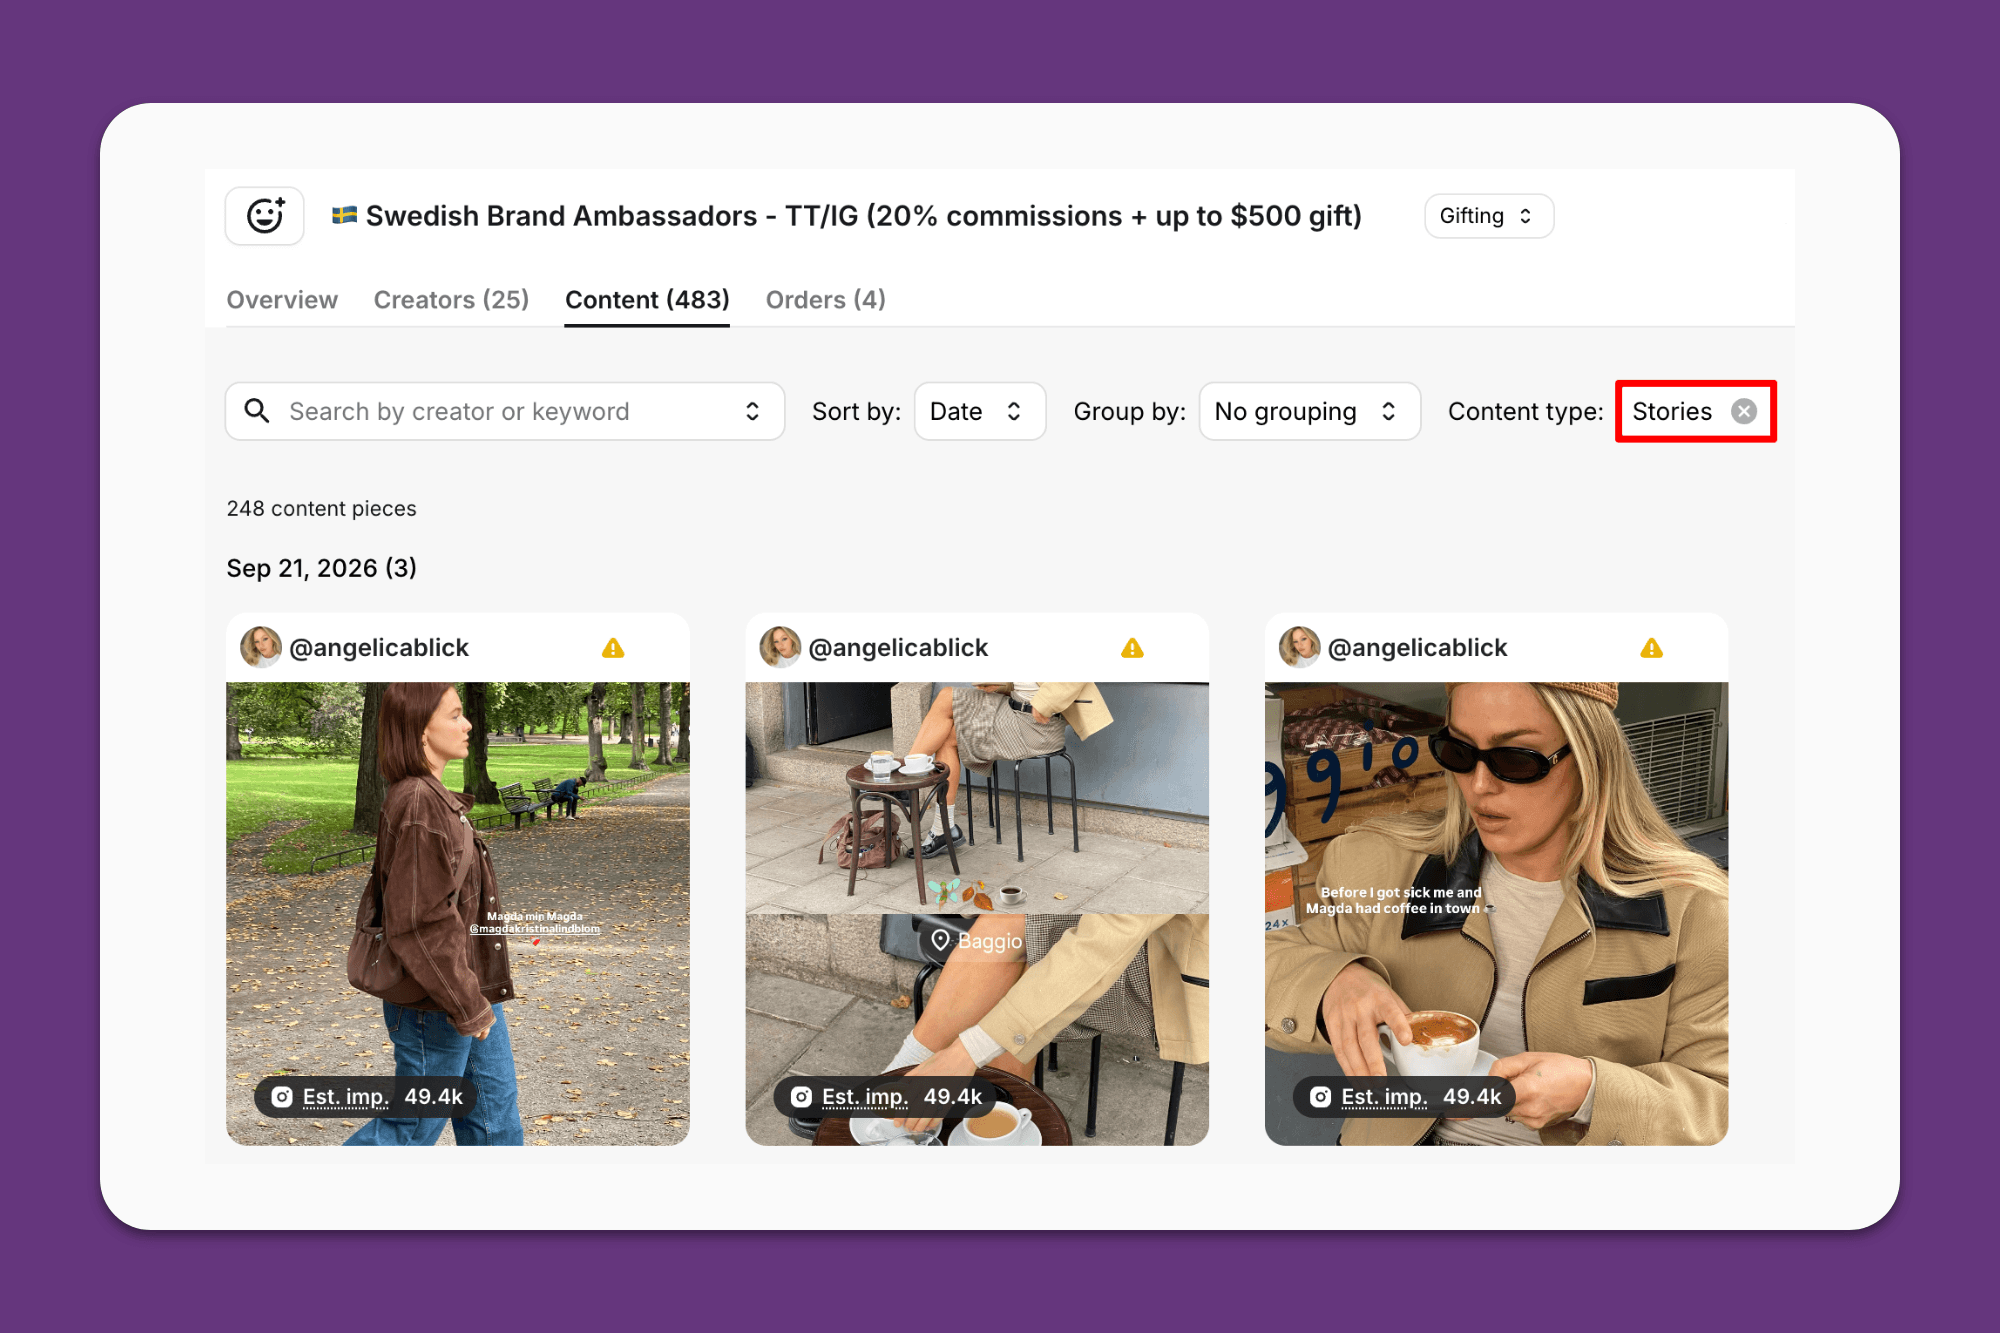
Not only that, but we automatically collect live influencer content – yep, even Stories – without requiring creator authentication first:
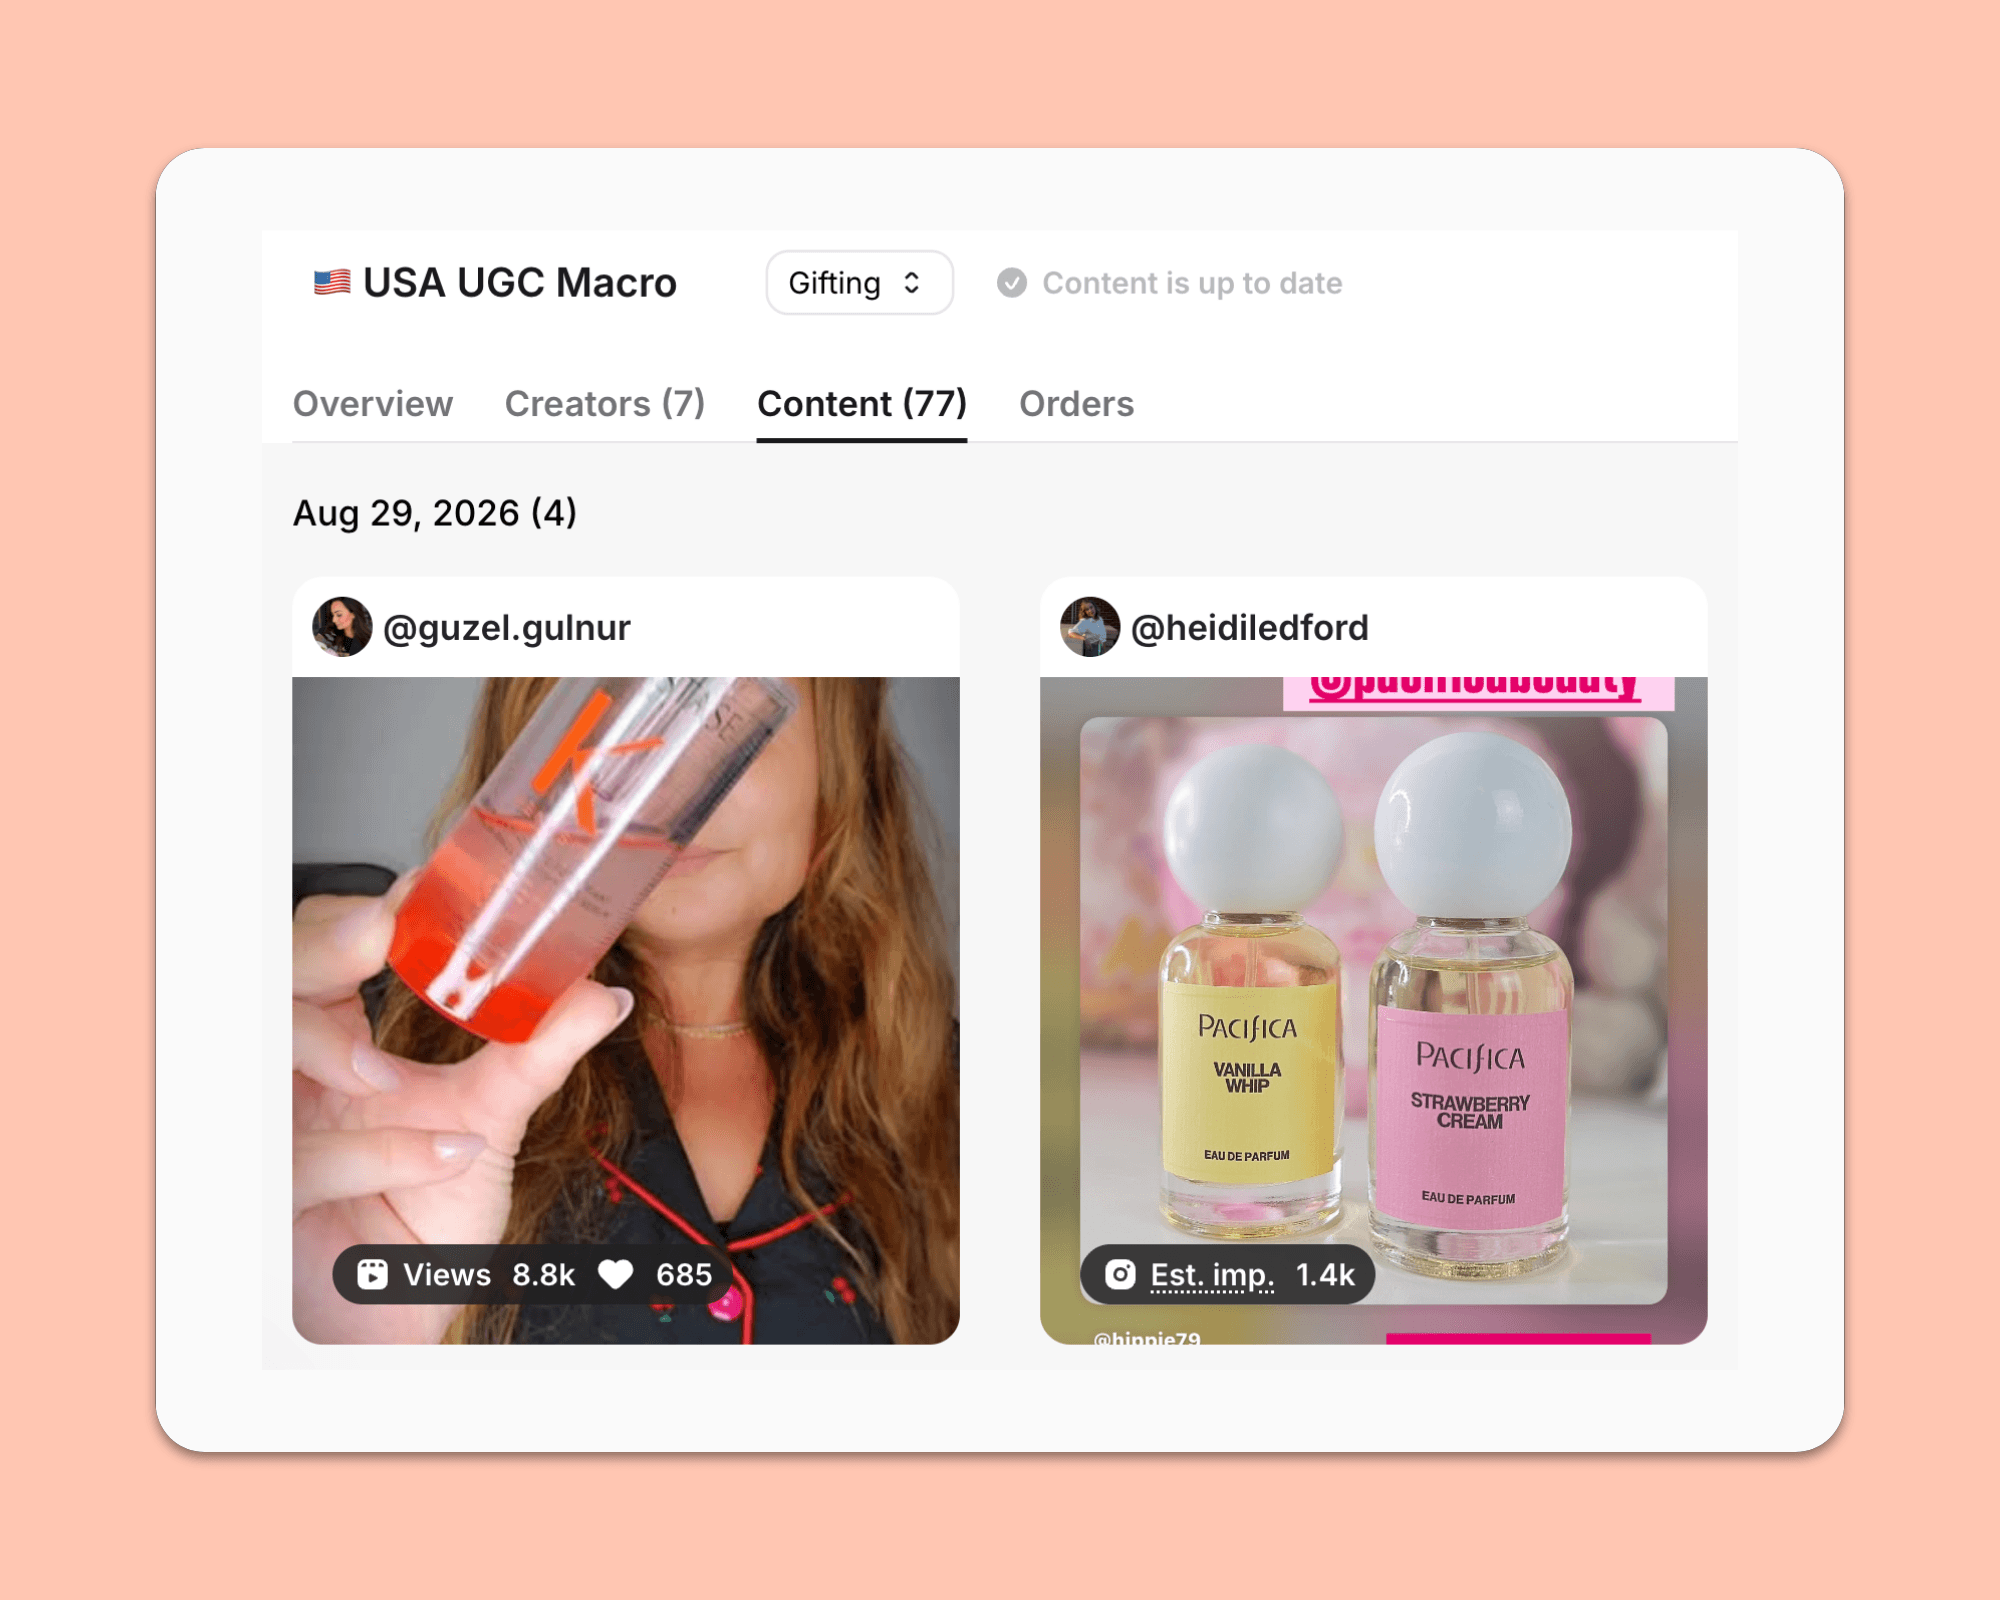
Super helpful for adding to reports down the line, or for if you’re repurposing influencer content for your website or ads.
👀 Try our tracking and reporting tools for yourself when you start your free 14-day Modash trial!
Most brands will never need to graduate beyond an influencer marketing tool like Modash for their dashboarding and reporting needs.
However, if you’re running a high volume of campaigns simultaneously and/or comparing influencer marketing performance vs other channels (like email or paid social), it’s time to consider exporting your campaign data to an external platform like Google Analytics.
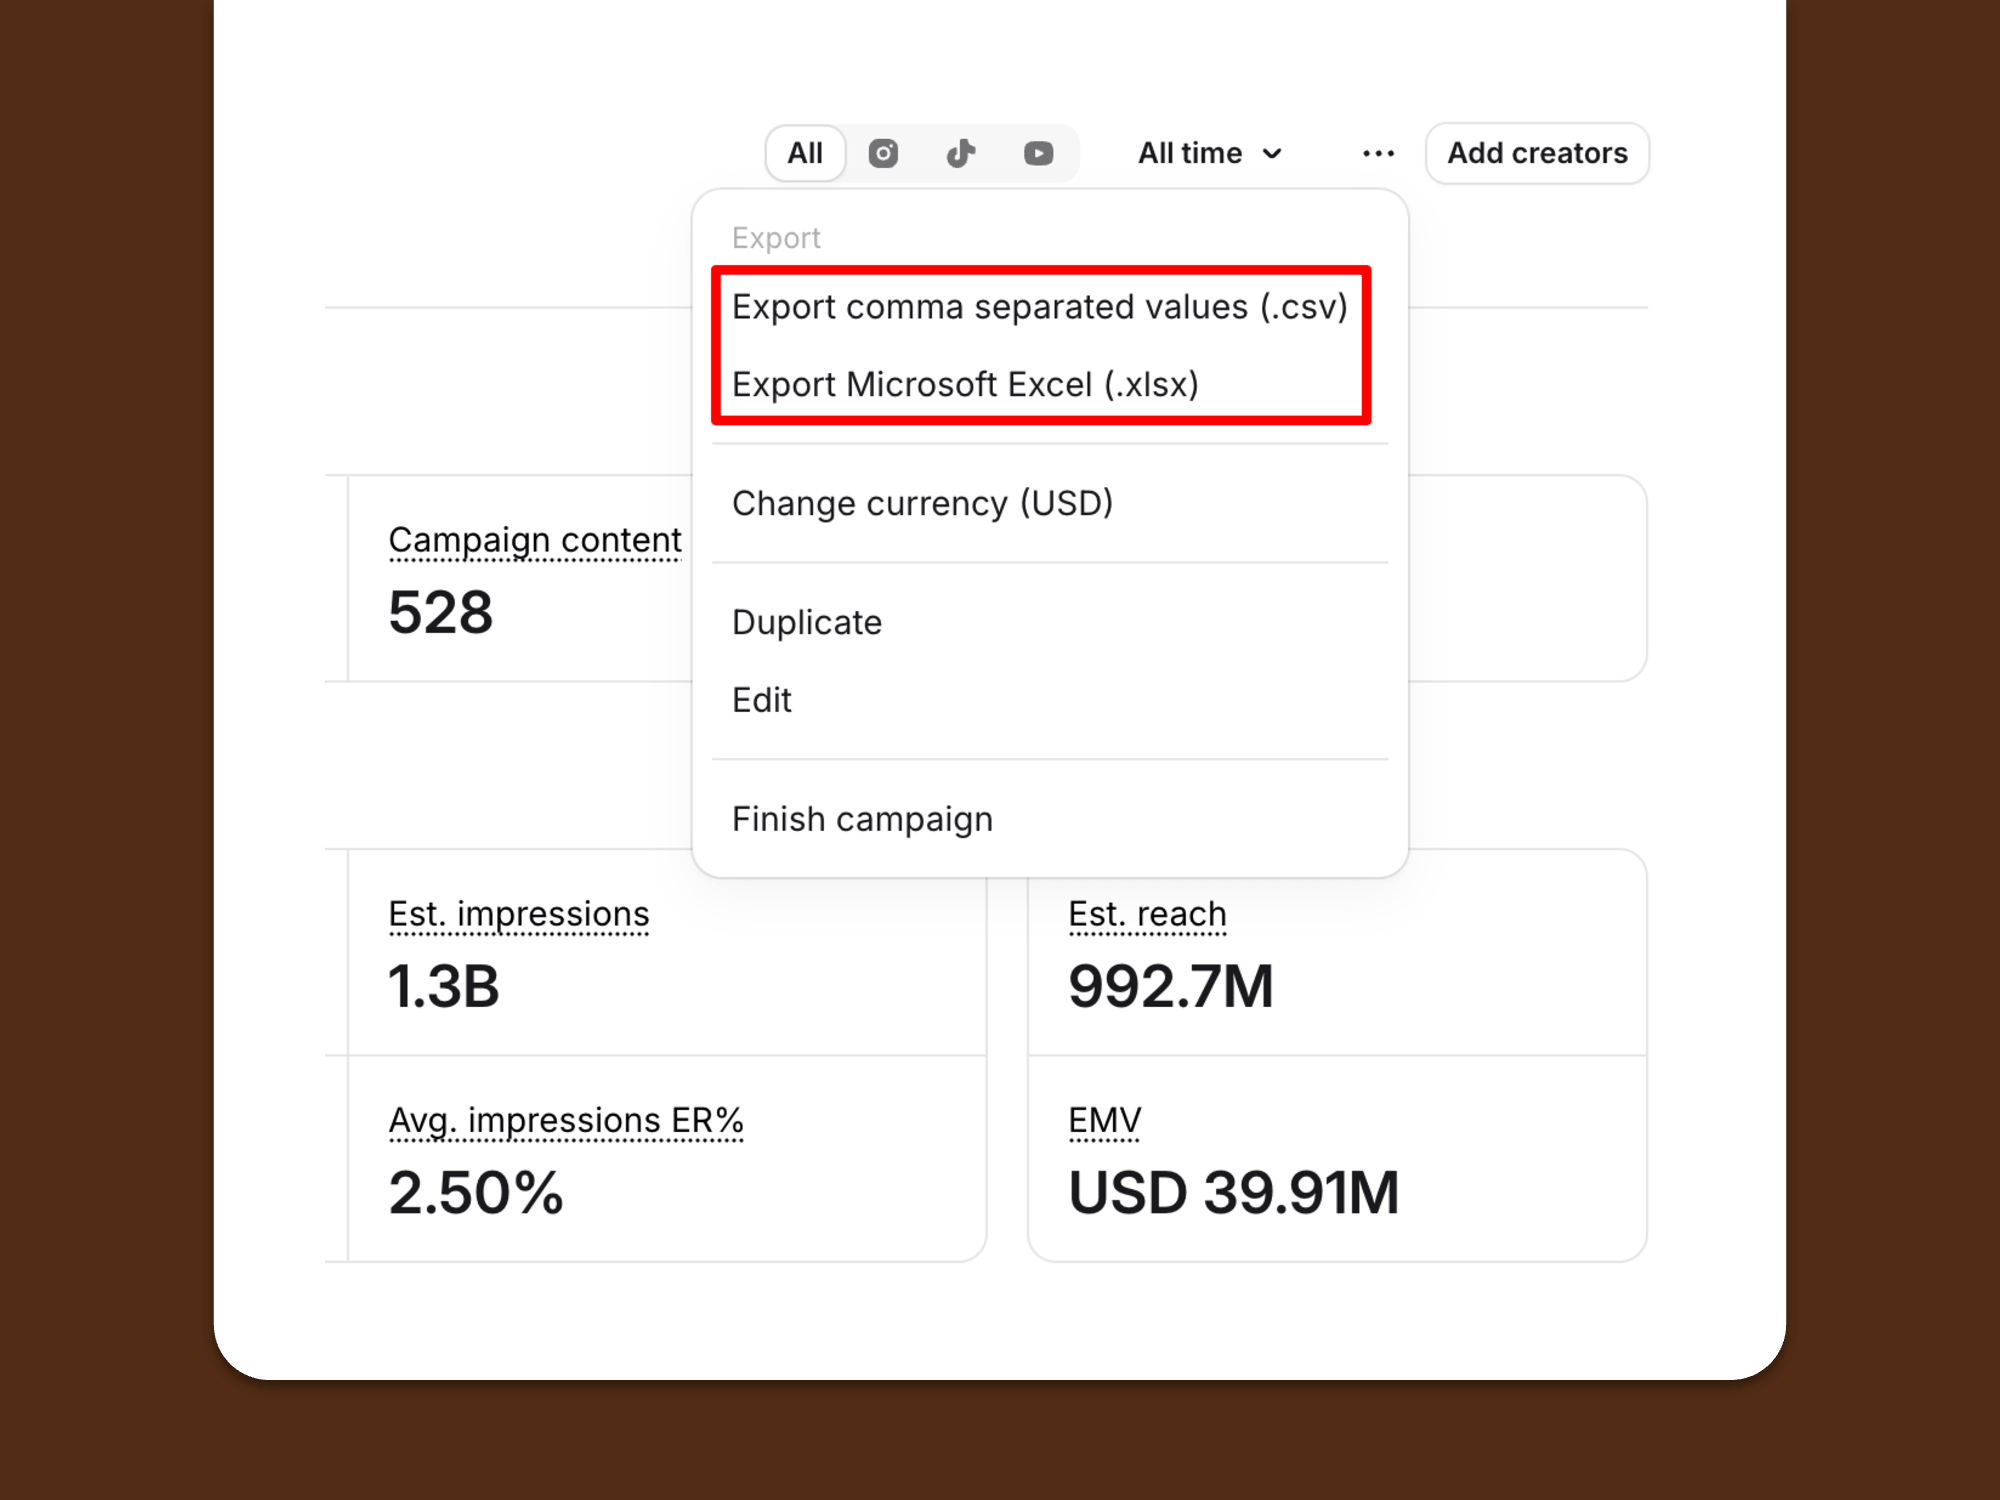
🤓 Pro tip: You can export data from Modash via CSV or Excel spreadsheet to use in your wider reporting setup.
Alternatively, some enterprise-tier influencer marketing and tracking tools aim to do all the campaign management and data analytics stuff in a single platform.
However, they’re invariably expensive – like, four figures a month or more – and mostly lack the end-to-end functionality you need to run an influencer program (from influencer discovery > vetting > content tracking > reporting > payments), so they often end up being used in combination with a tool like Modash anyway 🤷♀️
Okay, so hopefully I’ve clarified which “flavor” of dashboard is right for your program. Now let’s figure out which numbers to fill it up with.
🤓 Pro tip: Not trying to brag, but before I start listing metrics, you should know that Modash’s dashboard tracks and automatically updates all the numbers below 👇👇👇
These are similar but non-identical metrics. Here’s the difference:
Both metrics are important for tracking brand awareness campaigns, where the whole purpose is to get your influencer content, brand name, and product into as many feeds as possible.
However, bear in mind that these numbers aren’t always what they appear. For Reels, TikToks, and YouTube videos, reach and impressions are the actual numbers, whereas for Instagram Stories and in-feed posts, they’re only estimates.
Either way, Modash tracks performance data for all content types across Insta, TikTok, and YouTube, plus we capture it all for you – posts, Reels, TikToks, YouTube videos, Shorts, and even Stories.
Engagement rate measures the percentage of followers who interact with a post (likes, comments, shares, saves, that kinda thing).
It’s theoretically a useful metric because it demonstrates how much your campaign content is resonating with your audience – the higher the rate, the more they must dig it.
That’s the idea, at least, but one quick caveat: an engagement rate figure is only worth listening to once you’ve judged the audience. Because if all those comments are just a bunch of bots saying “great pic!! 😍”, they’re basically worthless.
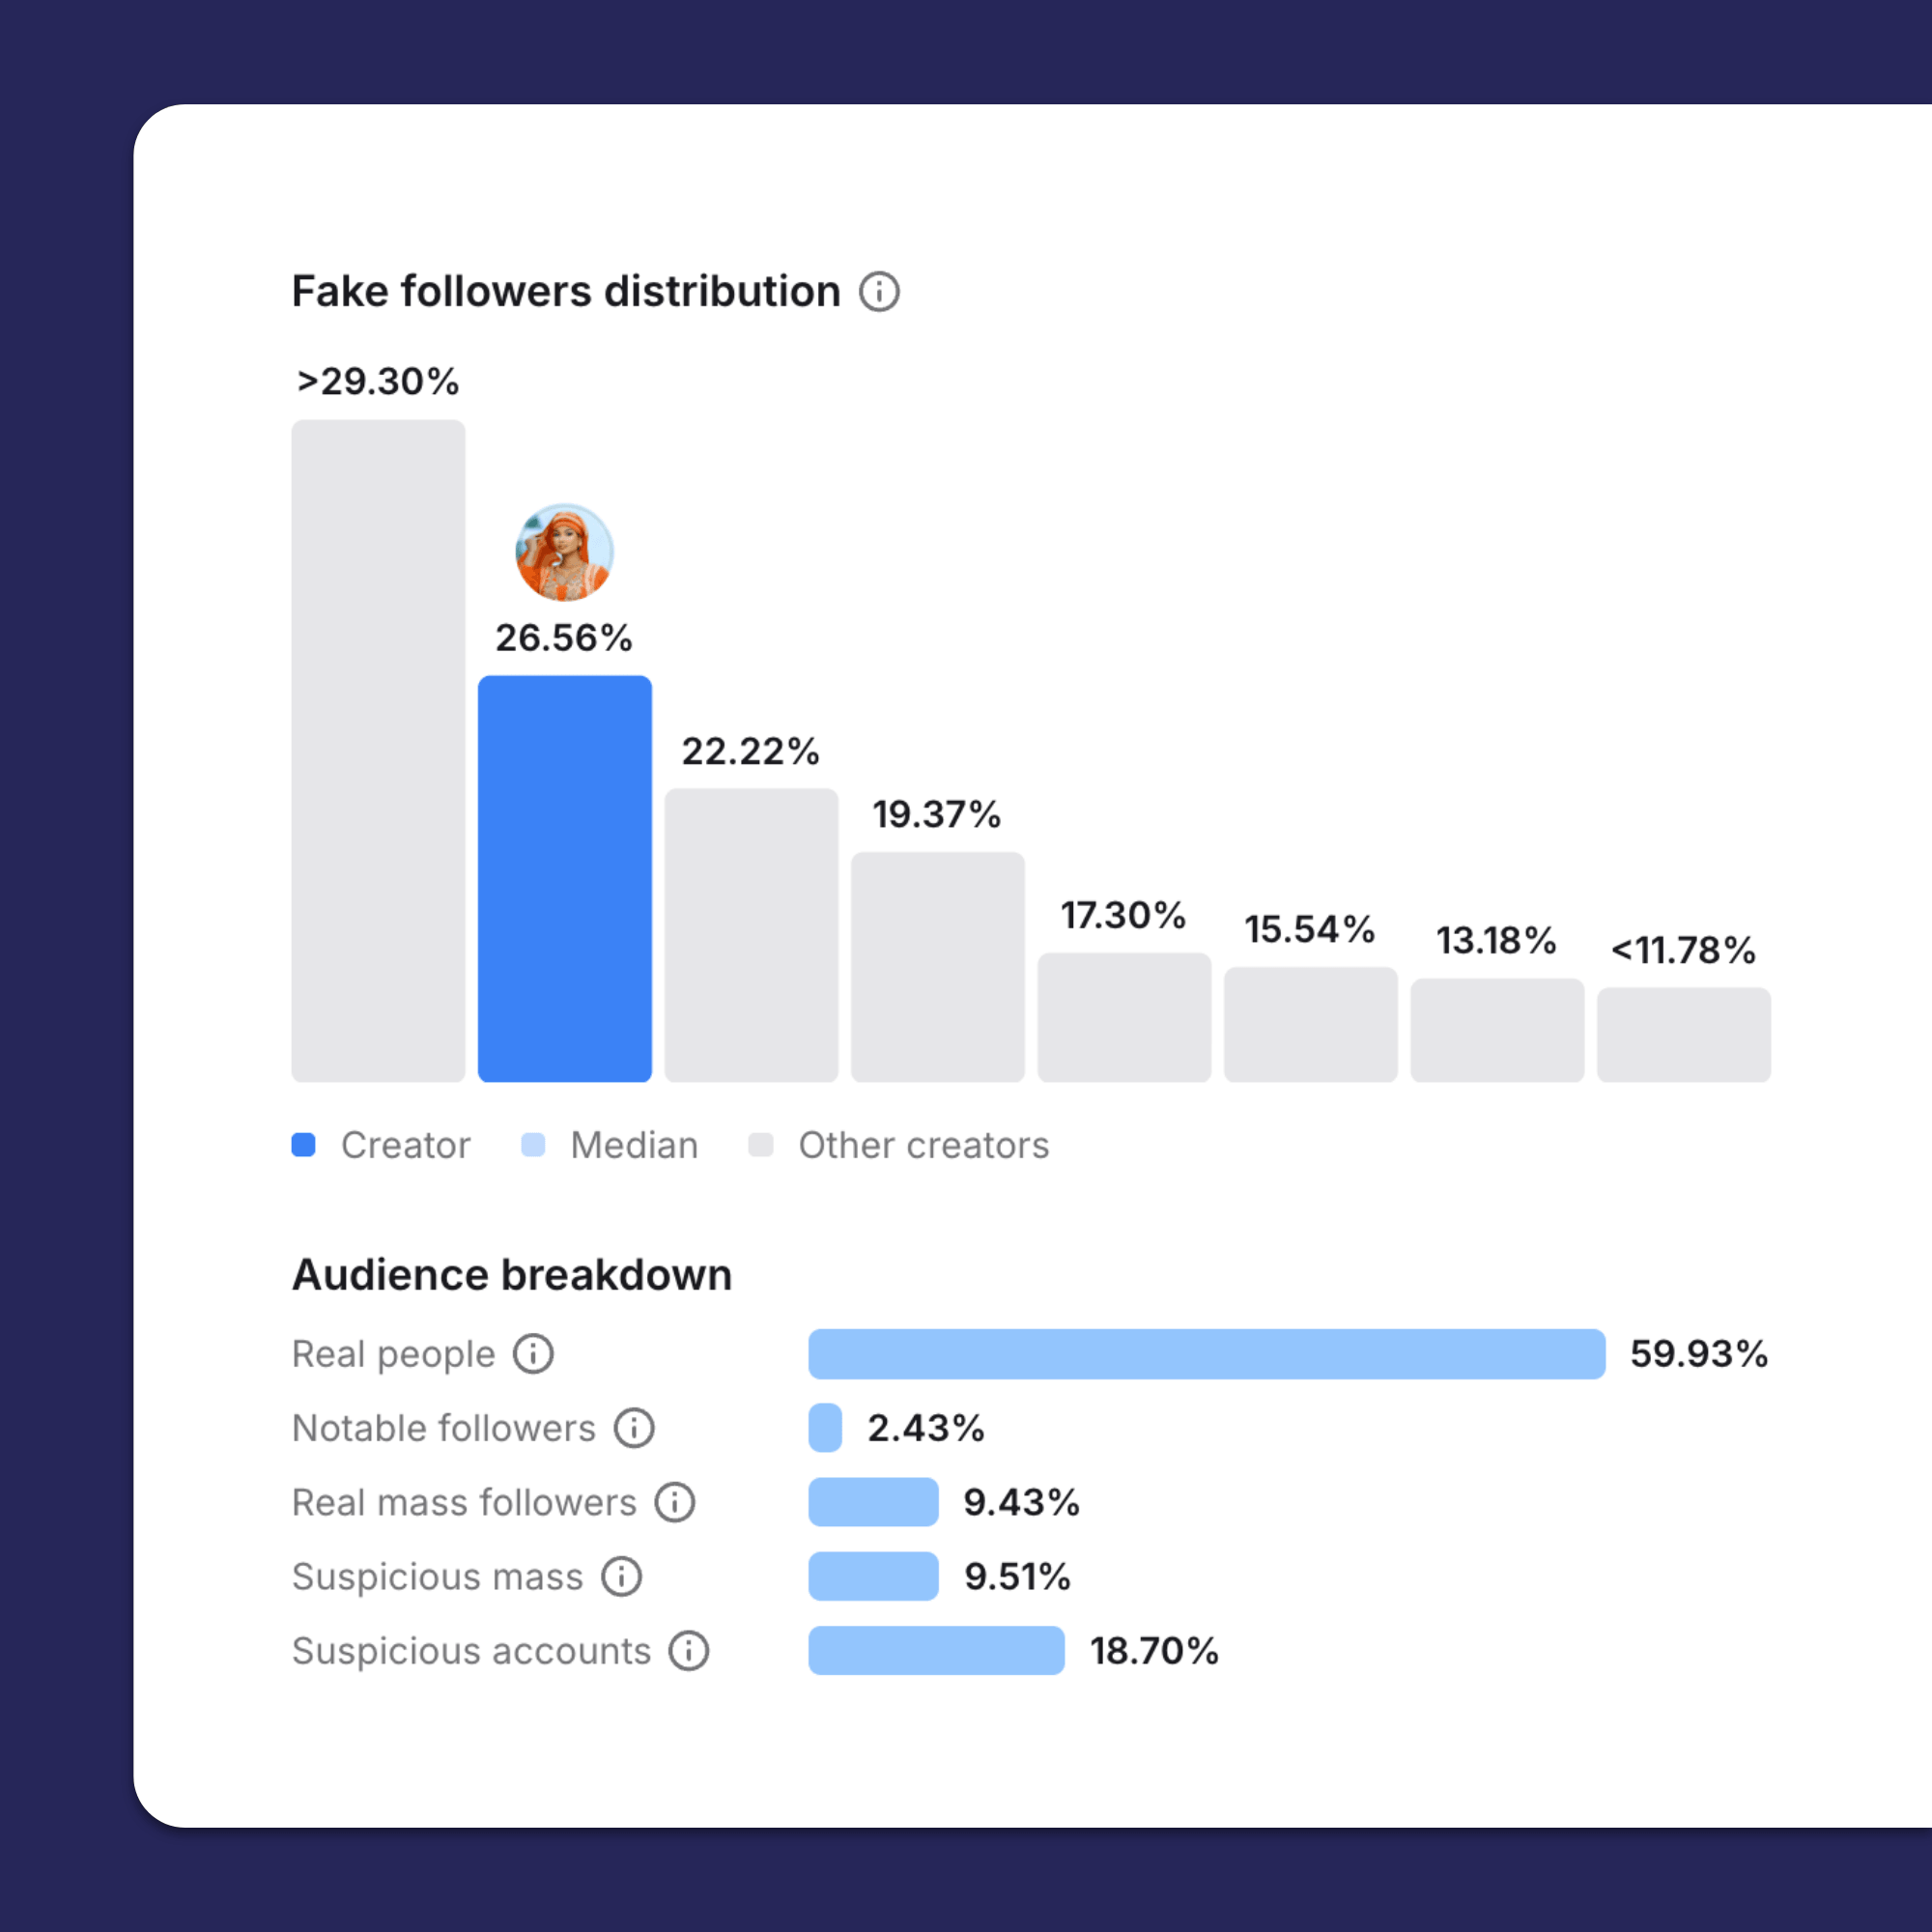
Fortunately, Modash has got your back. Our built-in fake follower checker helps you weed out creators with low-quality audiences during the influencer vetting stage so you can feel confident that your engagement rate figures are legit. We even provide benchmarks so you can compare whether a creator's engagement is high or low for their size:
🤓 Further reading: For more on this, check out Influencer Engagement Rate: How to Measure It, Judge It, and Verify It.
Clicks are – you guessed it – the total number of clicks on your campaign tracking links during a given period, while click-through rate is the total number of clicks divided by…
Both are worth tracking, especially for campaigns built around consideration and engagement – because you want to know that people are taking the time to visit your store rather than just mindlessly smashing “like” and scrolling away.
⚠️ There are actually two different types of clicks that show up in reports: total clicks (AKA the overall volume) and unique clicks (AKA the number of clicks from unique users). Naturally, Modash tracks both.
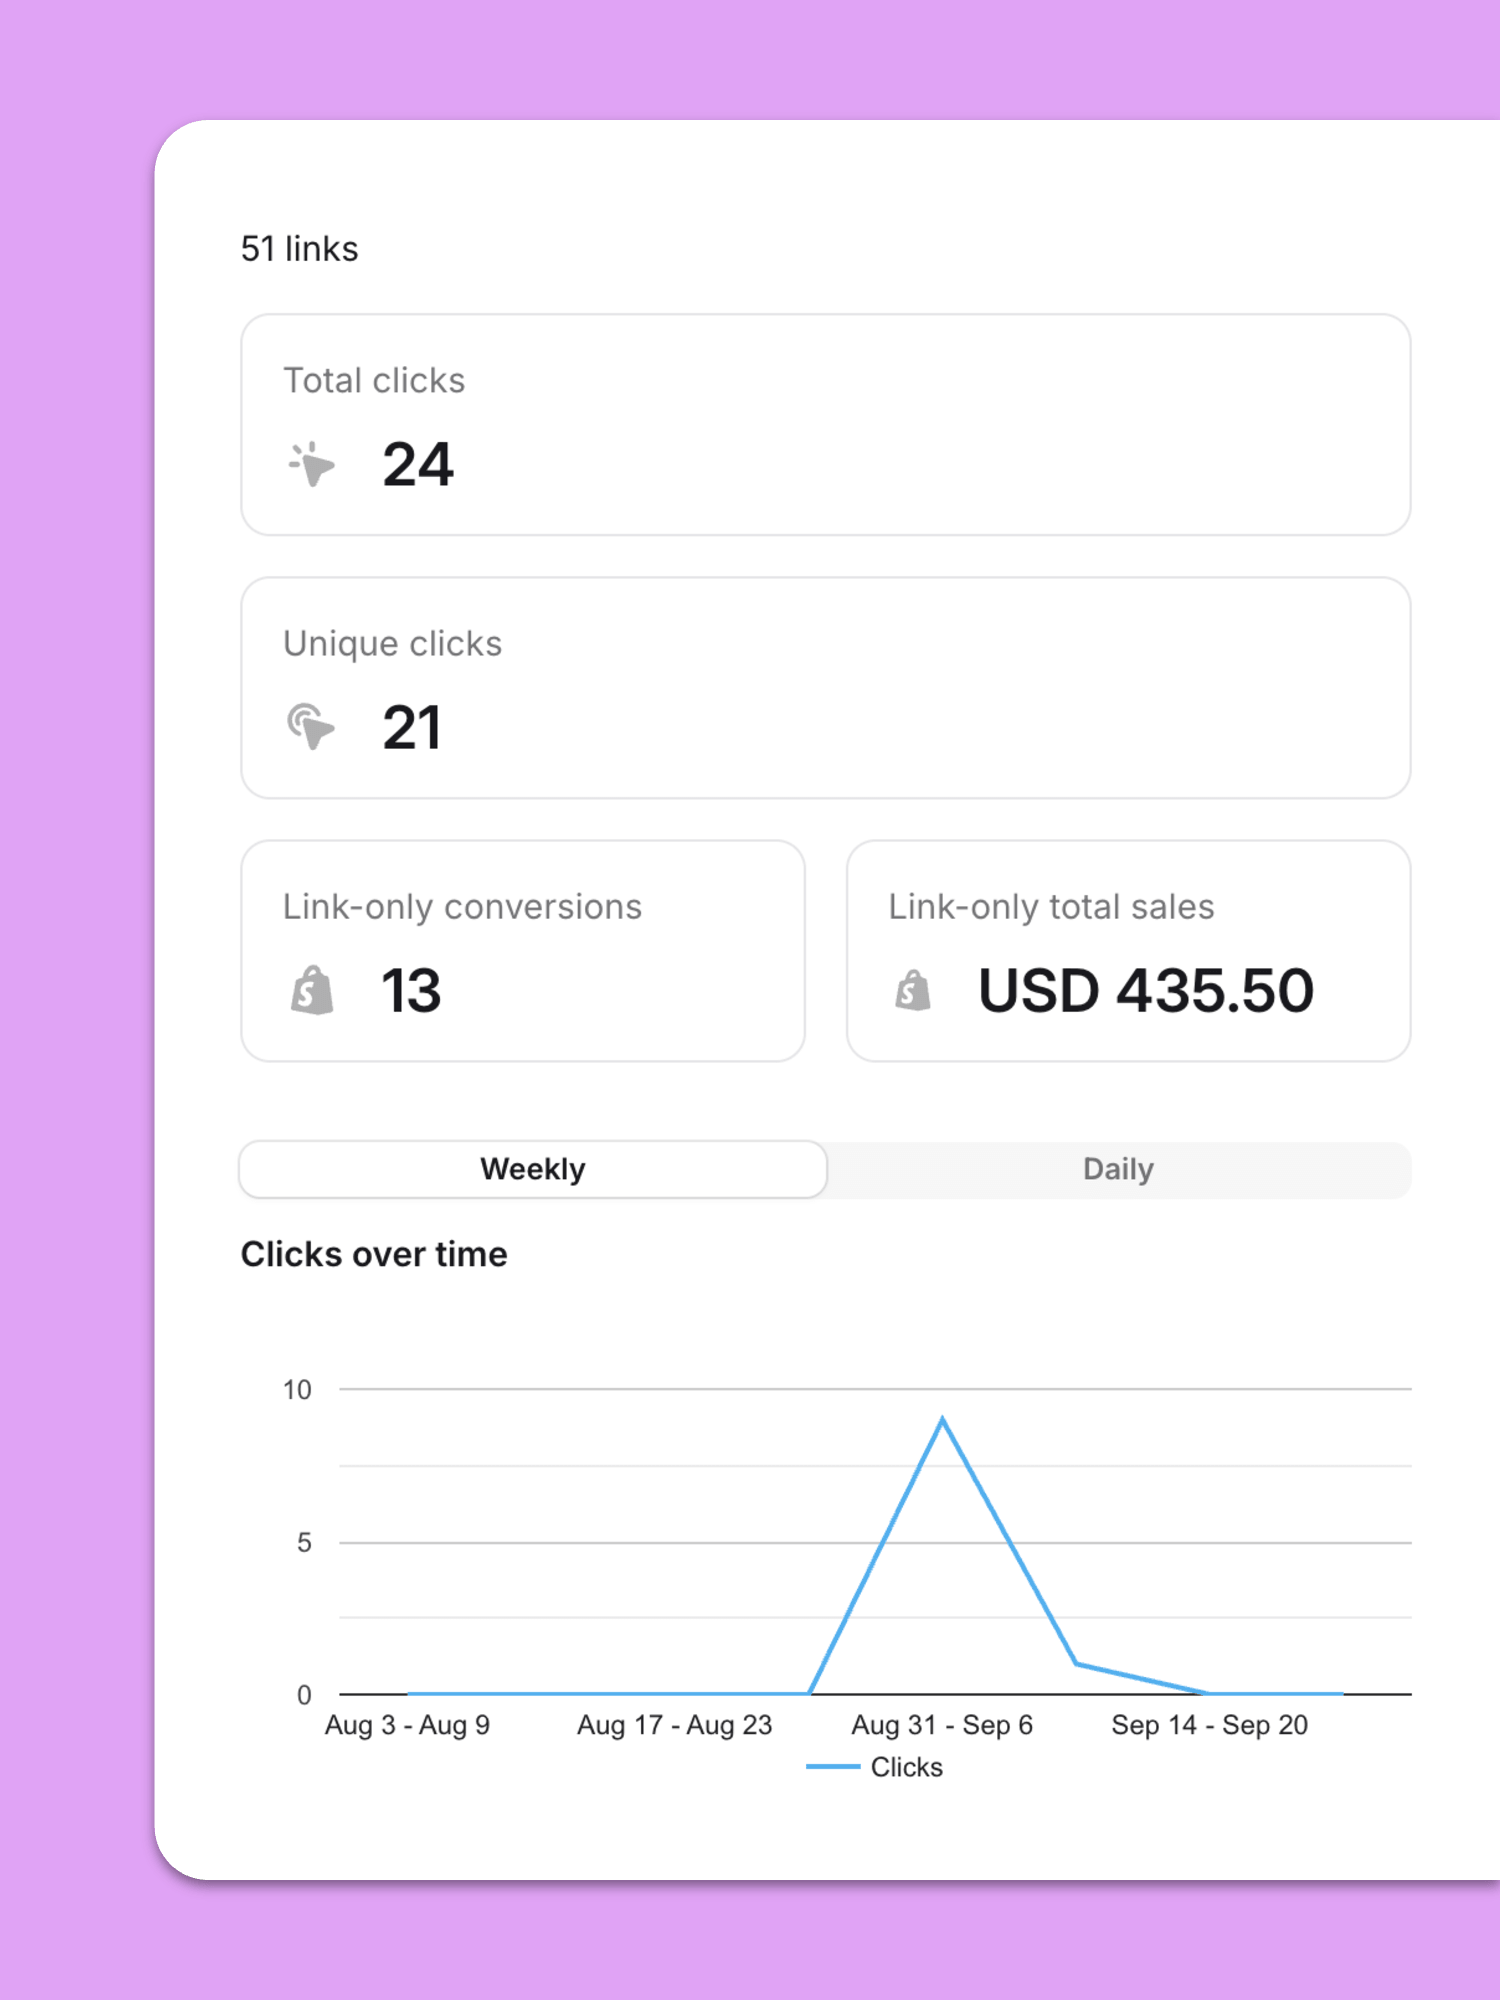
For a lot of brands, sales and conversions are the whole reason they’ve invested in influencer marketing. They want to know how many they’re generating and which influencers are bringing in the big numbers – that way, they can decide which creators to build long-term partnerships with.
Typically, sales tracking is handled through one or both of the following methods:
(Although be aware that only a relatively small proportion of influencer sales are directly attributable – for more on this, check out Influencer Marketing ROI: Proving The Impact of Influencers.)
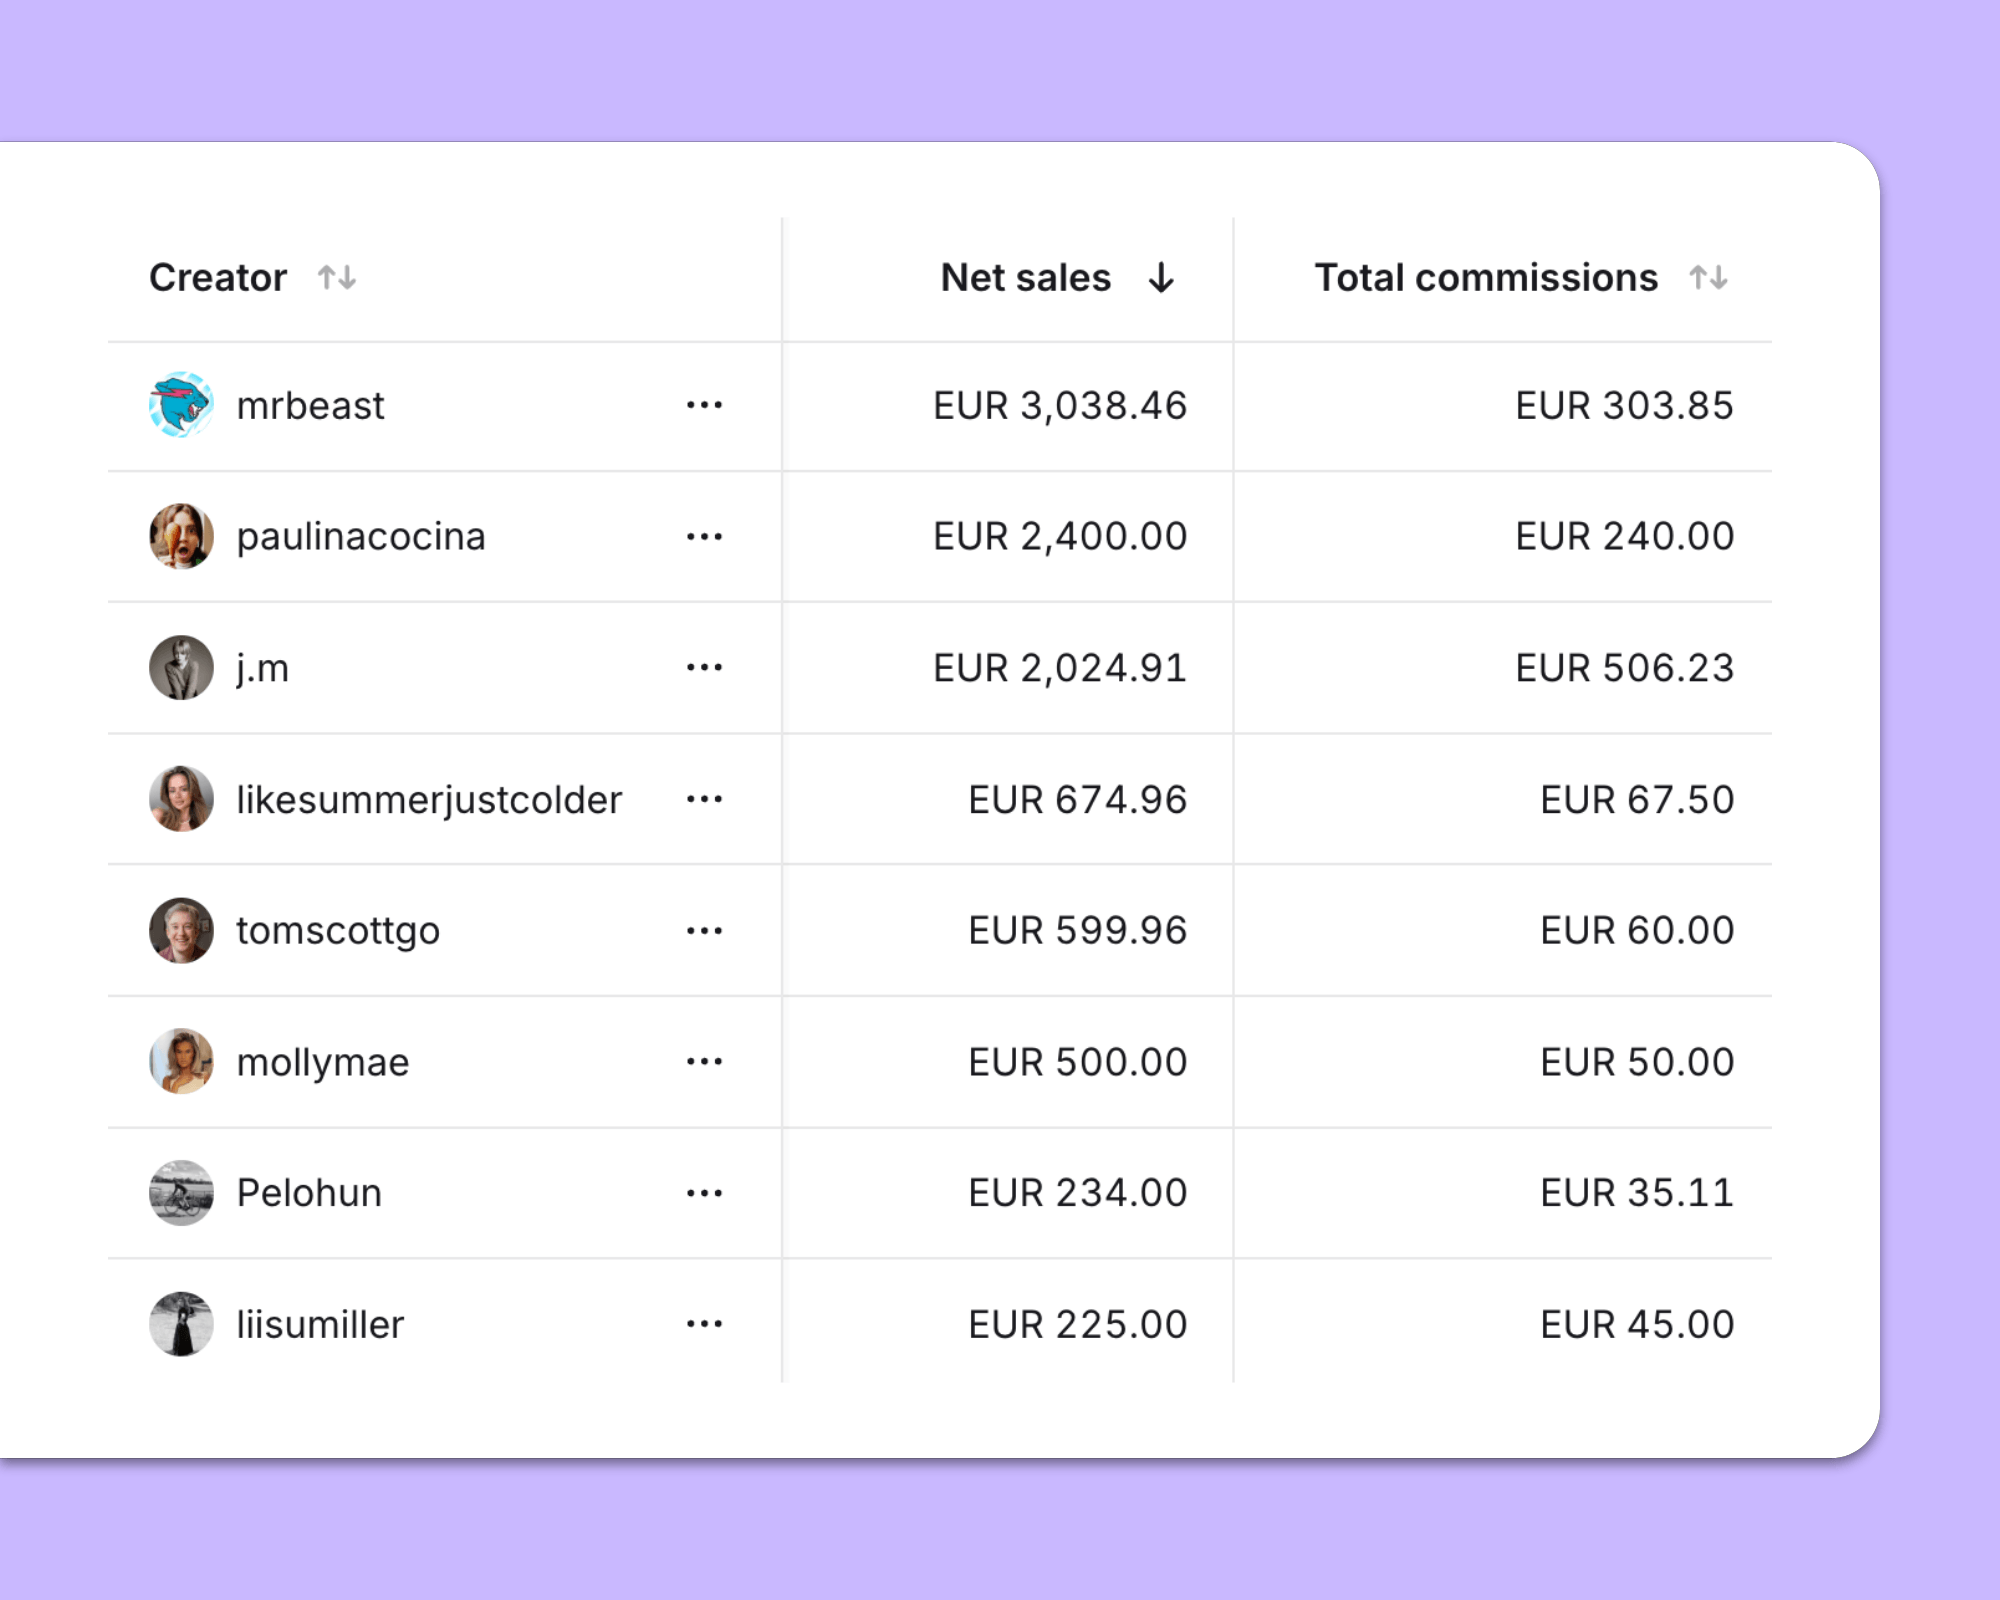
If your store is on Shopify, Modash tracks all sales and revenue at the campaign level, but also per influencer, so you can see exactly where your results are coming from:
Next, we have various metrics designed to demonstrate how effectively you’re spending your influencer marketing bucks, namely:
While each is different, they’re all useful for keeping your budget in check. If CPA goes through the roof or ROAS plummets, it’s time to investigate further – maybe you’re working with the wrong influencers or targeting the wrong audience?
BTW, Modash calculates CPM, ROAS and EMV automatically once you’ve added creator costs 😎
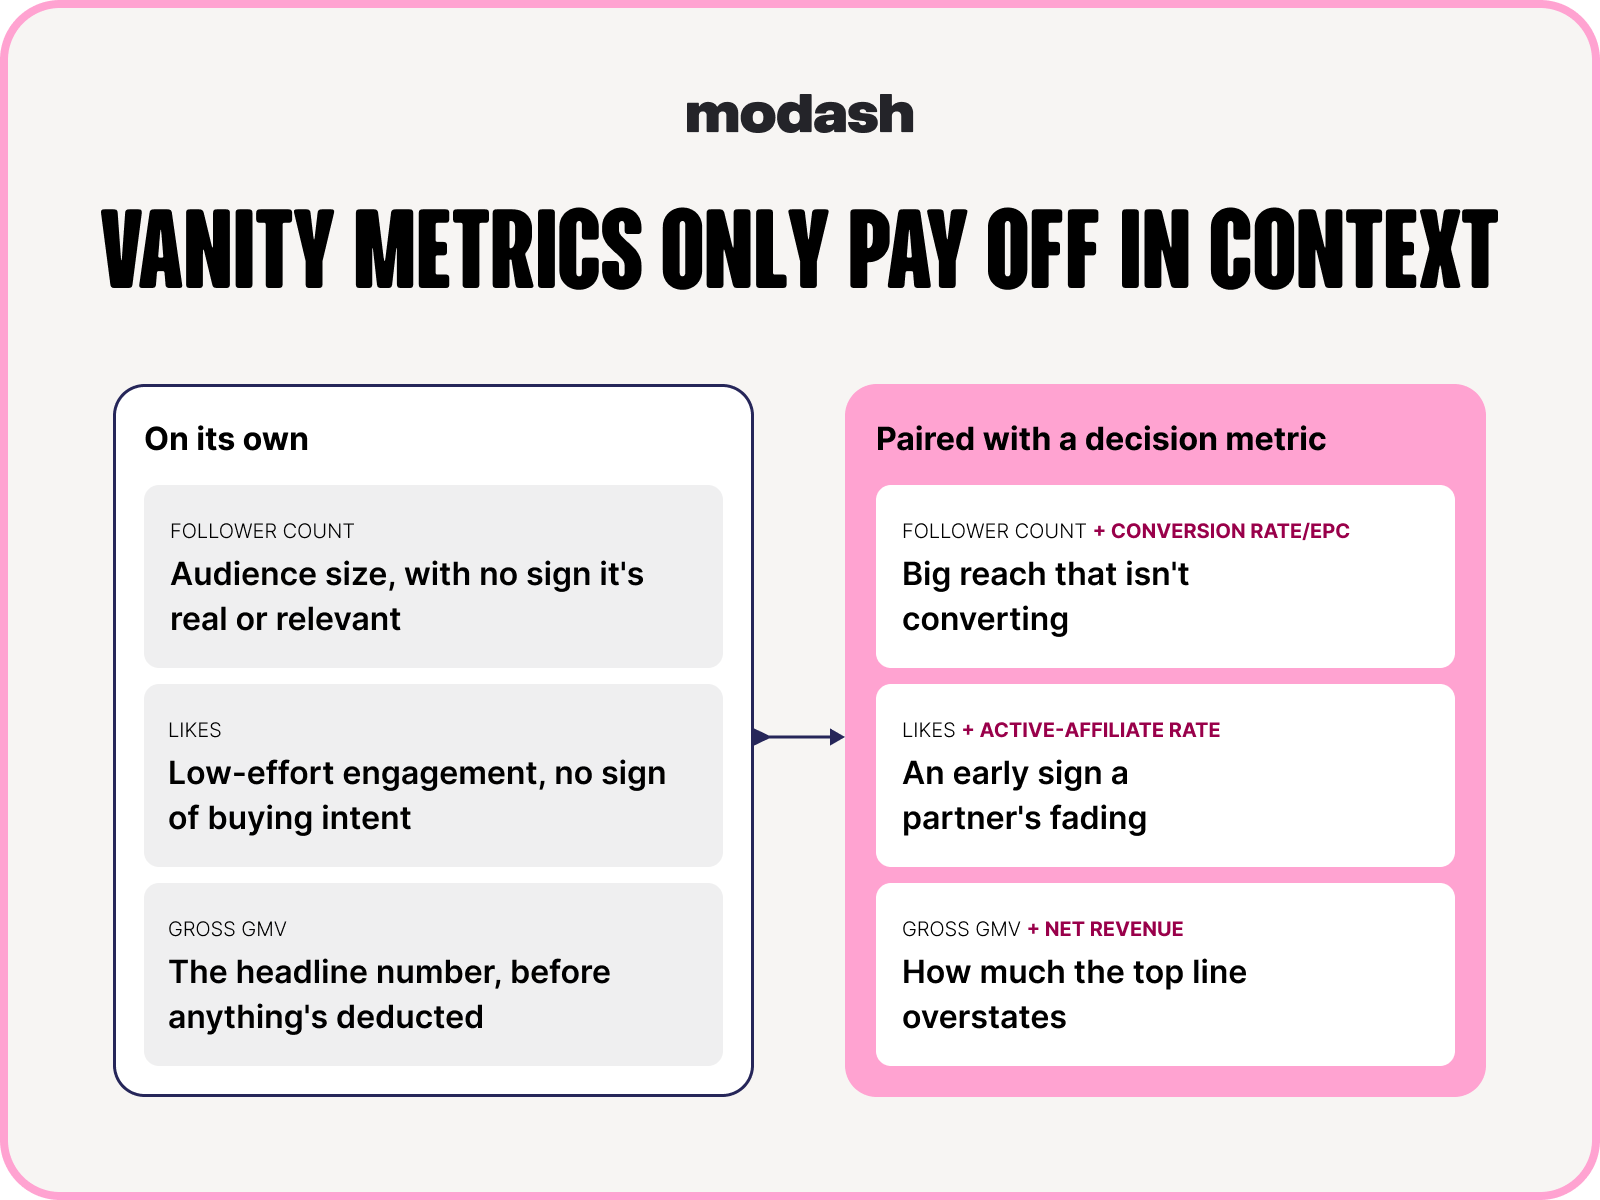
Not only are there plenty of metrics to add to your dashboard, but there are also a couple you should avoid – the vanity metrics.
First up, follower count. Sure, the total number of followers you’re targeting might sound good (more followers = more better, right?), but in reality it means very little. You’re always better off reaching a smaller number of highly relevant accounts rather than a massive number of people with minimal interest in your brand, product, or niche.
And then there’s “likes” – or, at least, “likes” in isolation. Of course, the number of “likes” will feed into your overall engagement rate. But it’s so easy to “like” a post that the interaction alone is more or less worthless.
Actually, maybe “worthless” is a little harsh, because these metrics can be useful with more context attached.
For example, say you’re collabing with a bunch of smaller creators. You’ve used a tool like Modash to weed out the fake followers, and now you can look at “likes” across similar-sized accounts to see who’s driving real engagement.
Or, at the other end of the scale, imagine you’re working with a big name who generates tens of thousands of likes but barely any directly attributable sales. The context of all those “likes” persuades you to dig a little deeper – then you discover a simultaneous spike in branded search and revenue from direct. Safe to say at least some of that uptick will stem from your influencer.
🤓 Pro tip: What’s that? You want even more metrics?? Oh, go on then, find them in Influencer Marketing Metrics: What to Track (and What to Ignore).
While there’s no shortage of metrics you can track, that doesn’t mean you should necessarily be tracking them all.
Rather, it’s a case of focusing on those that directly relate to your campaign goal and the stuff your leadership team cares most about. Here’s how that looks for three goal types – awareness, sales, and product launches:
One dashboard, one campaign goal, one set of related metrics – that’s simple enough to understand. But what if you want to track more than one campaign per dashboard?
Influencer marketing consultant Andreea Moise (AKA the Hype Maven) is broadly into it, but says it depends on the types of campaigns you’re running and how your program is structured:
I think it’s a great idea to track multiple campaigns per dashboard. Gifting, affiliate, paid, whitelisting all require different types of creators and setups, and it can get overwhelming doing it all at once, in different tools. So a unified dash to see and track everything at once is the logical next step.

I’ve already touched on the fact that the numbers in your dashboard aren’t totally infallible. And that’s fine – pobody’s nerfect.
What matters is that you understand when and where to exercise a little healthy skepticism, like in the following examples:
Earlier in the article I noted how, with most influencer marketing platforms, some figures are “real” and others are estimates. For example, let’s take a look at how it works in Modash:
This means there’s a strong chance the numbers in your dashboard won’t 100% match what an influencer sees in their Insta, TikTok, or YouTube backend.
This shouldn’t pose a problem – after all, you’re probably not paying per view or unit of reach – but it’s worth explaining the possible discrepancy if you’re sharing a post-campaign report with your influencer partners.
There’s a whole bunch of reasons why your dashboard likely won’t pick up every single influencer-generated sale.
(In fact, Andreea estimates that roughly 50% – 60% of conversions get missed if you’re tracking solely via links and/or codes.)
One issue is around attribution windows, AKA the maximum time between click and conversion for which a creator can still get paid a commission.
Many platforms adopt a default 7-day window and brands simply run with it. Which means if a customer clicks an influencer’s link but doesn’t buy for 8 days, the creator in question ends up empty-handed.
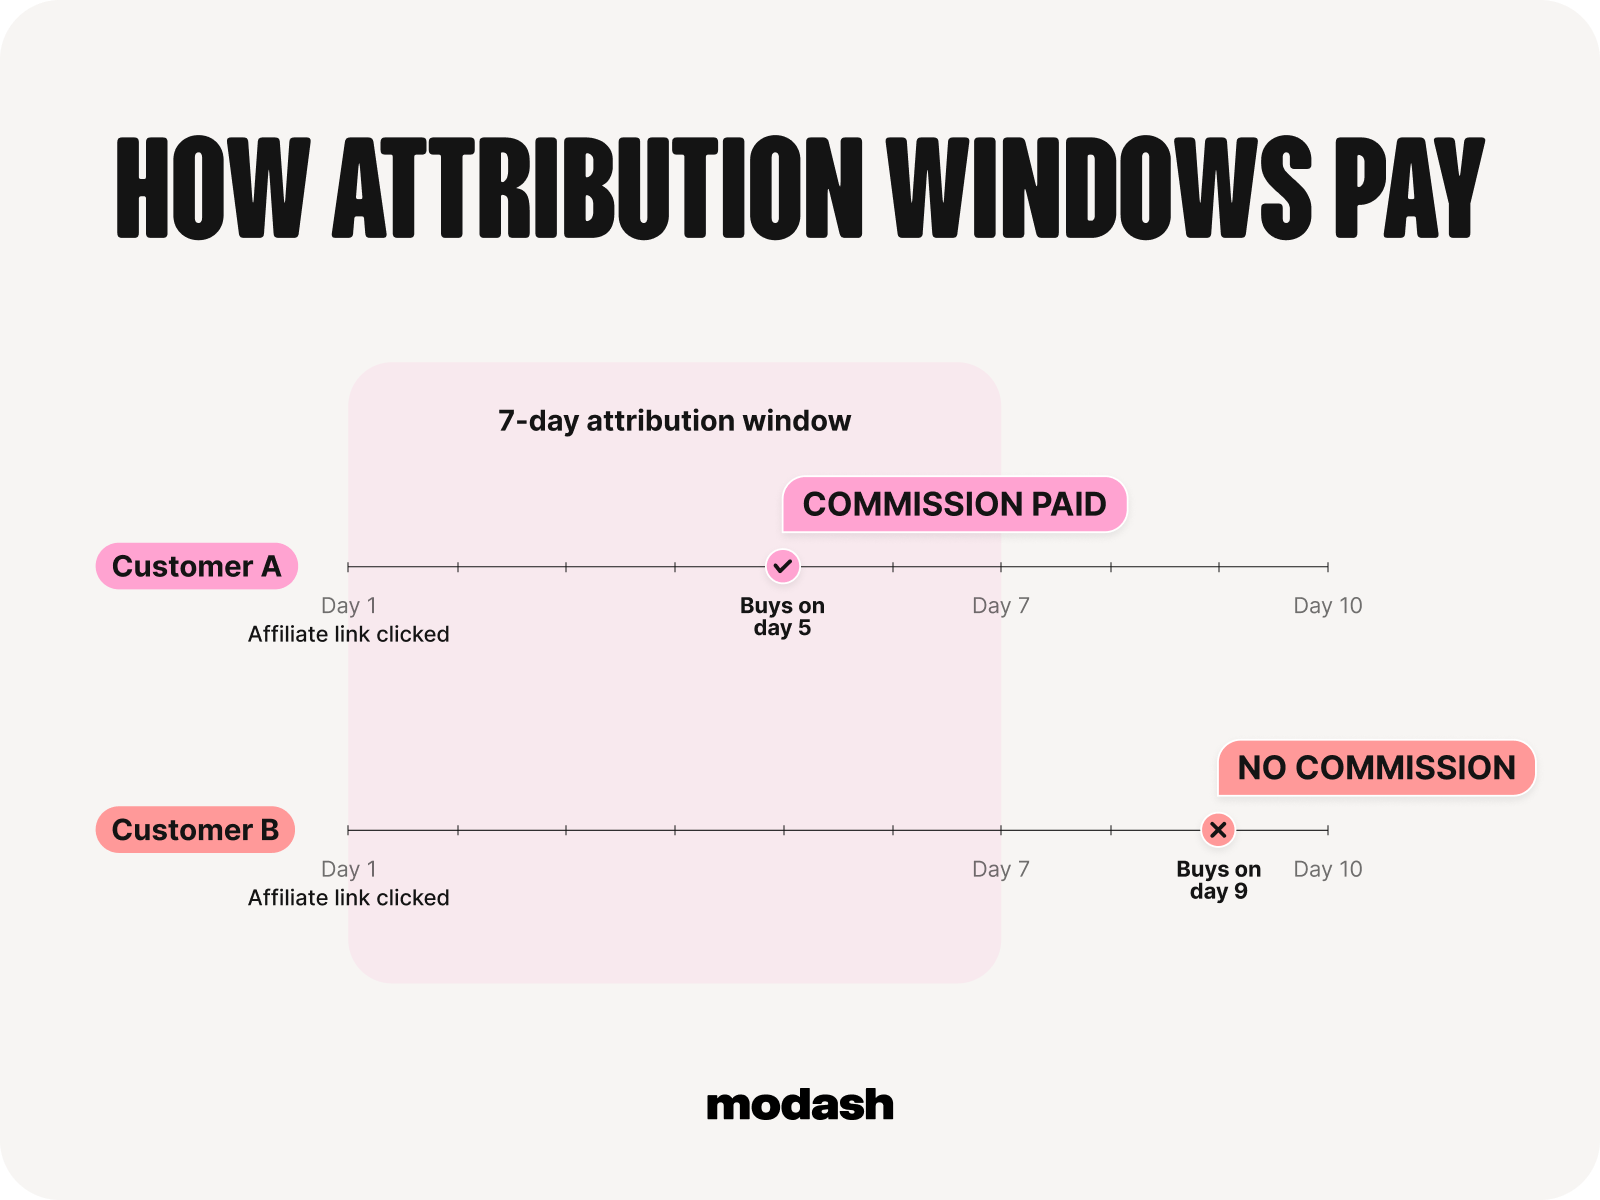
Also, depending on whether the customer interacted with any other channels along the path to purchase, the sale might end up getting credited to organic or direct or email (or something else) instead.
While that might sound unfair, you’ve got to have some limit to attribution.
The best you can do is set a window that aligns with your buyer cycle. A 7-day window should be plenty for a phone case or a lipstick or a pair of socks, but it’s maybe not long enough for a mattress or a $5,000 tuxedo.
This next one’s a real doozy:
Chances are you’re working with a bunch of creators in the same niche. Like, if you’re selling running shoes, it’s a safe bet some of your creator partners will be running influencers.
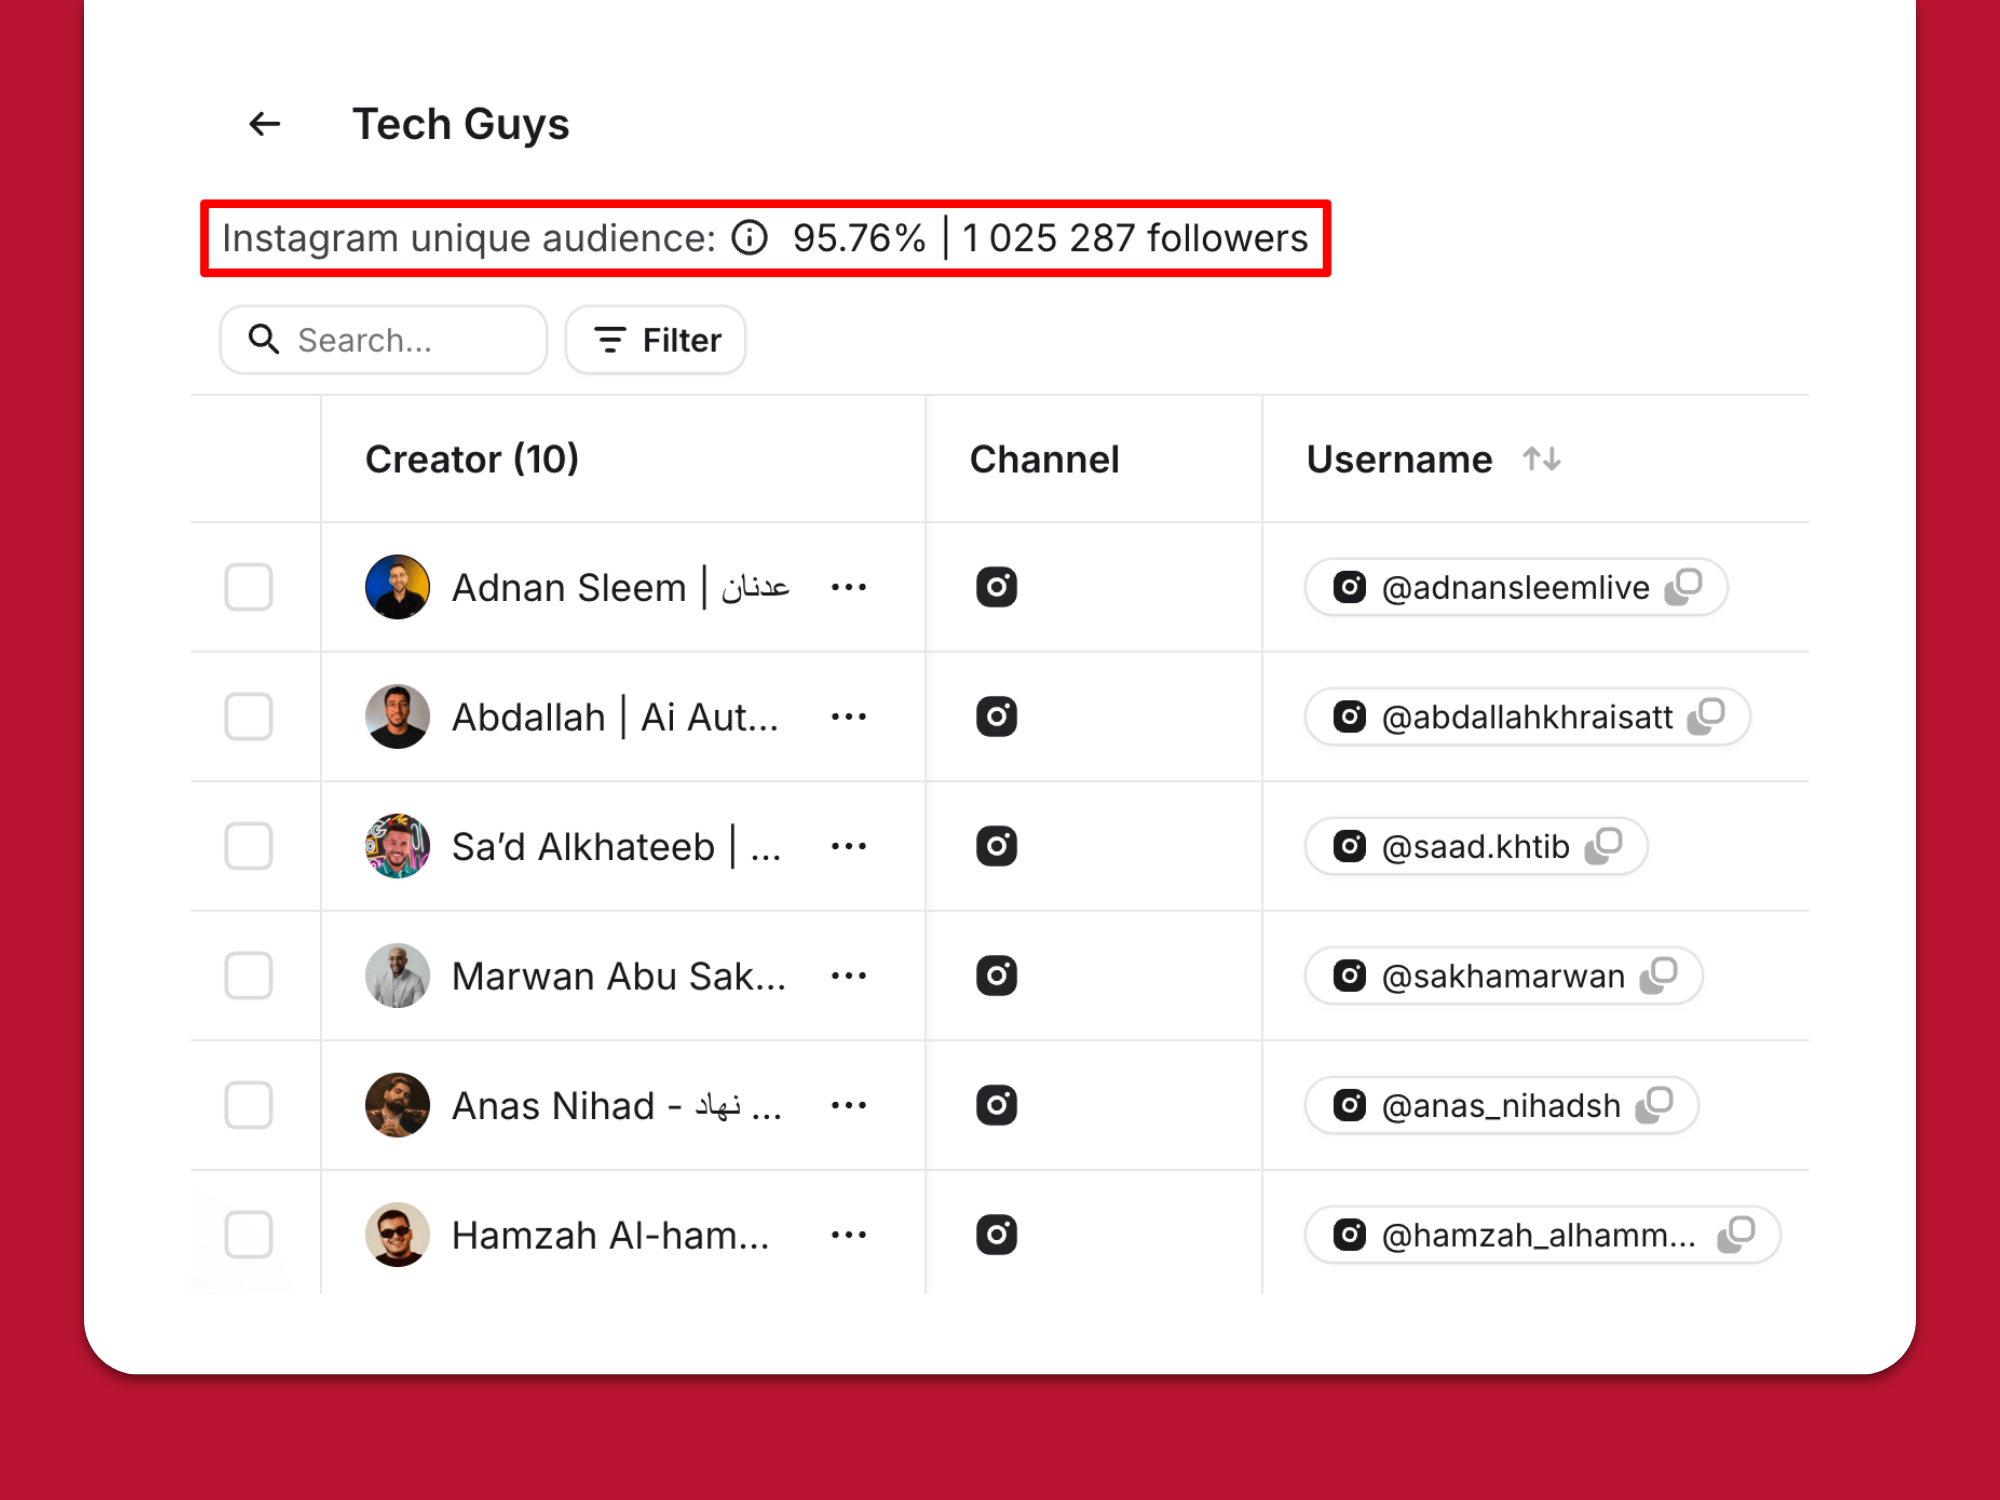
Trouble is, the folks you’re trying to reach – people who ❤️running – are probably gonna follow a bunch of different running-themed accounts. Which means there’s an extremely high chance of audience overlap and double-counting.
Now, in a massive niche like running, this will barely be an issue because there are so many fans and tens of thousands of different influencers – plus it can actually be a good thing to hit the same feeds multiple times to boost recognition.
But if your niche is more, ummm, niche, you’re gonna see a lot more overlap. That’ll cause your reported reach to be much higher than it actually is, plus it’ll put you at real risk of audience fatigue 🥱
🤓 Pro tip: Avoid this using Modash's Instagram unique audience tool, which helps you spot issues with high overlap when you’re building your influencer roster.
It’s great that you can add links to Stories – but don’t be surprised if a lot of clicks on those links vanish before reaching Google Analytics.
Unfortunately, Stories clicks are particularly prone to UTM stripping from in-app browsers. Sure, the traffic will show up somewhere in GA, but it’ll often be tagged to a totally different channel (like direct).
This is a problem because it drags down your blended click-through rate, making your campaign look less effective. Plus, if you didn’t know about this issue, you might assume Stories just aren’t performing for you – when in reality they’re sending a ton of hidden traffic your way.
While there’s no out-and-out fix for this, you can at least understand the scale of the issue by segmenting Stories separately in GA.
For example, if your link-tracking tool shows 1,000 clicks but your “Instagram Stories” segment only reports 300, you know you’re dealing with a depreciation rate of 70% – so you can reasonably assume 70% of conversions from Stories are being incorrectly tracked, too.
You might think you spend too much time on socials, but you’ve got nothing on bots. Those guys are out there scrolling, liking, and commenting 24/7/365.
While it’s obviously super flattering that they like your influencer’s content, those bots are (probably) never gonna buy from you; all they’re doing is inflating the engagement numbers in your dashboard. Which might make you think your campaign is performing better than it really is.
That’s why you should always check fake follower counts before deciding whether to work with an influencer.
Everyone has bots in their audience – anything up to ~25% fake followers is perfectly normal. But if the number is significantly higher, it might be better to steer clear (or, at the very least, take their engagement figures with a pinch of salt).
Choosing your dashboard setup based on what you might need 5 years down the line is a surefire way to waste a ton of money. So keep it simple and buy (or build) what you actually need right now.
If you’re only gonna be working with a dozen-or-so influencers for the foreseeable future, tracking campaigns in a spreadsheet will work perfectly well. And unless you’re looking for massive scale and multichannel reporting, there’s no point dropping $30K+ a year on an enterprise-grade influencer marketing platform or grappling with SQL queries and all that jazz.
Choose what works now, plug in the handful of metrics that relate to your campaign goal, and upgrade if/when your current setup starts creaking.
For most brands looking to balance costs, functionality, and scalability, tools like Modash are an easy choice. With Modash, you can run your campaigns end to end, while our built-in tracking eliminates the need to build a dashboard from scratch.
👉 See for yourself by starting your 14-day free Modash trial today!
Influencer marketing dashboards give a live, at-a-glace view of how campaigns and creators are performing. They can incorporate whatever awareness, engagement, conversion, or content volume-related metrics are needed to demonstrate the impact of an influencer program.
That depends on the goal of your influencer campaign. For awareness campaigns, you’ll be tracking metrics like reach, impressions, and engagement. Whereas if sales are your goal, you’d include numbers like clicks, revenue, conversions, ROAS, and AOV.
Spreadsheets are enough to track influencer marketing performance if you’re:
However, if you’re scaling your program or already working with 10+ creators, a spreadsheet is gonna be pretty unwieldy, so you’ll want to consider a dedicated tool like Modash.
The simple answer is “the more often, the better”. That way, you know you’re always working with up-to-date numbers. With Modash, campaign metrics like views, likes, comments update every 12 hours, while more time-sensitive data updates more frequently – for example, Shopify orders and sales typically arrive in ~5 minutes.
Yes, theoretically – but depending on your influencer marketing platform, you might have to export data from each campaign, then add it to a single dashboard in a different platform.