AG1 Influencer Marketing Strategy
(2026 Data & Insights)
We analyzed 3.4k pieces of influencer content sponsored by AG1 over the last 12 months.
This report breaks down where & how AG1 invests in influencer marketing, which social platforms they prioritize, top geographical markets, and more.
The data in this report comes from Modash's Brand Collaborations API.
P.S. for a simple list of influencers who have collaborated with AG1, see here: AG1 influencers.
Influencer activity throughout the year
AG1's influencer campaigns are active year-round with notable month-to-month fluctuation. The chart below shows month-by-month data for total sponsored posts tracked.
AG1's influencer activity by month
Number of sponsored posts
AG1's influencer output appears relatively consistent throughout the year, averaging about 286 sponsored posts per month. January recorded the highest volume at 389 posts (36% above average), while June was the quietest at 113 posts.
Social platforms breakdown
In our dataset (which only includes Instagram, YouTube, and TikTok), this is how the volume of AG1's sponsored influencer collaborations break down by social platform:
- YouTube: 1.9k posts (54.5%)
- Instagram: 1.3k posts (38.3%)
- TikTok: 248 posts (7.2%)
AG1's influencer activity by platform
Share of sponsored content by social network
YouTube influencer marketing is a clear focus for AG1.
Here are 3 examples of AG1's recent sponsored collaborations (one each for Instagram, TikTok, YouTube).
thetinychefshow x AG1
![Instagram post by @thetinychefshow for AG1. Caption reads: [...] hit that job market again!! Thanks @drinkag1....](https://images.od.modash.io/00556a214949301df03d03574f68ef49645f1f7b)
Influencer bio
Cooking up delicious food w the Tiny Herbivore Chef 🍏🍅🥕🥦🥥⠀ Shop, fwend cwub & more! thetinychefshow.com⠀ Partners: collabs@thetinychefshow.com
Collaboration metrics
Get a free trial to find more data on influencer audiences, performance, and collaborations.
nicolekauffman3 x AG1
![TikTok post by @nicolekauffman3 for AG1. Caption reads: [...] me living in an RV full time with the new....](https://images.od.modash.io/53eff9c50a833232699d245e065b5b2160c4b043)
Influencer bio
living in our 35 ft RV🚐🏞️ roadtrips | camping | outdoors 📍prob driving somewhere new 💌 nicolek@select.co
Collaboration metrics
Get a free trial to find more data on influencer audiences, performance, and collaborations.
Wendigoon x AG1

Influencer bio
Good vibes and ok content Open to sponsorships! Business email: wendigoon@manatalentgroup.com Personal/Inquiries email: wendigoonmail@gmail.com
Collaboration metrics
Get a free trial to find more data on influencer audiences, performance, and collaborations.
If you break this down further by content type on YouTube, this is what it looks like:
- Videos: 94.2%
- Shorts: 5.8%
💡 Related resource: How To Find YouTube Influencers.
Influencer audience size breakdown (by views)
For their top social platform (YouTube), here is a breakdown of the type of influencers AG1 are collaborating with, by audience size.
Note: this breakdown is based on each influencer's average views (not follower/subscriber count), because views typically correlate more closely with influencer pricing and impact.
AG1's influencers average views (YouTube)
Based on each influencer's average views per post
AG1's creator selection appears relatively diversified across size tiers, with no single segment dominating. This suggests a balanced approach to influencer partnerships, spreading investment across different audience sizes.
Here is an example of a sponsored collaboration with a larger-audience creator on YouTube (1.4M avg views/post):
CleetusM x AG1
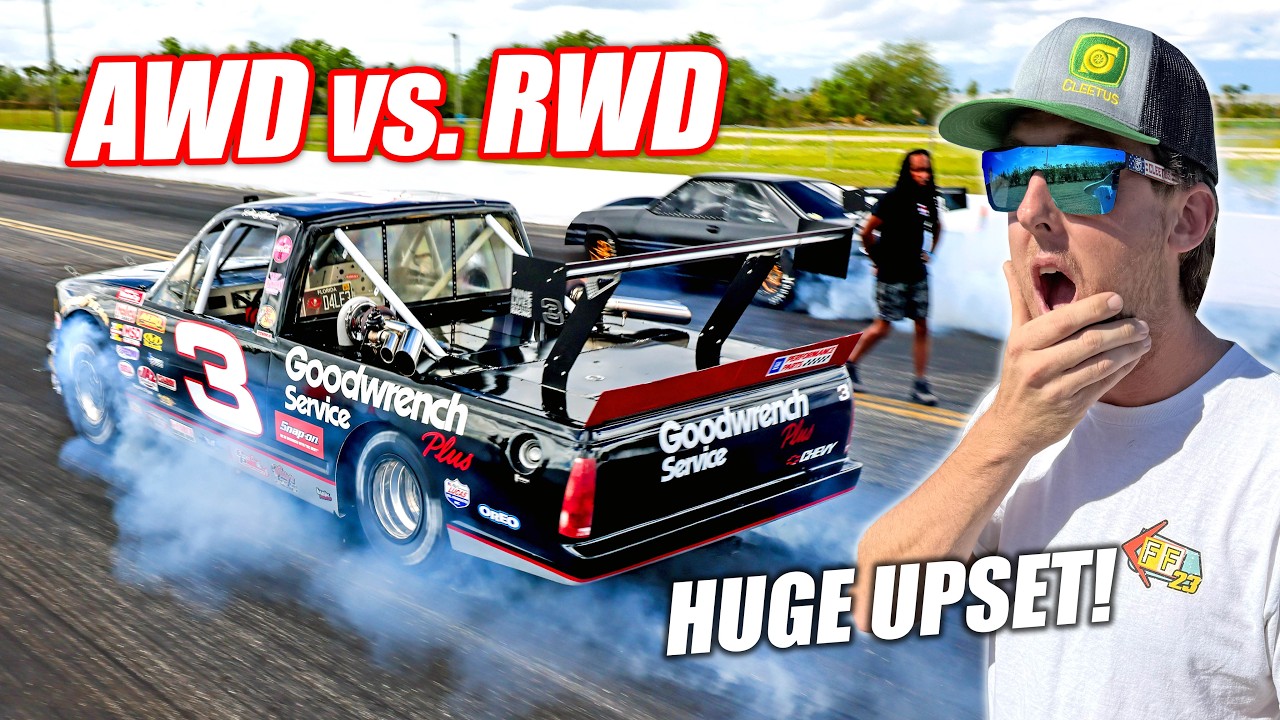
Influencer bio
Collaboration metrics
Get a free trial to find more data on influencer audiences, performance, and collaborations.
And here is another example with a smaller creator on YouTube (9.0k avg views/post):
Eindbazenpodcast x AG1

Influencer bio
Michel Vos en Wiggert Meerman spreken tijdens deze podcasts met bijzondere mensen – Eindbazen – die een uitzonderlijke prestatie of bijdrage hebben geleverd op het gebied van sport, wetenschap, ondernemen, cultuur, maatschappij of technologie! De nummer één podcast van Nederland met al meer dan een miljoen downloads per maand!
Collaboration metrics
Get a free trial to find more data on influencer audiences, performance, and collaborations.
AG1's repeat partnerships
Out of 1.4k unique influencers in our dataset, 168 of them (12%) posted content for AG1 in 3 or more separate calendar months. The most consistent partner is @SolvingTheMoneyProblem, who has collaborated across 12 months with 234 total posts. @SolvingTheMoneyProblem alone accounts for 7% of all tracked sponsored content.
Here are 3 examples of AG1's repeat influencer partnerships, with links to the sponsored content.
SolvingTheMoneyProblem x AG1
![YouTube post by @SolvingTheMoneyProblem for AG1. Caption reads: [...] 1 Yr Supply of Vitamin D + 5 AG1 Travel....](https://images.od.modash.io/b245e281fdda7986a360e81a4b639c82a639f907)
![YouTube post by @SolvingTheMoneyProblem for AG1. Caption reads: ► AG1 (FREE Welcome Kit: Vitamin D3+K2 [...].](https://images.od.modash.io/0f734d7a0114c1580684158920f8c39334c0ad47)
![YouTube post by @SolvingTheMoneyProblem for AG1. Caption reads: ► AG1 (FREE Welcome Kit: Vitamin D3+K2 [...].](https://images.od.modash.io/bf0edd8b362e388bcb1ecf5a9f18175574f177a2)
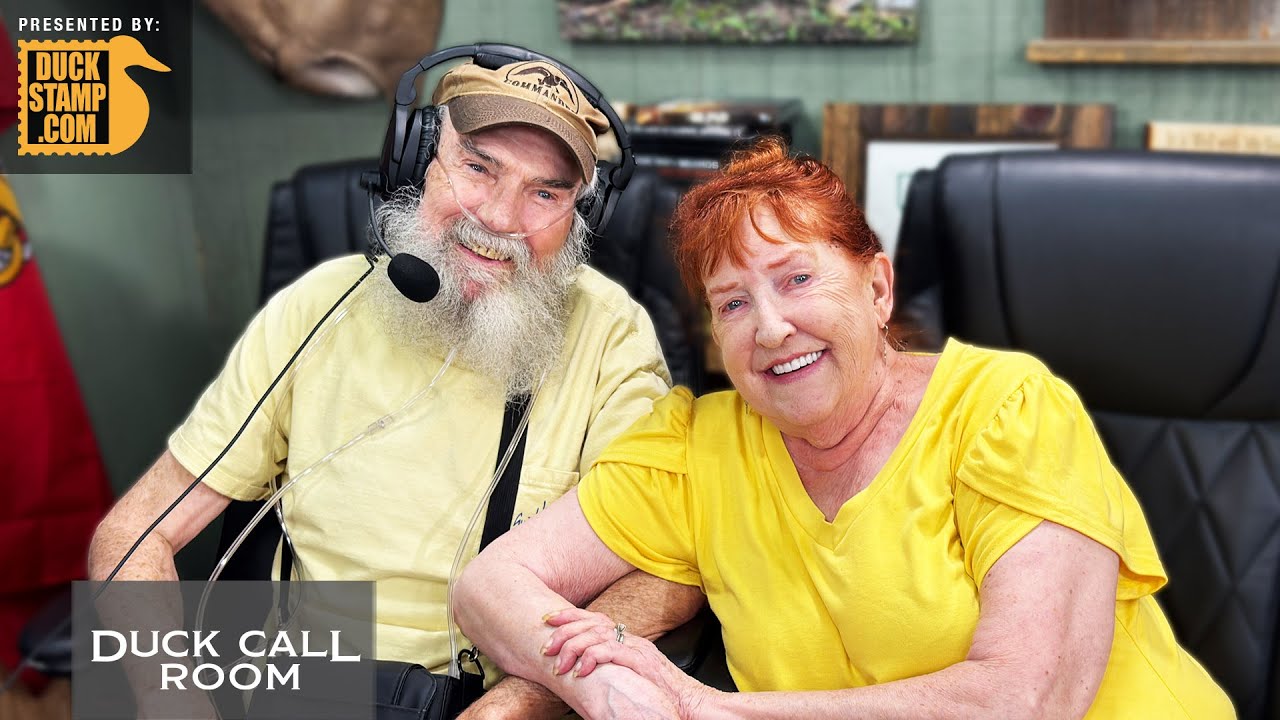
duckcallroom x AG1
![YouTube post by @duckcallroom for AG1. Caption reads: [...] kit with a shaker bottle, 5 AG1 travel....](https://images.od.modash.io/e6c4a89232a4eb37f1fcdd3392f2c0a93ec0641f)
![YouTube post by @duckcallroom for AG1. Caption reads: [...] help save a life! — Get 3 FREE AG1 travel....](https://images.od.modash.io/08c82204c962cce3c6fef367ed88629804eadc3b)
hawks_hayden x AG1
![Instagram post by @hawks_hayden for AG1. Caption reads: [...] have been wondering about @drinkag1, here is....](https://images.od.modash.io/98b994a77358033a1c3020a6436ebfe2543761cf)
![Instagram post by @hawks_hayden for AG1. Caption reads: @drinkag1 and @drink_agz is now at [...].](https://images.od.modash.io/0143a977621b760b3fefdf7f71d27c67ecf6117e)
![Instagram post by @hawks_hayden for AG1. Caption reads: [...] morning with a bottle of @drinkag1. This....](https://images.od.modash.io/e062a1c4116073dc575354b50a407f400d183432)
💡 Related resource: Long-Term Influencer Partnerships: Pros, Cons & How The Pros Manage Them.
Geographical breakdown
In our dataset, United States is where AG1 had the most influencer activity. 60.8% of their live influencer content in the last 12 months was posted by American influencers.
Based on the percentage of influencer content per market, other important markets include:
- United Kingdom (8.4%)
- Germany (8.2%)
- Canada (5.5%)
AG1's influencer activity by market
Here is another example of AG1 collaborating with an influencer in United States.
kaylagresh x AG1
![TikTok post by @kaylagresh for AG1. Caption reads: [...] to your nearest Target to pick up AG1 or AGZ....](https://images.od.modash.io/64e60f67146b1ee58c3eecd4c7aeee0d4bb5c7fd)
AG1's influencer activity vs. related brands
AG1 targets wellness and daily habit consumers, closely overlapping with Huel’s functional nutrition positioning and Goli’s supplement-driven health audience. These competitors provide clear comparisons for creator testimonials, routine integrations, and subscription messaging.
Total influencer content
AG1 vs. related brands influencer activity
Total sponsored posts tracked (last 12 months)
Goli leads with 40.3k sponsored posts, significantly outpacing Huel (4.5k posts) and AG1 (3.4k posts). Across all three brands, the average volume is 16.1k posts, indicating mature, scaled influencer programs. Goli has far more total posts than AG1 and Huel.
By social platform
AG1 vs. related brands influencer activity (by social platform)
Sponsored posts by platform
AG1 leads on YouTube, while Huel has the most activity on Instagram and Goli has the most activity on TikTok. The gap is most notable on TikTok, with Goli at 39.4k, Huel at 1.5k, AG1 at 248 posts. Goli's activity is particularly concentrated on TikTok. On TikTok, Goli has far more posts than AG1 and Huel.
By geographical market
AG1 vs. related brands influencer activity (by country)
Estimated sponsored posts in AG1's top markets
Goli has the highest estimated sponsored-post volume in United States (27k posts, 67.3%), Brazil (1.9k posts, 4.8%), Canada (1.8k posts, 4.4%), suggesting a North America focus, while Huel has the highest estimated sponsored-post volume in United Kingdom (1.3k posts, 28.1%), India (150 posts, 3.3%), while AG1 leads in Germany with 282 posts (8.2%). Looking at United States specifically, the split is Goli at 27k posts (67.3%), AG1 at 2.1k posts (60.8%), Huel at 2k posts (45%). AG1's strength in Germany may indicate a home-market focus, while Goli shows broader regional investment.
Read more influencer strategy breakdowns
Looking for more like this? Here are 5 similar influencer marketing strategy breakdowns for other brands:
- Huel's Influencer Marketing Strategy
- Goli's Influencer Marketing Strategy
- philosophy's Influencer Marketing Strategy
- WalkingPad's Influencer Marketing Strategy
- Vince Camuto's Influencer Marketing Strategy
Or, if you want to access data like this for your own software or processes, take a look at Modash's API products:
Frequently asked questions
Scaling your influencer program?
When you outgrow your mishmash of spreadsheets & free tools, try Modash. Find & email influencers, track campaigns, ship products & more - all in one place.