Cold Culture Influencer Marketing Strategy
(2026 Data & Insights)
We analyzed 4.1k pieces of influencer content sponsored by Cold Culture over the last 12 months.
This report breaks down where & how Cold Culture invests in influencer marketing, which social platforms they prioritize, top geographical markets, and more.
The data in this report comes from Modash's Brand Collaborations API.
P.S. for a simple list of influencers who have collaborated with Cold Culture, see here: Cold Culture influencers.
Influencer activity throughout the year
Cold Culture's influencer campaigns are active year-round with notable month-to-month fluctuation. The chart below shows month-by-month data for total sponsored posts tracked.
Cold Culture's influencer activity by month
Number of sponsored posts
Cold Culture's influencer activity appears to have tapered over the year, from 211 posts in January down to 179 in December. May was the busiest month at 588 posts, 76% above the monthly average.
Social platforms breakdown
In our dataset (which only includes Instagram, YouTube, and TikTok), this is how the volume of Cold Culture's sponsored influencer collaborations break down by social platform:
- TikTok: 4.0k posts (99.9%)
- YouTube: 4 posts (0.1%)
Cold Culture's influencer activity by platform
Share of sponsored content by social network
TikTok influencer marketing is a clear focus for Cold Culture.
Here are 1 examples of Cold Culture's recent sponsored collaborations (one each for TikTok).
kathy_havana x Cold Culture
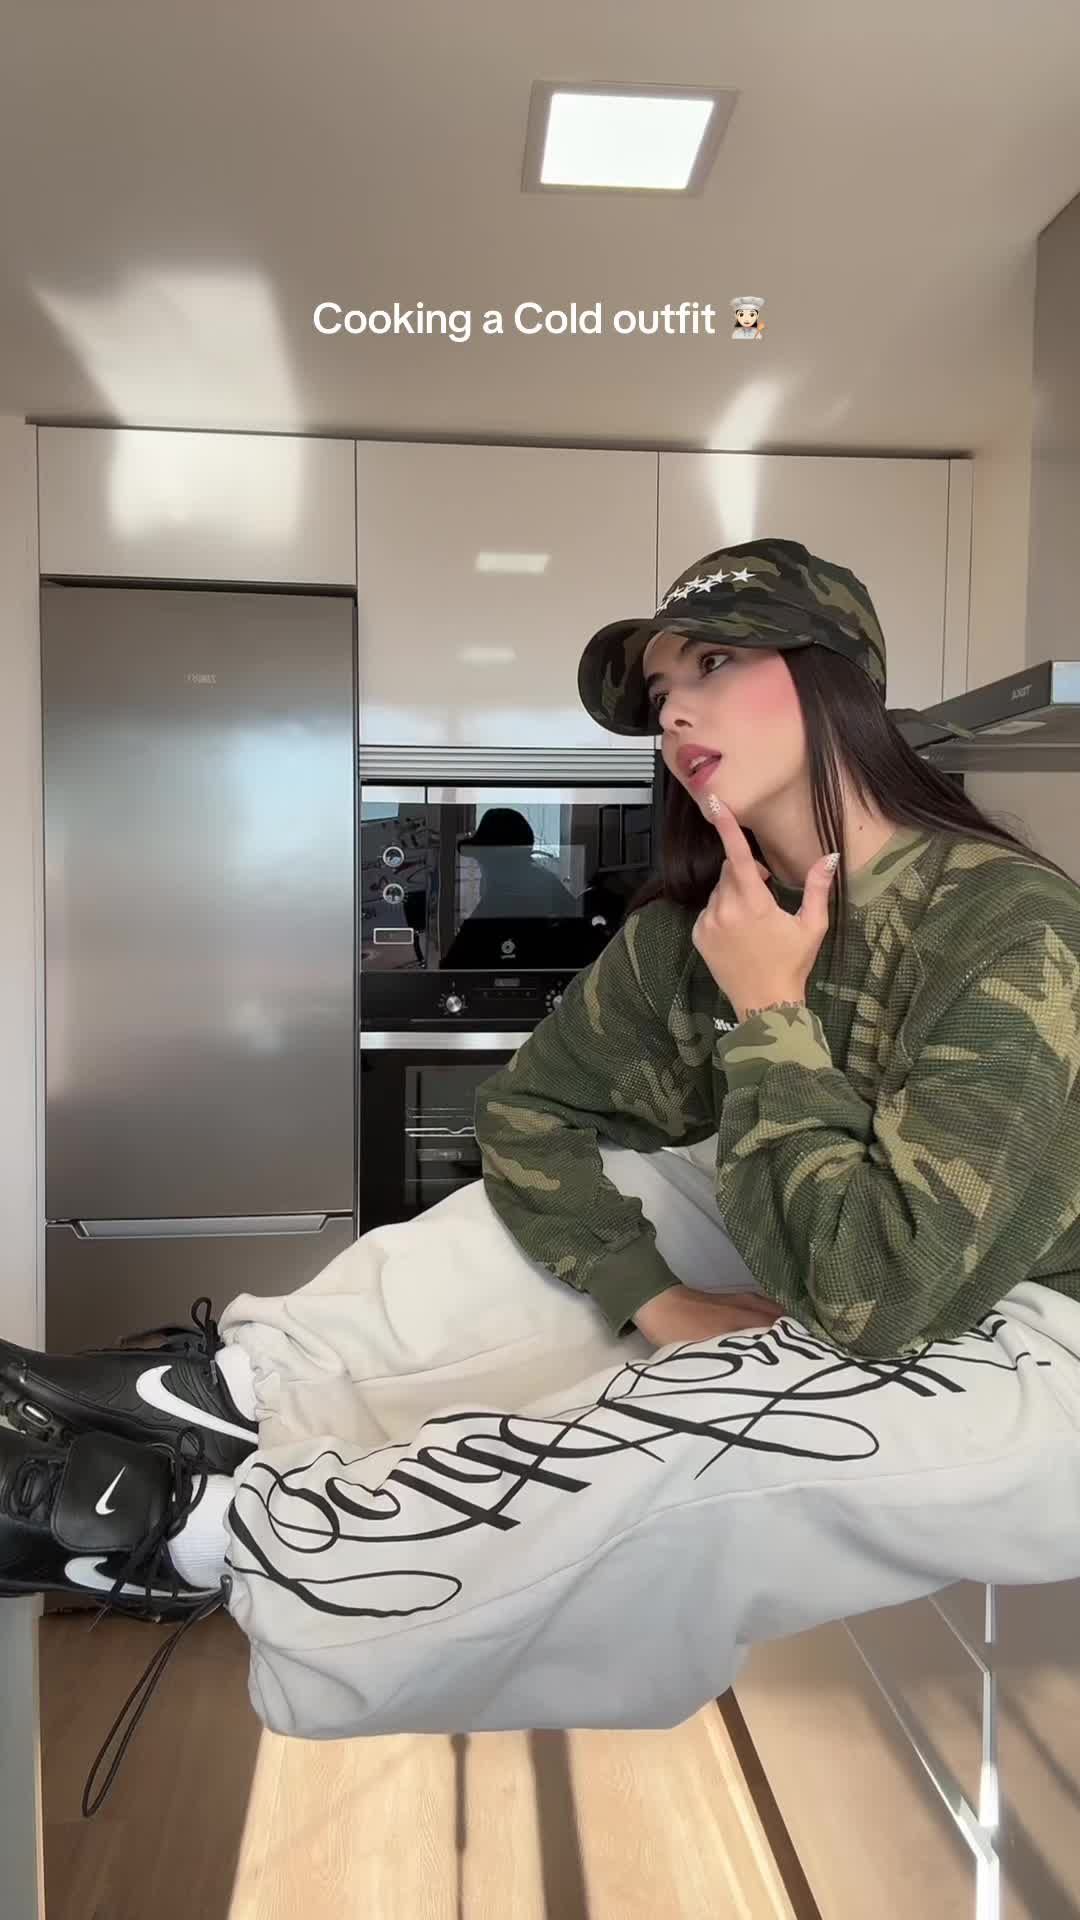
Influencer bio
Cubana en Madrid 📩 kathydp0205@gmail.com
Collaboration metrics
Get a free trial to find more data on influencer audiences, performance, and collaborations.
If you break this down further by content type on TikTok, this is what it looks like:
- Videos: 98%
- Carousels: 2%
💡 Related resource: How To Find TikTok Influencers.
Influencer audience size breakdown (by views)
For their top social platform (TikTok), here is a breakdown of the type of influencers Cold Culture are collaborating with, by audience size.
Note: this breakdown is based on each influencer's average views (not follower/subscriber count), because views typically correlate more closely with influencer pricing and impact.
Cold Culture's influencers average views (TikTok)
Based on each influencer's average views per post
Cold Culture's creator selection appears relatively diversified across size tiers, with no single segment dominating. This suggests a balanced approach to influencer partnerships, spreading investment across different audience sizes.
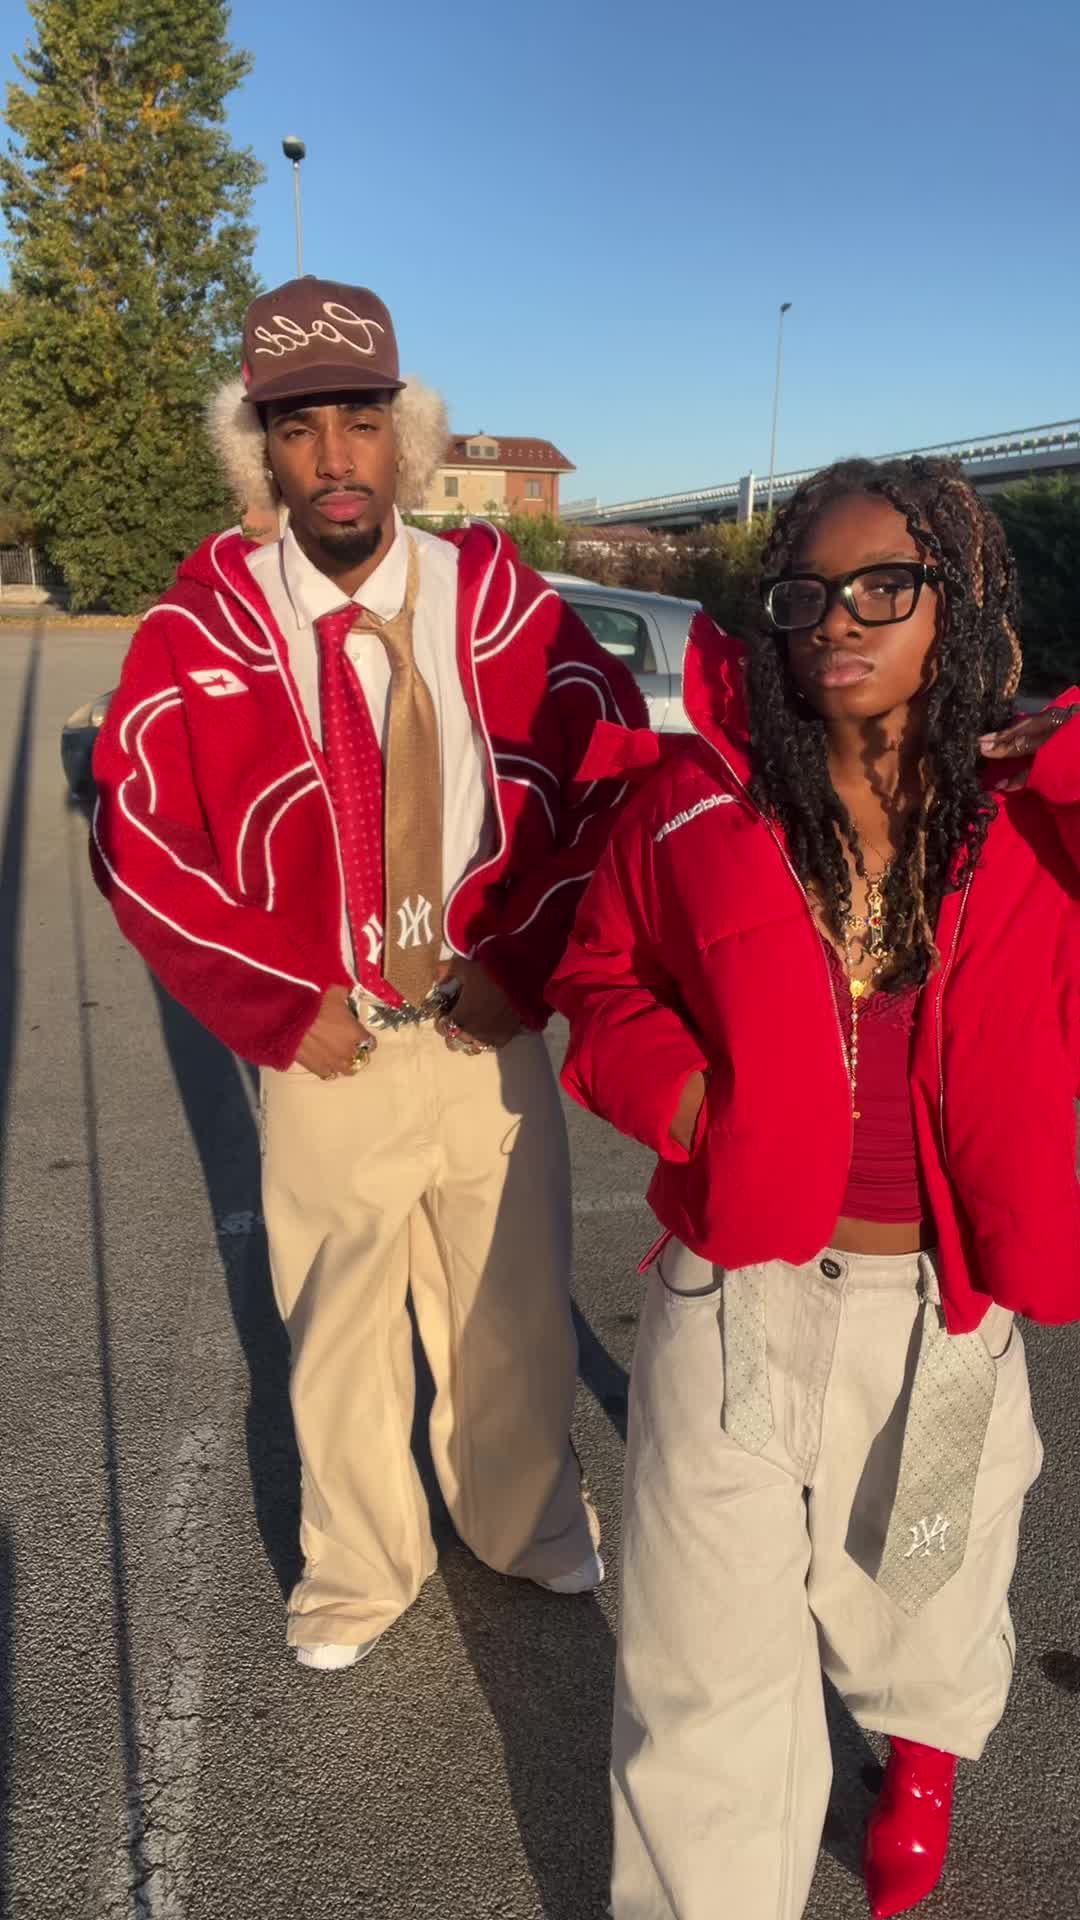
Here is an example of a sponsored collaboration with a larger-audience creator on TikTok (4.1M avg views/post):
skyynetwork x Cold Culture

Influencer bio
Business inquiries only: agent@russetagency.com 23 NC📍
Collaboration metrics
Get a free trial to find more data on influencer audiences, performance, and collaborations.
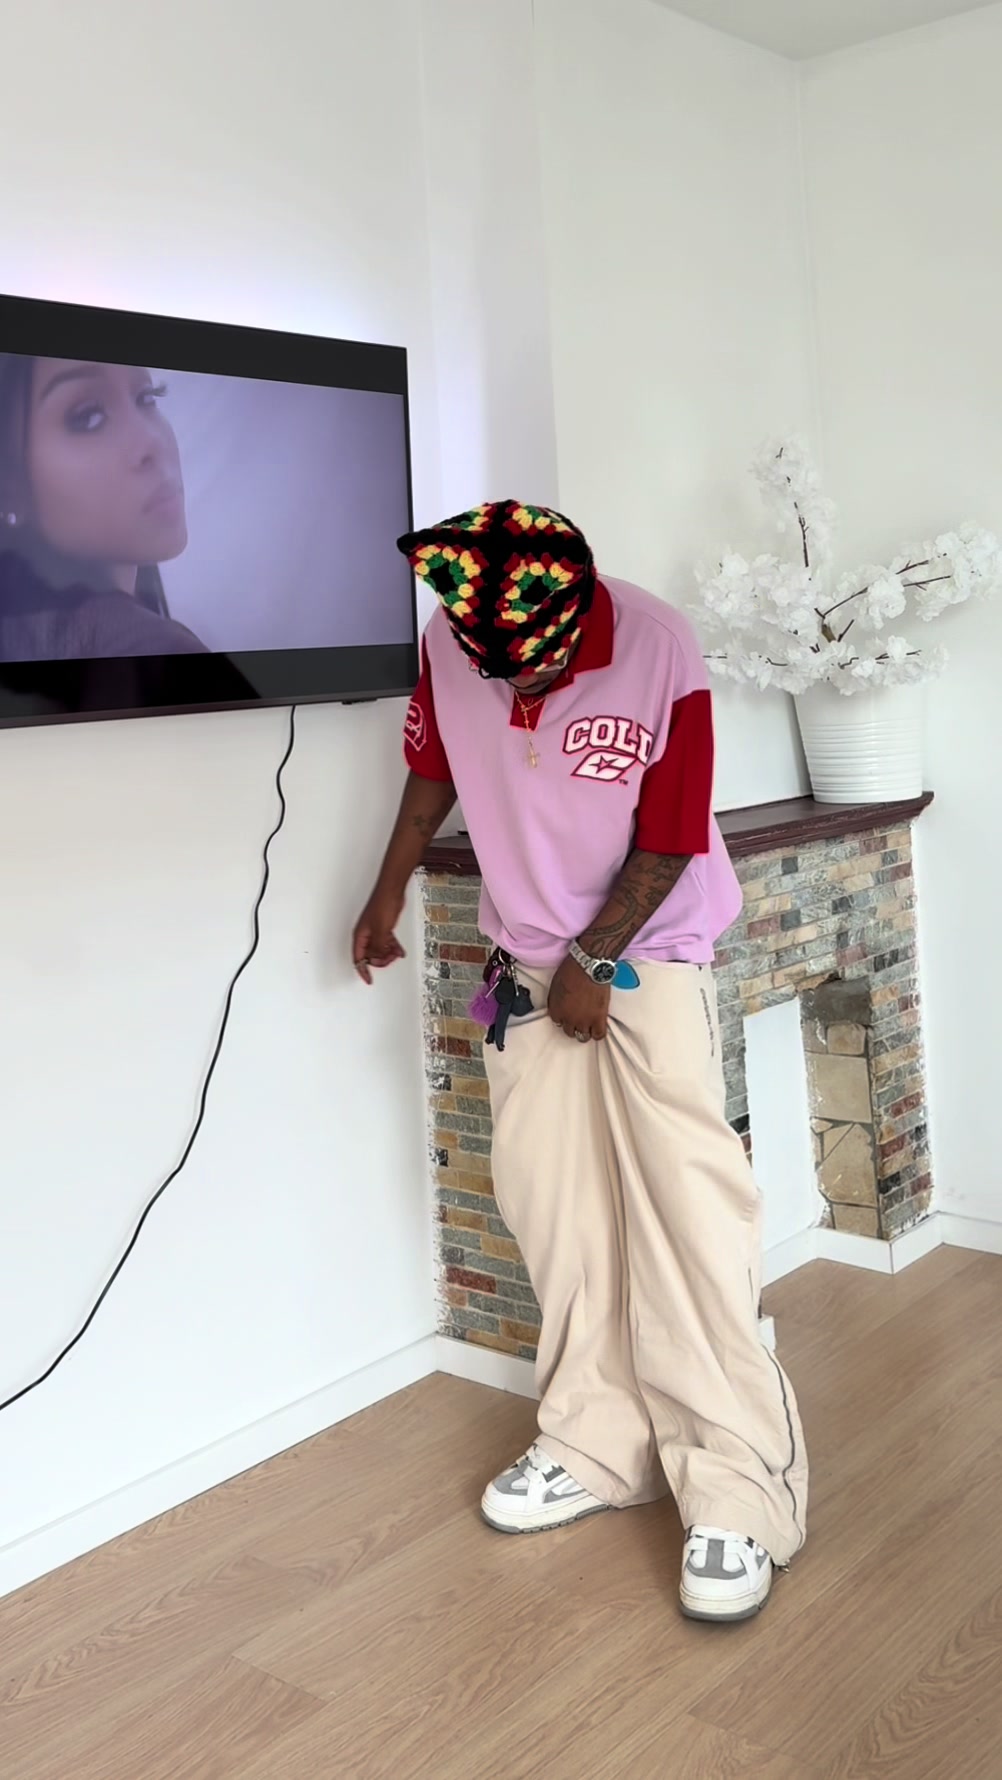
And here is another example with a smaller creator on TikTok (9.6k avg views/post):
berenzcn x Cold Culture

Influencer bio
🇹🇷 DANCER 📥berenzcn@gmx.de 👻: berryzcn 🛍️ "Berry" % @cfab by creamy fabrics
Collaboration metrics
Get a free trial to find more data on influencer audiences, performance, and collaborations.
Cold Culture's repeat partnerships
Out of 2.4k unique influencers in our dataset, 120 of them (5%) posted content for Cold Culture in 3 or more separate calendar months. The most consistent partner is @loeiza.efl, who has collaborated across 9 months with 14 total posts.
Here are 3 examples of Cold Culture's repeat influencer partnerships, with links to the sponsored content.
mubaxrak x Cold Culture
![TikTok post by @mubaxrak for Cold Culture. Caption reads: [...] jackets my new go to🥶 @Cold Culture....](https://images.od.modash.io/8c9a0ec777708130a73e9031360b68affeff2c82)
![TikTok post by @mubaxrak for Cold Culture. Caption reads: [...] fits nvr miss ! sweater:@Cold Culture....](https://images.od.modash.io/63c0788420d2e844f97d38e4d400241d021ad47f)
![TikTok post by @mubaxrak for Cold Culture. Caption reads: [...] is 1 good pair of jeans: @Cold Culture....](https://images.od.modash.io/844870bb4bc18ee6dbceea2c234aedc5b19c74ac)
brazyswagg x Cold Culture
![TikTok post by @brazyswagg for Cold Culture. Caption reads: [...] FIGLIA😍😍😍 full fit @Cold Culture....](https://images.od.modash.io/c1b27e48877d4acc76148d7b9dc097f5f463fc01)
![TikTok post by @brazyswagg for Cold Culture. Caption reads: [...] @ilverobellofigo My fit @Cold Culture ❤️....](https://images.od.modash.io/5f61a9902e3fc2bcf2f8091e493a01659a1278fc)
kandry_simth x Cold Culture
💡 Related resource: Long-Term Influencer Partnerships: Pros, Cons & How The Pros Manage Them.
Geographical breakdown
In our dataset, France is where Cold Culture had the most influencer activity. 46.2% of their live influencer content in the last 12 months was posted by French influencers.
Based on the percentage of influencer content per market, other important markets include:
- Spain (39.2%)
- Belgium (3.7%)
- Argentina (2.8%)
Cold Culture's influencer activity by market
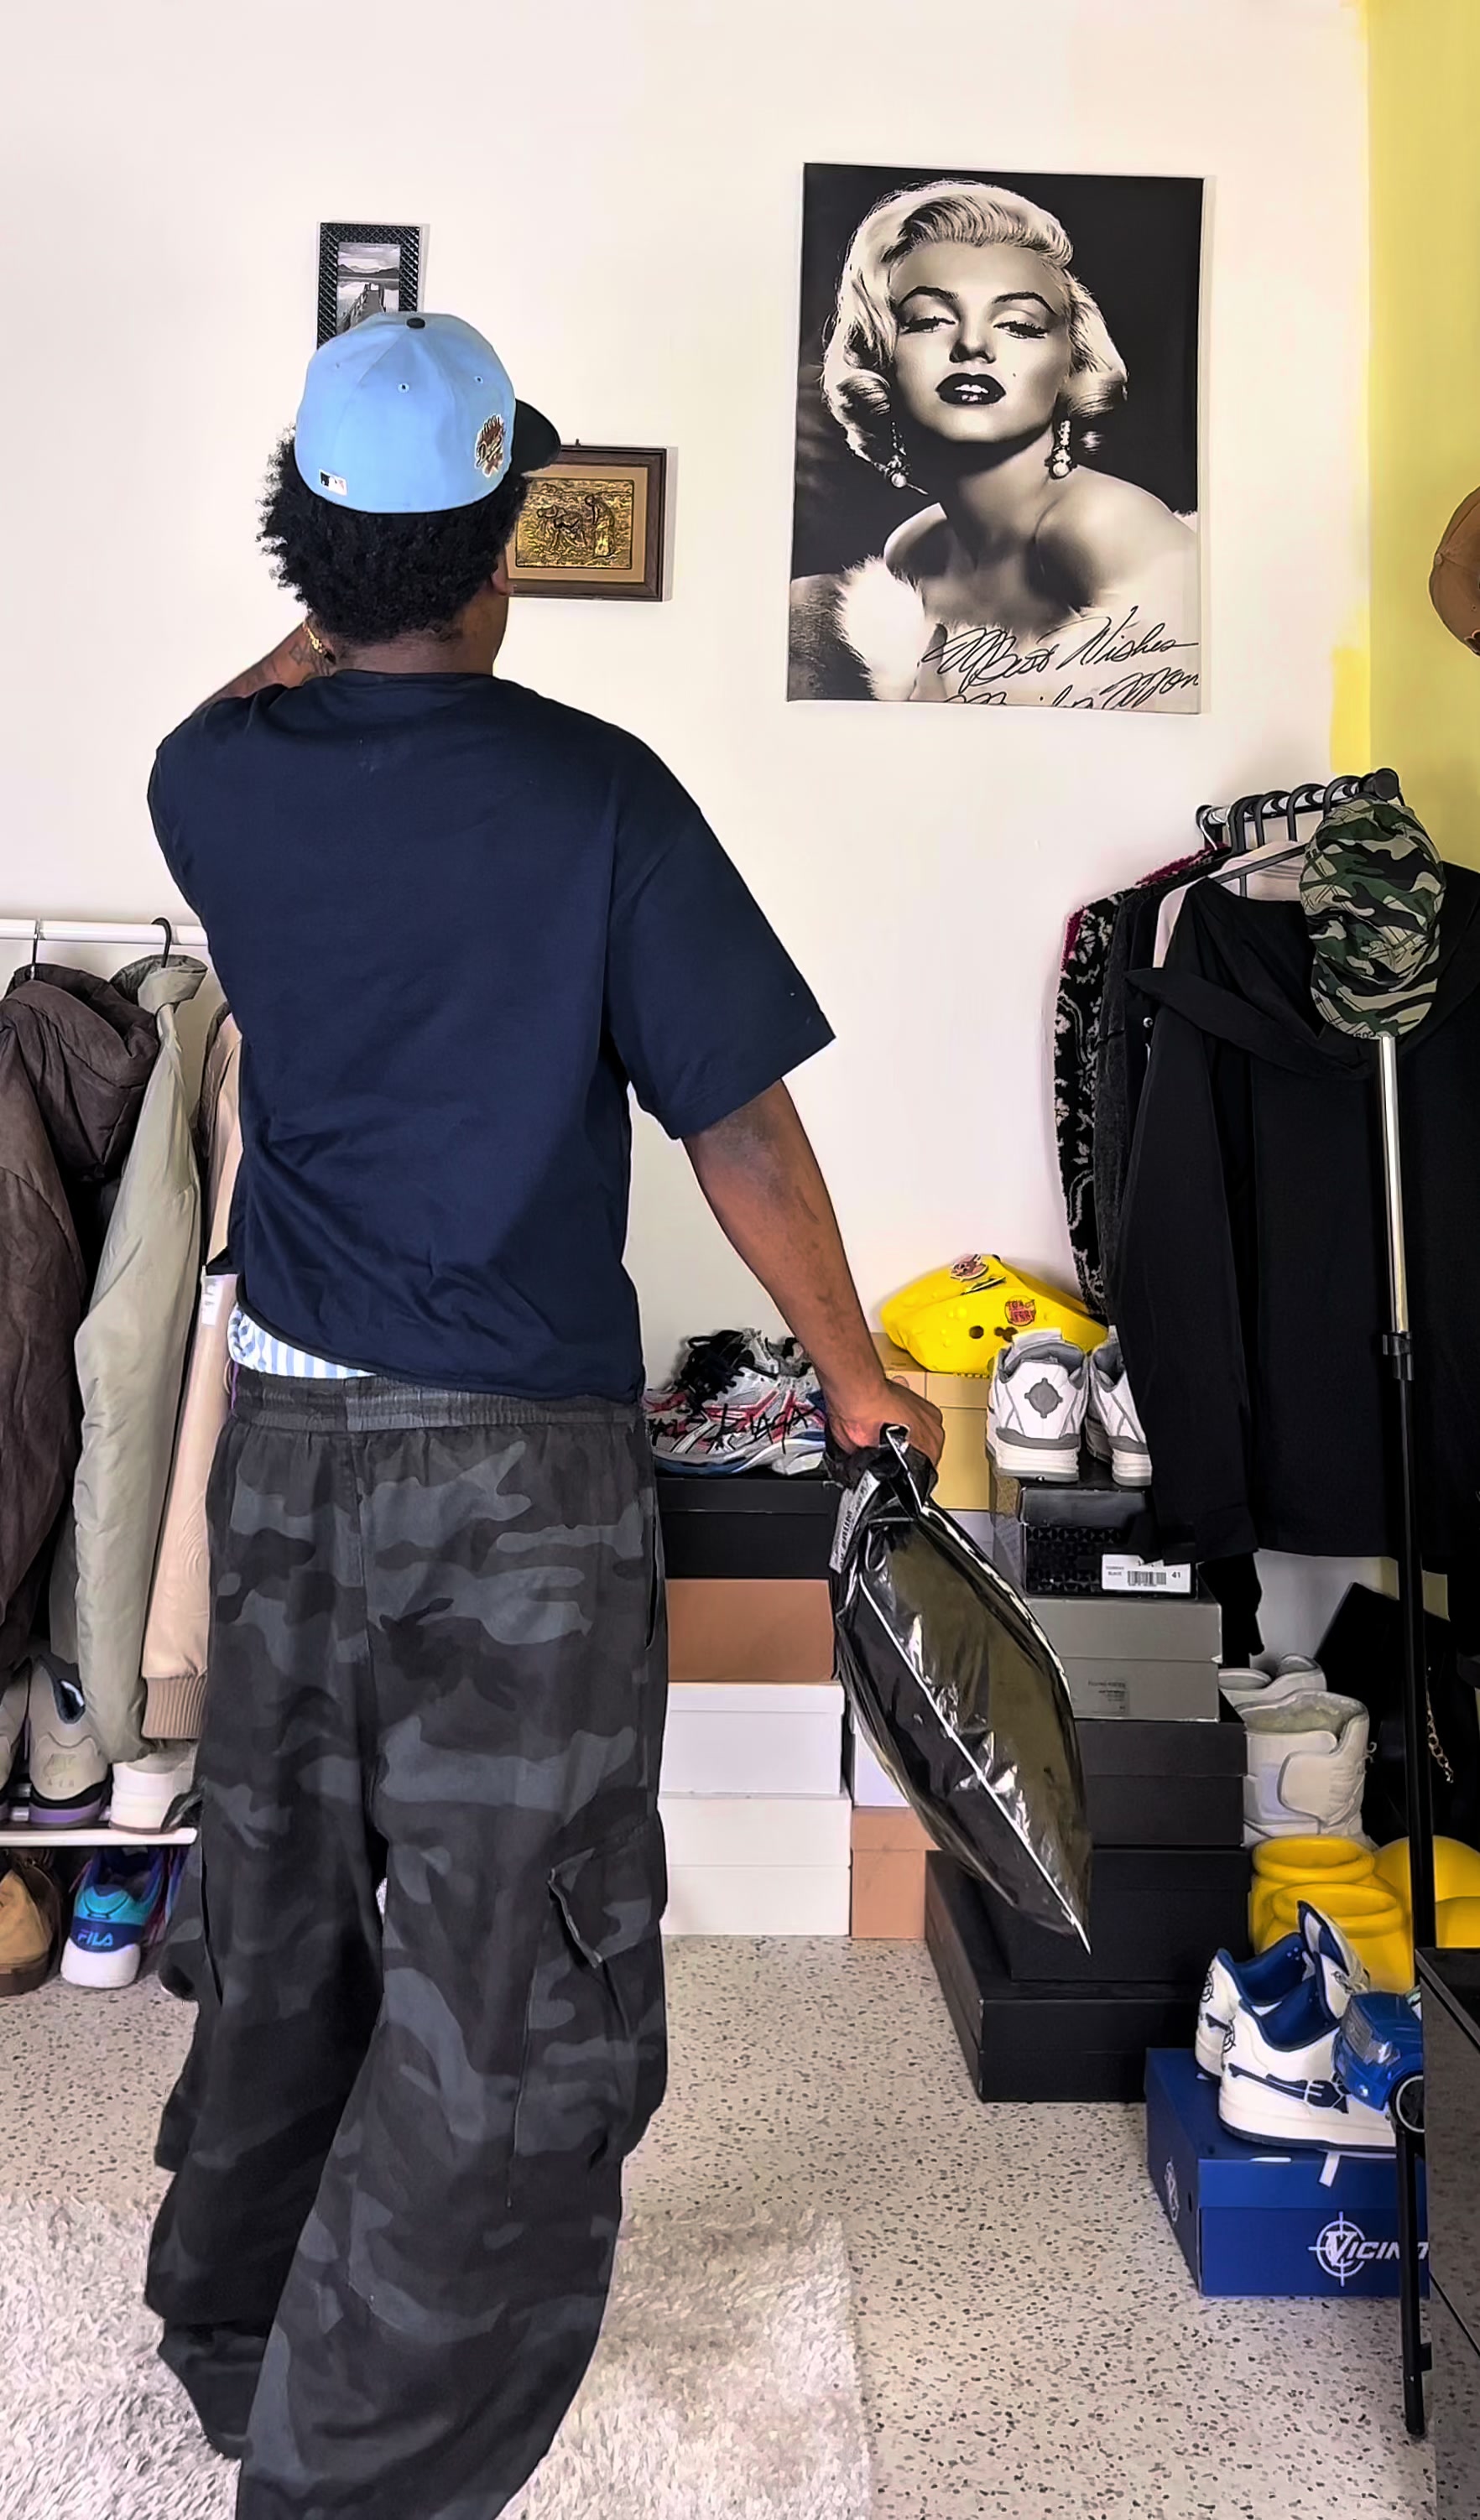
Here is another example of Cold Culture collaborating with an influencer in France.
la_.fleche7 x Cold Culture
Cold Culture's influencer activity vs. related brands
Cold Culture competes for streetwear-minded consumers with brands like In Print We Trust and Kith, where drops, community, and creator styling content are key levers for demand.
Total influencer content
Cold Culture vs. related brands influencer activity
Total sponsored posts tracked (last 12 months)
In Print We Trust leads with 16.1k sponsored posts, significantly outpacing Cold Culture (4.1k posts) and Kith (1.8k posts). Across all three brands, the average volume is 7.3k posts, indicating mature, scaled influencer programs. In Print We Trust has 16118 total posts, which is about four times Cold Culture’s 4051 and far above Kith’s 1774.
By social platform
Cold Culture vs. related brands influencer activity (by social platform)
Sponsored posts by platform
Among these brands, In Print We Trust leads on Instagram and TikTok and Kith leads on YouTube. The gap is most notable on TikTok, with In Print We Trust at 14.5k, Cold Culture at 4k, Kith at 372 posts. Cold Culture's activity is particularly concentrated on TikTok. On TikTok, In Print We Trust leads with 14516 posts, several times more than Cold Culture’s 4047 and far above Kith’s 372.
By geographical market
Cold Culture vs. related brands influencer activity (by country)
Estimated sponsored posts in Cold Culture's top markets
In Print We Trust has the highest estimated sponsored-post volume in United States (6k posts, 37.5%), United Kingdom (3.6k posts, 22.4%), Mexico (1.1k posts, 6.9%), suggesting a North America focus, while Cold Culture has the highest estimated sponsored-post volume in France (1.9k posts, 46.2%), Spain (1.6k posts, 39.2%), Belgium (150 posts, 3.7%), suggesting a Europe focus, while Kith has the highest estimated sponsored-post volume in Japan (215 posts, 12.1%), Brazil (98 posts, 5.5%). Looking at United States specifically, the split is In Print We Trust at 6k posts (37.5%), Kith at 844 posts (47.6%). Cold Culture's strength in France may indicate a home-market focus, while In Print We Trust shows broader regional investment.
Read more influencer strategy breakdowns
Looking for more like this? Here are 5 similar influencer marketing strategy breakdowns for other brands:
- In Print We Trust's Influencer Marketing Strategy
- Kith's Influencer Marketing Strategy
- KATCH ME's Influencer Marketing Strategy
- Color Wow Hair's Influencer Marketing Strategy
- Dolls Kill's Influencer Marketing Strategy
Or, if you want to access data like this for your own software or processes, take a look at Modash's API products:
Frequently asked questions
Scaling your influencer program?
When you outgrow your mishmash of spreadsheets & free tools, try Modash. Find & email influencers, track campaigns, ship products & more - all in one place.