COVERGIRL Influencer Marketing Strategy
(2026 Data & Insights)
We analyzed 15.2k pieces of influencer content sponsored by COVERGIRL over the last 12 months.
This report breaks down where & how COVERGIRL invests in influencer marketing, which social platforms they prioritize, top geographical markets, and more.
The data in this report comes from Modash's Brand Collaborations API.
P.S. for a simple list of influencers who have collaborated with COVERGIRL, see here: COVERGIRL influencers.
Influencer activity throughout the year
COVERGIRL's influencer campaigns are active year-round with notable month-to-month fluctuation. The chart below shows month-by-month data for total sponsored posts tracked.
COVERGIRL's influencer activity by month
Number of sponsored posts
COVERGIRL's influencer output appears relatively consistent throughout the year, averaging about 1.3k sponsored posts per month. January recorded the highest volume at 2k posts (60% above average), while April was the quietest at 904 posts.
Social platforms breakdown
In our dataset (which only includes Instagram, YouTube, and TikTok), this is how the volume of COVERGIRL's sponsored influencer collaborations break down by social platform:
- TikTok: 12.0k posts (79%)
- Instagram: 3.0k posts (19.5%)
- YouTube: 225 posts (1.5%)
COVERGIRL's influencer activity by platform
Share of sponsored content by social network
TikTok influencer marketing is a clear focus for COVERGIRL.
Here are 3 examples of COVERGIRL's recent sponsored collaborations (one each for Instagram, TikTok, YouTube).
alexisxbraun x COVERGIRL
![Instagram post by @alexisxbraun for COVERGIRL. Caption reads: Covergirllllll this skin!!!! TOO GOOD 😍 #ad [...].](https://images.od.modash.io/a8786af6b4f03fc5b5ade72bea586f1cff75b2c4)
Influencer bio
LA @newmarkmodels collab: jules@newmarkmodels.com ♡ ♡ ♡
Collaboration metrics
Get a free trial to find more data on influencer audiences, performance, and collaborations.
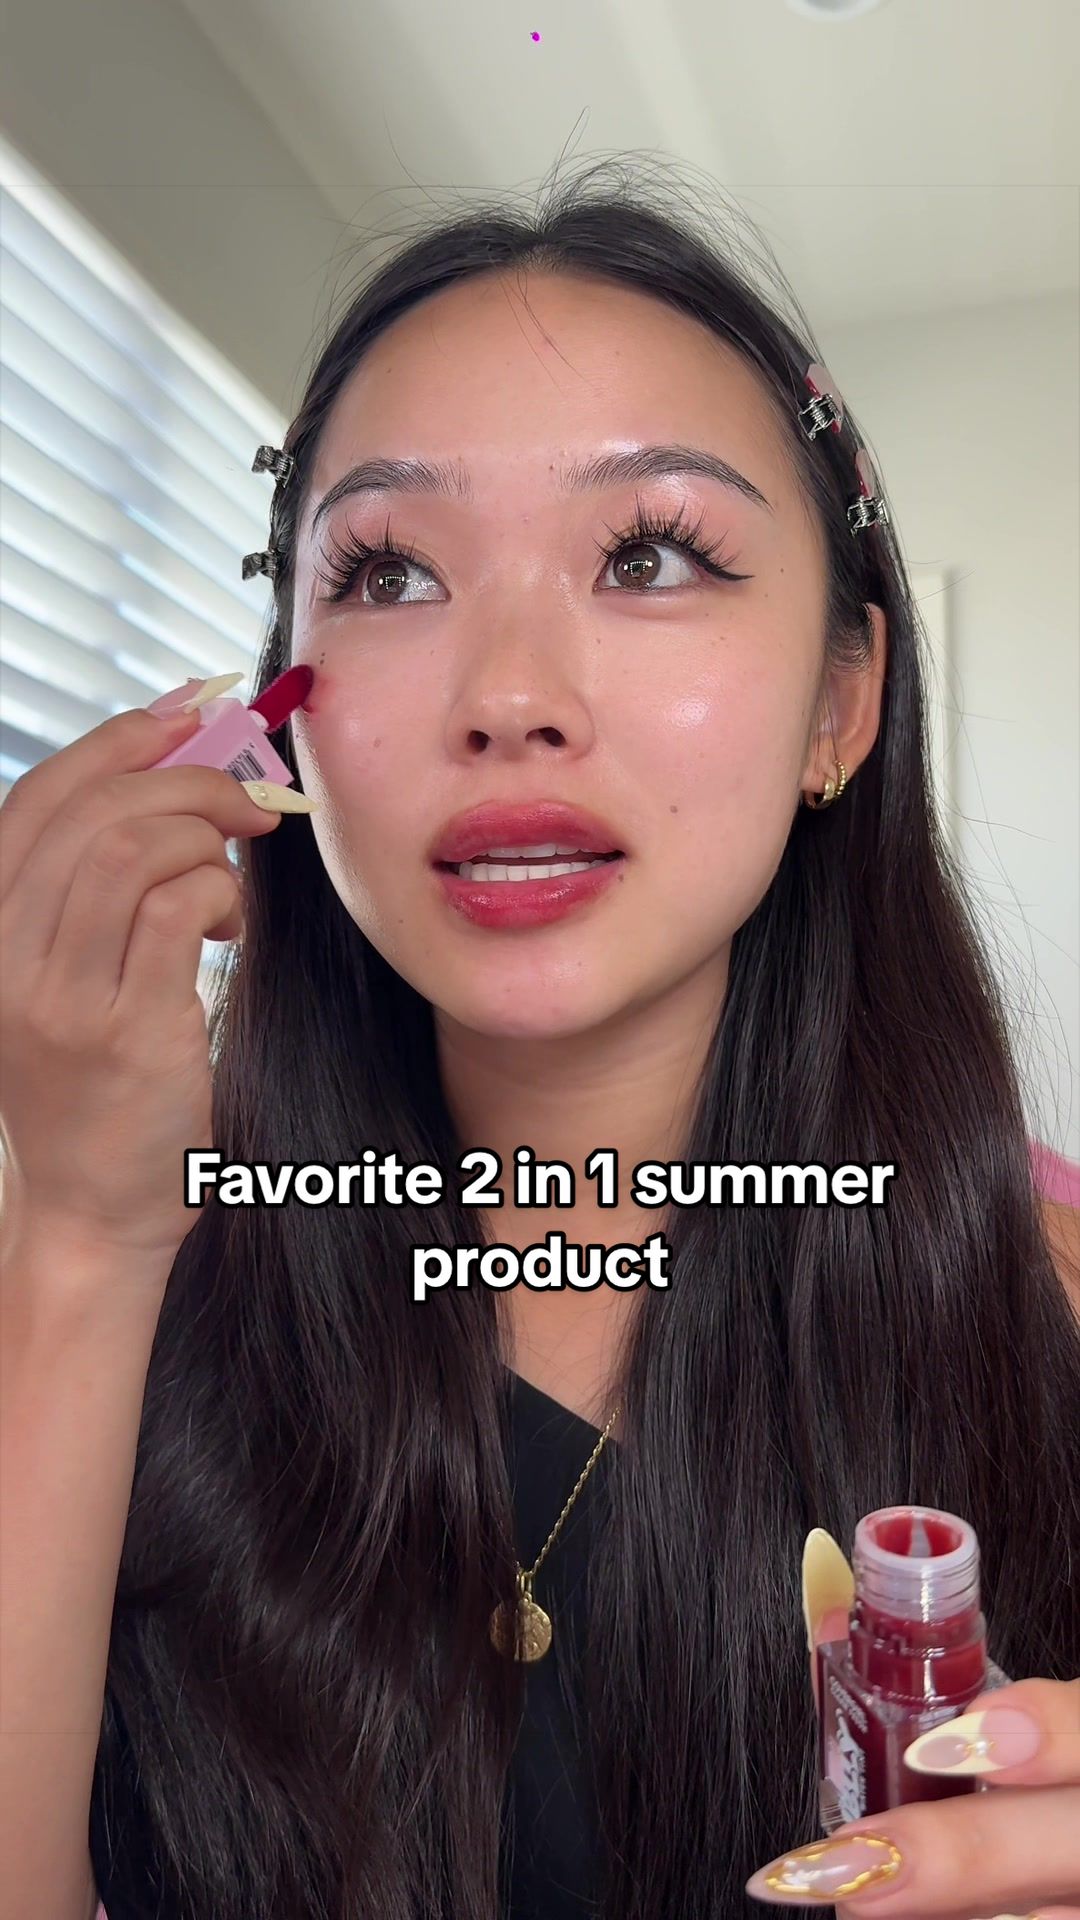
zoekimkenealy x COVERGIRL
![TikTok post by @zoekimkenealy for COVERGIRL. Caption reads: [...] transfer resistant wear. I’m using....](https://images.od.modash.io/0575a6c0453f7cb8e03e3dc09381b54bafd2827c)
Influencer bio
zoekimkenealy@gmail.com 🖤 IG: @zoekimkenealy
Collaboration metrics
Get a free trial to find more data on influencer audiences, performance, and collaborations.
WifedUpMicdUp x COVERGIRL
Influencer bio
Come spend the 2025 football season with us Claire Kittle and Kristin Juszczyk 🏈 Follow us on... Instagram: @wifedupmicdup TikTok: @wifedupmicdup
Collaboration metrics
Get a free trial to find more data on influencer audiences, performance, and collaborations.
If you break this down further by content type on TikTok, this is what it looks like:
- Videos: 94.8%
- Carousels: 5.2%
💡 Related resource: How To Find TikTok Influencers.
Influencer audience size breakdown (by views)
For their top social platform (TikTok), here is a breakdown of the type of influencers COVERGIRL are collaborating with, by audience size.
Note: this breakdown is based on each influencer's average views (not follower/subscriber count), because views typically correlate more closely with influencer pricing and impact.
COVERGIRL's influencers average views (TikTok)
Based on each influencer's average views per post
With 49.3% of partnerships featuring creators averaging <1K views, COVERGIRL's strategy suggests niche targeting and authenticity, likely leveraging collaboration models like gifting and affiliates to work with smaller creators.
Here is an example of a sponsored collaboration with a larger-audience creator on TikTok (10.7M avg views/post):
lydia.chae x COVERGIRL
Influencer bio
makeup, skincare, and random shet 💌 lydia@starlinemgmt.com
Collaboration metrics
Get a free trial to find more data on influencer audiences, performance, and collaborations.
And here is another example with a smaller creator on TikTok (10.0k avg views/post):
hydrationceo x COVERGIRL
Influencer bio
rachel@hydrationceo.com 💅 your unfiltered skincare & beauty bestie Products👇
Collaboration metrics
Get a free trial to find more data on influencer audiences, performance, and collaborations.
COVERGIRL's repeat partnerships
Out of 8.5k unique influencers in our dataset, 549 of them (6%) posted content for COVERGIRL in 3 or more separate calendar months. The most consistent partner is @chicwithkels, who has collaborated across 11 months with 30 total posts.
Here are 3 examples of COVERGIRL's repeat influencer partnerships, with links to the sponsored content.
chicwithkels x COVERGIRL
![TikTok post by @chicwithkels for COVERGIRL. Caption reads: [...] mattes eyeshadow palette, @COVERGIRL kohl....](https://images.od.modash.io/cd2910ed1c53bd492c3545f6ca6d66e28a33176c)
![TikTok post by @chicwithkels for COVERGIRL. Caption reads: [...] jelly blush in rose crush • @COVERGIRL skin....](https://images.od.modash.io/8d4fe3f815e216bb026af75c31fbef8250be07e9)
![TikTok post by @chicwithkels for COVERGIRL. Caption reads: [...] Beauty eye brightener, @COVERGIRL eye color....](https://images.od.modash.io/7abf81c08254795304dd8e0c1bf4754481f9c960)
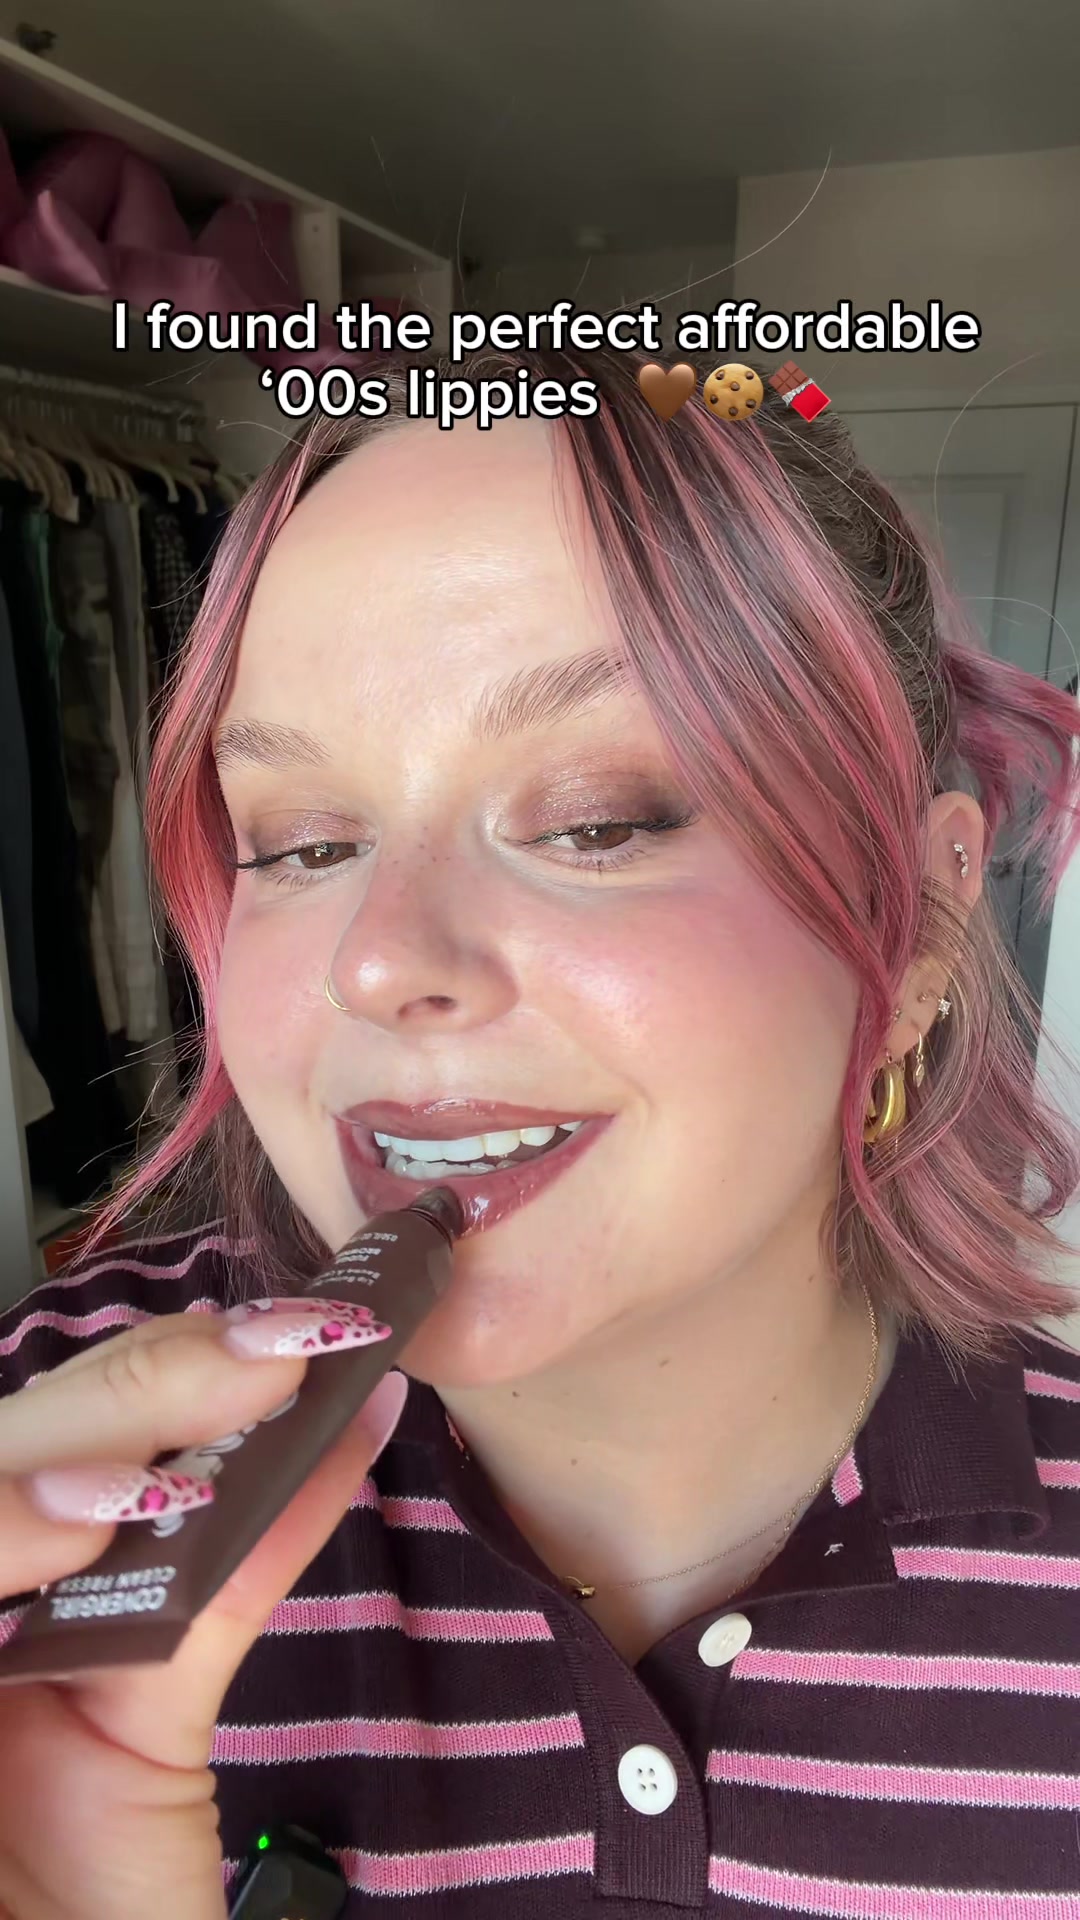
alyssamhoward x COVERGIRL
![TikTok post by @alyssamhoward for COVERGIRL. Caption reads: @COVERGIRL outlast lip stain in the [...].](https://images.od.modash.io/8da11ecf999ca28f0bf04c616af260fcf0741703)
![TikTok post by @alyssamhoward for COVERGIRL. Caption reads: [...] combo until everyone has it! @COVERGIRL....](https://images.od.modash.io/7fac071eaa4233638271129e508057e13b163c2a)
![TikTok post by @alyssamhoward for COVERGIRL. Caption reads: @COVERGIRL outlast lipstain in the shade [...].](https://images.od.modash.io/2fdbb9c6f81f68fb961899f00414177055c39cf5)
parisspencerrr x COVERGIRL
![TikTok post by @parisspencerrr for COVERGIRL. Caption reads: [...] + winter break 🧸🩰🎀🎄 @COVERGIRL @TORY....](https://images.od.modash.io/19fa7d50fc75d5347a3cfc03961108517c11c827)
![TikTok post by @parisspencerrr for COVERGIRL. Caption reads: [...] @Shark Beauty @Fenty Beauty @COVERGIRL....](https://images.od.modash.io/d946ac4f3b558979cba08374094de16b29fe61bc)
💡 Related resource: Long-Term Influencer Partnerships: Pros, Cons & How The Pros Manage Them.
Geographical breakdown
In our dataset, United States is where COVERGIRL had the most influencer activity. 68.3% of their live influencer content in the last 12 months was posted by American influencers.
Based on the percentage of influencer content per market, other important markets include:
- Canada (3.6%)
- India (3.1%)
- United Kingdom (3%)
COVERGIRL's influencer activity by market
Here is another example of COVERGIRL collaborating with an influencer in United States.
adityamadiraju x COVERGIRL
COVERGIRL's influencer activity vs. related brands
COVERGIRL, Revlon, and Milani Cosmetics compete in mass-market makeup with wide retail distribution and strong shade/finish comparisons across creators. Their influencer strategies often emphasize affordable dupes, wear tests, and everyday looks aimed at the same consumer.
Total influencer content
COVERGIRL vs. related brands influencer activity
Total sponsored posts tracked (last 12 months)
COVERGIRL leads with 15.2k sponsored posts, significantly outpacing Revlon (11.1k posts) and Milani Cosmetics (6.4k posts). Across all three brands, the average volume is 10.9k posts, indicating mature, scaled influencer programs.
By social platform
COVERGIRL vs. related brands influencer activity (by social platform)
Sponsored posts by platform
COVERGIRL leads on TikTok and YouTube, while Revlon leads on Instagram. The gap is most notable on TikTok, with COVERGIRL at 12k, Revlon at 5.6k, Milani Cosmetics at 4.8k posts. COVERGIRL's activity is particularly concentrated on TikTok. On TikTok, COVERGIRL has 11,992 posts, which is more than double Revlon and Milani Cosmetics.
By geographical market
COVERGIRL vs. related brands influencer activity (by country)
Estimated sponsored posts in COVERGIRL's top markets
COVERGIRL has the highest estimated sponsored-post volume in United States (10k posts, 68.3%), Canada (546 posts, 3.6%), suggesting a North America focus, while Revlon has the highest estimated sponsored-post volume in Japan (1.6k posts, 14%), India (1.1k posts, 9.6%), suggesting a Asia focus, while Milani Cosmetics leads in United Kingdom with 332 posts (5.2%). Looking at United States specifically, the split is COVERGIRL at 10k posts (68.3%), Milani Cosmetics at 4.1k posts (64%), Revlon at 2.5k posts (22.6%). COVERGIRL's strength in United States may indicate a home-market focus, while Revlon shows broader regional investment.
Read more influencer strategy breakdowns
Looking for more like this? Here are 5 similar influencer marketing strategy breakdowns for other brands:
- Revlon's Influencer Marketing Strategy
- Milani Cosmetics's Influencer Marketing Strategy
- PLAUD's Influencer Marketing Strategy
- Epomaker's Influencer Marketing Strategy
- Cocokind's Influencer Marketing Strategy
Or, if you want to access data like this for your own software or processes, take a look at Modash's API products:
Frequently asked questions
Scaling your influencer program?
When you outgrow your mishmash of spreadsheets & free tools, try Modash. Find & email influencers, track campaigns, ship products & more - all in one place.