Milani Cosmetics Influencer Marketing Strategy
(2026 Data & Insights)
We analyzed 6.4k pieces of influencer content sponsored by Milani Cosmetics over the last 12 months.
This report breaks down where & how Milani Cosmetics invests in influencer marketing, which social platforms they prioritize, top geographical markets, and more.
The data in this report comes from Modash's Brand Collaborations API.
P.S. for a simple list of influencers who have collaborated with Milani Cosmetics, see here: Milani Cosmetics influencers.
Influencer activity throughout the year
Milani Cosmetics's influencer campaigns are active year-round with notable month-to-month fluctuation. The chart below shows month-by-month data for total sponsored posts tracked.
Milani Cosmetics's influencer activity by month
Number of sponsored posts
Milani Cosmetics's influencer output appears relatively consistent throughout the year, averaging about 532 sponsored posts per month. January recorded the highest volume at 738 posts (39% above average), while June was the quietest at 259 posts.
Social platforms breakdown
In our dataset (which only includes Instagram, YouTube, and TikTok), this is how the volume of Milani Cosmetics's sponsored influencer collaborations break down by social platform:
- TikTok: 4.8k posts (74.7%)
- Instagram: 1.5k posts (24%)
- YouTube: 86 posts (1.3%)
Milani Cosmetics's influencer activity by platform
Share of sponsored content by social network
TikTok influencer marketing is a clear focus for Milani Cosmetics.
Here are 3 examples of Milani Cosmetics's recent sponsored collaborations (one each for Instagram, TikTok, YouTube).
alexandraafrench x Milani Cosmetics
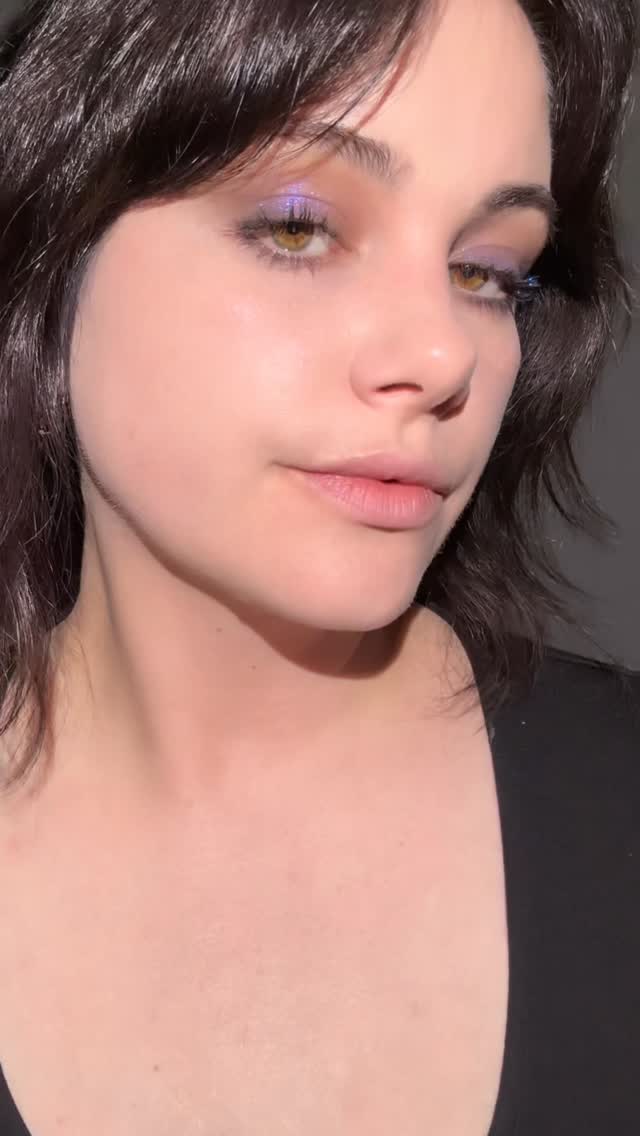
Influencer bio
LA & NYC 🖤🪽🎀 katie@forwardartists.com
Collaboration metrics
Get a free trial to find more data on influencer audiences, performance, and collaborations.
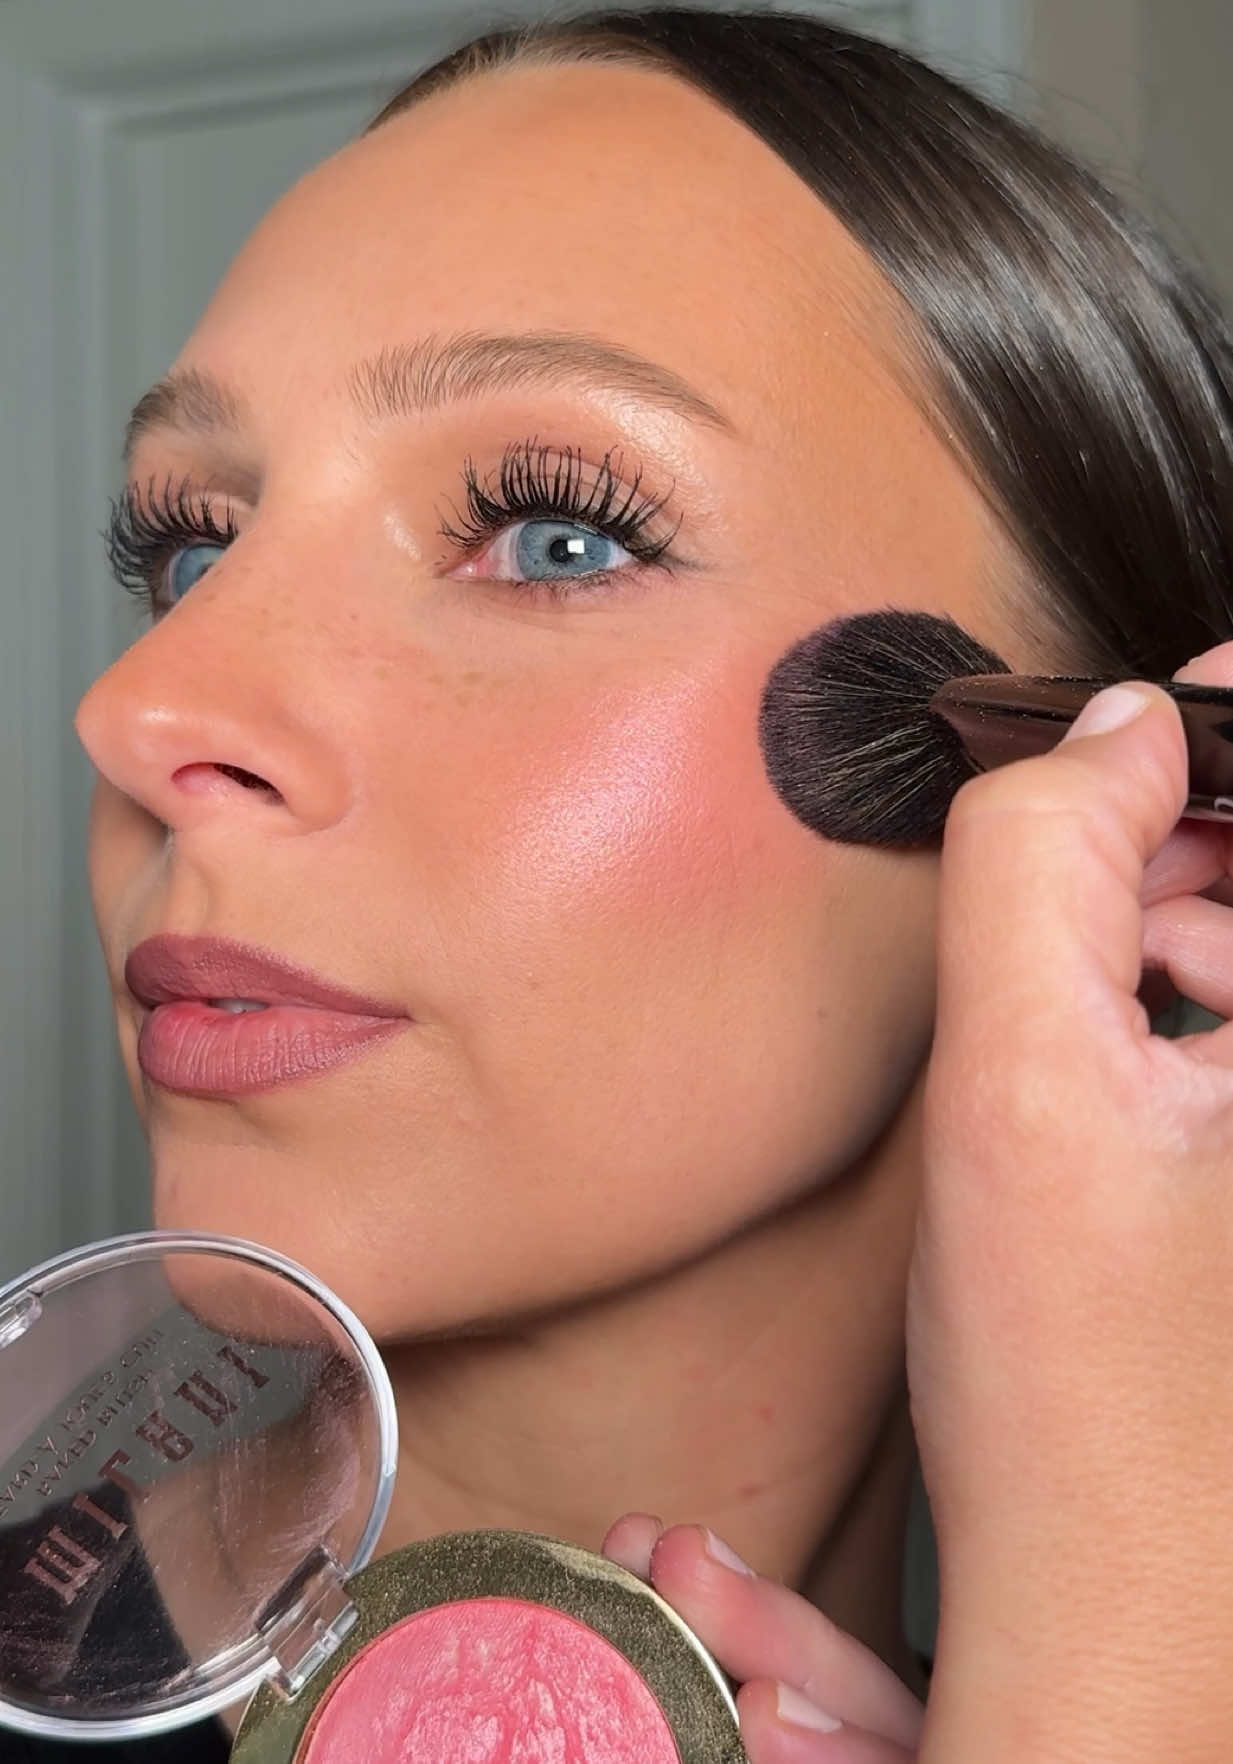
bgirlie24 x Milani Cosmetics
![TikTok post by @bgirlie24 for Milani Cosmetics. Caption reads: [...] #grwmilani #MilaniPartner @Milani Cosmetics.](https://images.od.modash.io/ddb90d3554c65a21550e96ea2298a1fa80eeb773)
Influencer bio
oversharing my late 20s so you don’t have to figure it out alone ❤️ OC / LA natalia@genflow.com same username IG | weekly YT vlogs
Collaboration metrics
Get a free trial to find more data on influencer audiences, performance, and collaborations.
redgirlreviews x Milani Cosmetics
![YouTube post by @redgirlreviews for Milani Cosmetics. Caption reads: [...] Can’t wait to try more colors!....](https://images.od.modash.io/ced4cb7fe8d166c9d17fbdc992a789bb5beaa931)
Influencer bio
I love all things makeup, skincare & over 40 & 50 beauty (I'm 50). I buy & try beauty products and share my thoughts to help you decide whether they are worth buying or not. I'm not sponsored in any of these reviews so you are getting my honest opinion as a fellow beauty enthusiast. I'm literally just a makeup dork and feel the need to share. ;-) I also search out cool toned and fair skin makeup that's so hard to find and share it! Don't forget to subscribe to get notified every time I post a new video. I usually upload a few shorts throughout the week and one full length video every week. I'm a stay at home mom to 3 and former pin-up artist (www.doughertyarts.com) so I sometimes post cooking and gardening videos and my latest artwork. I truly believe all life is art and want to share it with everyone! You can find more content on Instagram & Facebook at the links below.
Collaboration metrics
Get a free trial to find more data on influencer audiences, performance, and collaborations.
If you break this down further by content type on TikTok, this is what it looks like:
- Videos: 96.6%
- Carousels: 3.4%
💡 Related resource: How To Find TikTok Influencers.
Influencer audience size breakdown (by views)
For their top social platform (TikTok), here is a breakdown of the type of influencers Milani Cosmetics are collaborating with, by audience size.
Note: this breakdown is based on each influencer's average views (not follower/subscriber count), because views typically correlate more closely with influencer pricing and impact.
Milani Cosmetics's influencers average views (TikTok)
Based on each influencer's average views per post
With 42.2% of partnerships featuring creators averaging <1K views, Milani Cosmetics's strategy suggests niche targeting and authenticity, likely leveraging collaboration models like gifting and affiliates to work with smaller creators.
Here is an example of a sponsored collaboration with a larger-audience creator on TikTok (2.4M avg views/post):
emxclark x Milani Cosmetics
Influencer bio
♡ beauty favs & mom life (ivf mama) ✉️ emilyclark@thesociablesociety.com VA/DC/NYC
Collaboration metrics
Get a free trial to find more data on influencer audiences, performance, and collaborations.
And here is another example with a smaller creator on TikTok (10.0k avg views/post):
kinggnaj x Milani Cosmetics
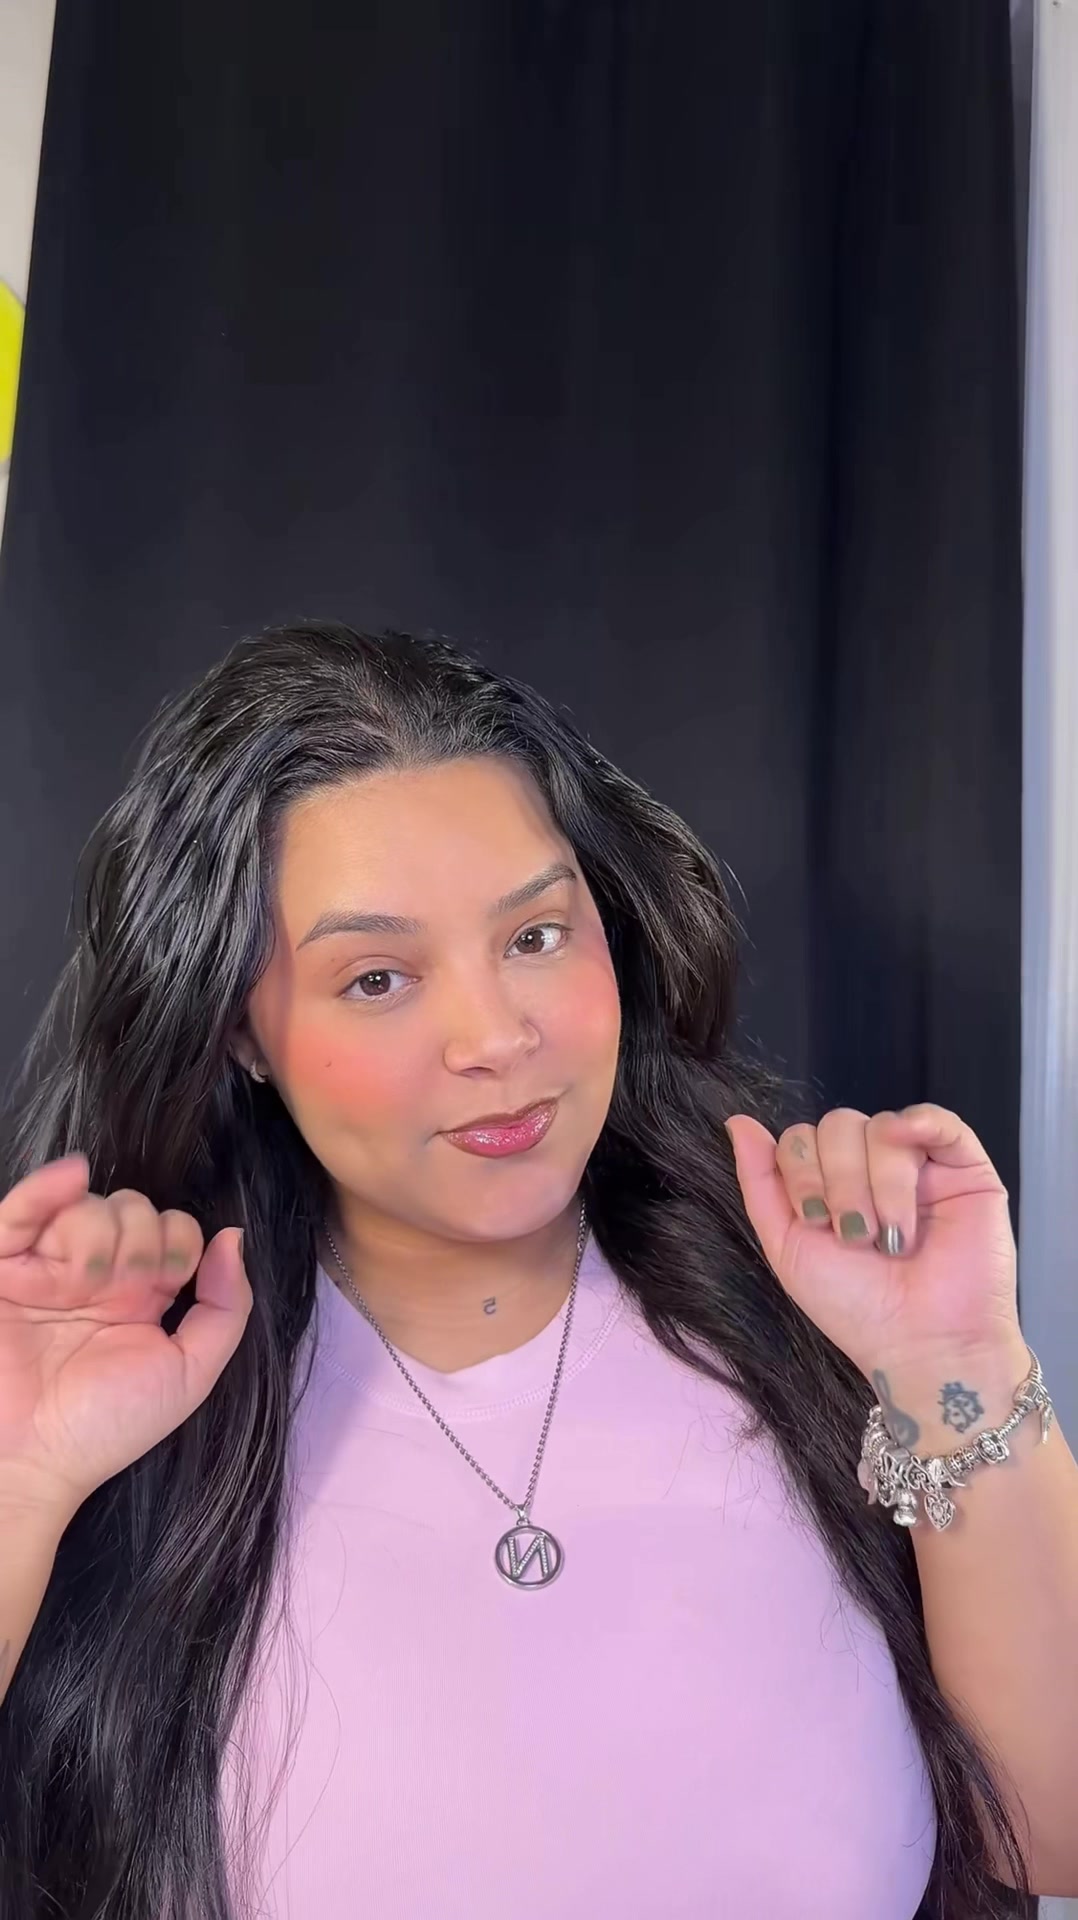
Influencer bio
nyc beauty + fashion + everything in between 📧: najpartnerships@gmail.com
Collaboration metrics
Get a free trial to find more data on influencer audiences, performance, and collaborations.
Milani Cosmetics's repeat partnerships
Out of 3.7k unique influencers in our dataset, 186 of them (5%) posted content for Milani Cosmetics in 3 or more separate calendar months. The most consistent partner is @brittbratstyles, who has collaborated across 12 months with 23 total posts.
Here are 3 examples of Milani Cosmetics's repeat influencer partnerships, with links to the sponsored content.
brittbratstyles x Milani Cosmetics
itsmandymorrell x Milani Cosmetics
![TikTok post by @itsmandymorrell for Milani Cosmetics. Caption reads: [...] @Lancôme mascara primer @Milani Cosmetics....](https://images.od.modash.io/1d6f95546a603e2a4c02b248a9089407b327b905)
![TikTok post by @itsmandymorrell for Milani Cosmetics. Caption reads: [...] @ONE SIZE BEAUTY @Milani Cosmetics #grwm....](https://images.od.modash.io/782d9764da04f72aceaff45d4944b66e116a93ae)
![TikTok post by @itsmandymorrell for Milani Cosmetics. Caption reads: [...] @tarte cosmetics @Milani Cosmetics #grwm....](https://images.od.modash.io/4d73e71f8950f03021db85efabbde29f0c310d19)
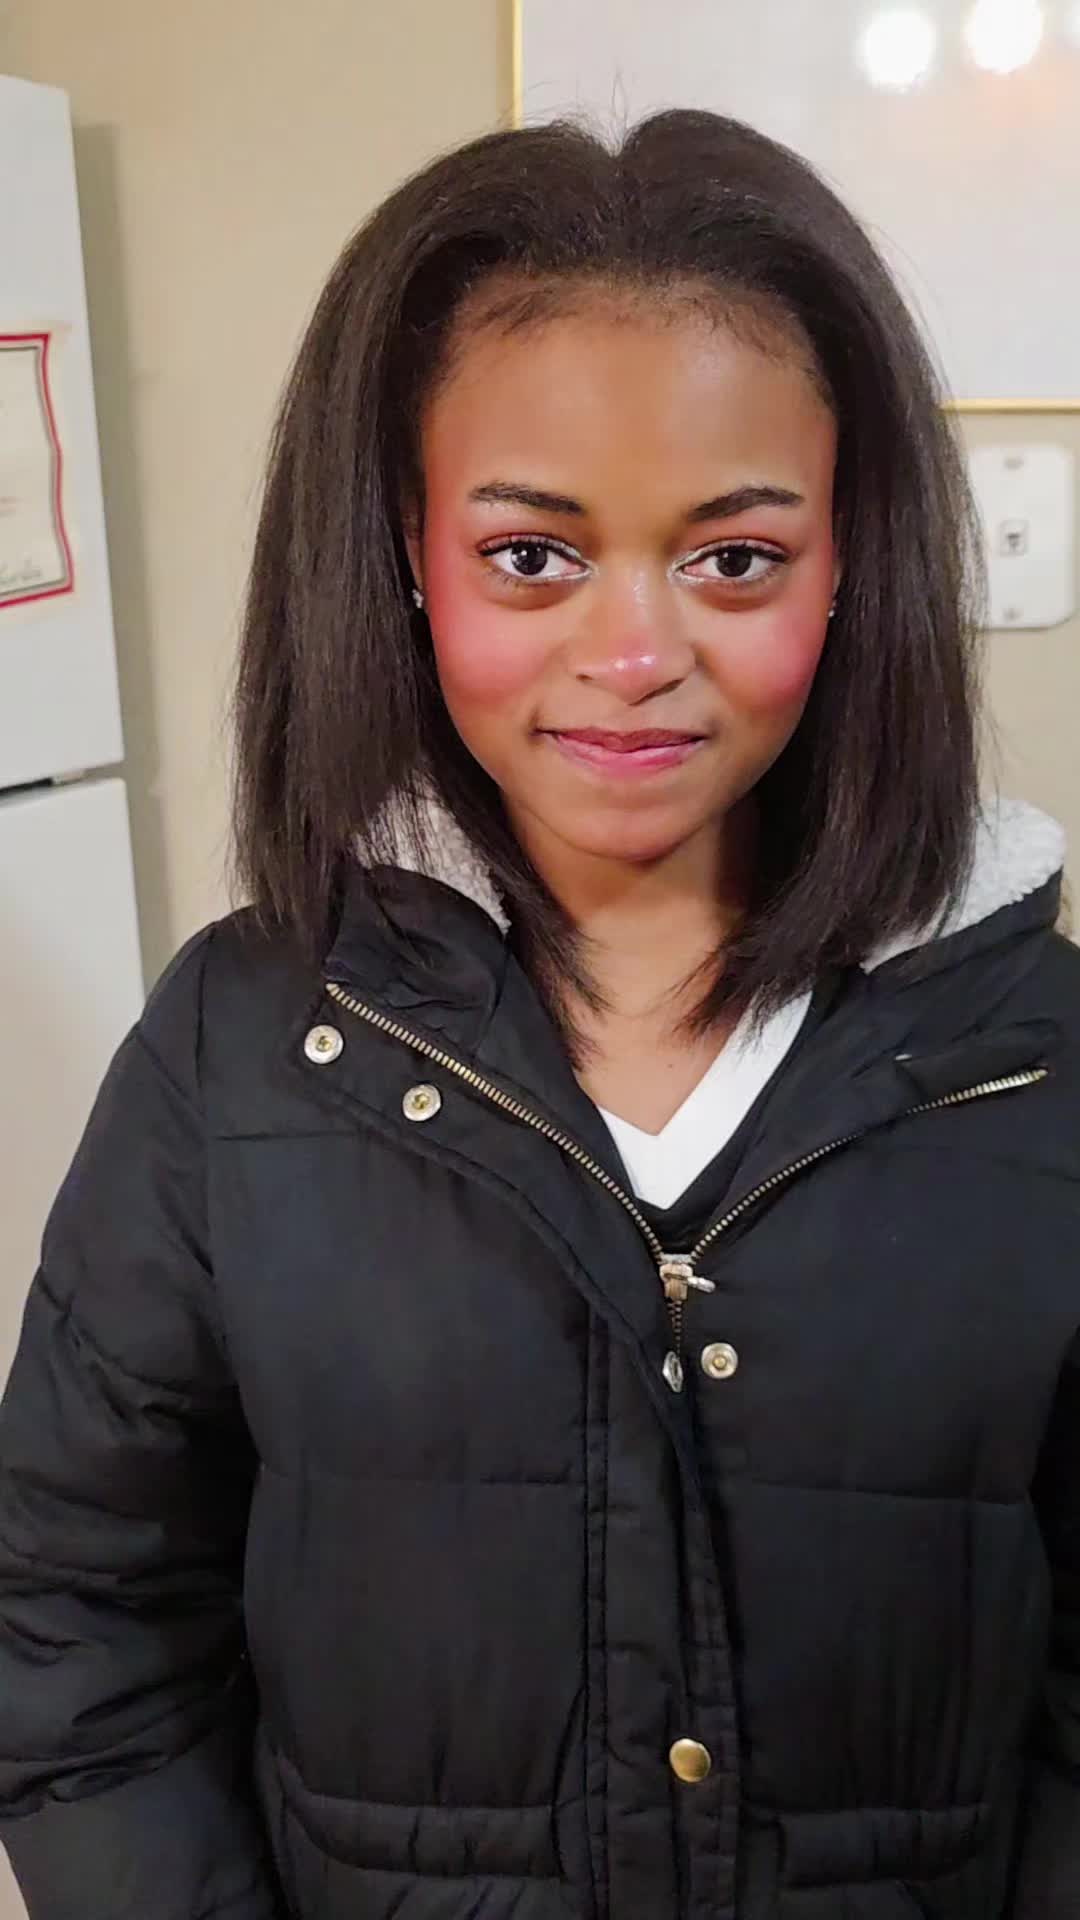
thenotarichgirl x Milani Cosmetics
![TikTok post by @thenotarichgirl for Milani Cosmetics. Caption reads: [...] Blush in Sparkling Rose @Milani Cosmetics....](https://images.od.modash.io/33422a0d9bea364d0f212d7124d6d1bed9dd45f0)
![TikTok post by @thenotarichgirl for Milani Cosmetics. Caption reads: [...] Blush in Ciao Bella @Milani Cosmetics....](https://images.od.modash.io/b1dba9b06fdbe17160dcdff8d104a3d7296268a3)
💡 Related resource: Long-Term Influencer Partnerships: Pros, Cons & How The Pros Manage Them.
Geographical breakdown
In our dataset, United States is where Milani Cosmetics had the most influencer activity. 64% of their live influencer content in the last 12 months was posted by American influencers.
Based on the percentage of influencer content per market, other important markets include:
- India (7.4%)
- United Kingdom (5.2%)
- Brazil (3.3%)
Milani Cosmetics's influencer activity by market
Here is another example of Milani Cosmetics collaborating with an influencer in United States.
theglownarrative x Milani Cosmetics
![TikTok post by @theglownarrative for Milani Cosmetics. Caption reads: [...] EVER tried. Hands down the best @Milani....](https://images.od.modash.io/24ab4ab7b18fbbaf75b0df6e46e926738eb1bdf4)
Milani Cosmetics's influencer activity vs. related brands
Revlon and COVERGIRL are direct mass-market color cosmetics competitors to Milani, overlapping in drugstore distribution, price point, and product categories like foundations, lip, and eye makeup. Their influencer strategies and trend-driven launches also map closely to Milani’s competitive set.
Total influencer content
Milani Cosmetics vs. related brands influencer activity
Total sponsored posts tracked (last 12 months)
COVERGIRL leads with 14.8k sponsored posts, significantly outpacing Revlon (10.9k posts) and Milani Cosmetics (6.4k posts). Across all three brands, the average volume is 10.7k posts, indicating mature, scaled influencer programs. Milani Cosmetics has fewer total posts (6,387) than Revlon (10,925) and COVERGIRL (14,774).
By social platform
Milani Cosmetics vs. related brands influencer activity (by social platform)
Sponsored posts by platform
Among these brands, Revlon leads on Instagram and COVERGIRL leads on TikTok and YouTube. The gap is most notable on TikTok, with COVERGIRL at 11.7k, Revlon at 5.6k, Milani Cosmetics at 4.8k posts. Milani Cosmetics's activity is particularly concentrated on TikTok. On TikTok, COVERGIRL has far more posts (11,667) than Milani Cosmetics (4,770) and Revlon (5,576).
By geographical market
Milani Cosmetics vs. related brands influencer activity (by country)
Estimated sponsored posts in Milani Cosmetics's top markets
COVERGIRL has the highest estimated sponsored-post volume in United States (9.9k posts, 66.7%), Canada (798 posts, 5.4%), United Kingdom (650 posts, 4.4%), suggesting a North America focus, while Revlon has the highest estimated sponsored-post volume in Japan (1.7k posts, 15.5%), India (1.2k posts, 10.6%), suggesting a Asia focus. Looking at United States specifically, the split is COVERGIRL at 9.9k posts (66.7%), Milani Cosmetics at 4.1k posts (64%), Revlon at 2.6k posts (24.2%).
Read more influencer strategy breakdowns
Looking for more like this? Here are 5 similar influencer marketing strategy breakdowns for other brands:
- Revlon's Influencer Marketing Strategy
- COVERGIRL's Influencer Marketing Strategy
- Sacheu's Influencer Marketing Strategy
- Monday Swimwear's Influencer Marketing Strategy
- Bratz's Influencer Marketing Strategy
Or, if you want to access data like this for your own software or processes, take a look at Modash's API products:
Frequently asked questions
Scaling your influencer program?
When you outgrow your mishmash of spreadsheets & free tools, try Modash. Find & email influencers, track campaigns, ship products & more - all in one place.