e.l.f. Cosmetics Influencer Marketing Strategy
(2026 Data & Insights)
We analyzed 41.1k pieces of influencer content sponsored by e.l.f. Cosmetics over the last 12 months.
This report breaks down where & how e.l.f. Cosmetics invests in influencer marketing, which social platforms they prioritize, top geographical markets, and more.
The data in this report comes from Modash's Brand Collaborations API.
P.S. for a simple list of influencers who have collaborated with e.l.f. Cosmetics, see here: e.l.f. Cosmetics influencers.
Influencer activity throughout the year
e.l.f. Cosmetics's influencer campaigns are active year-round with notable month-to-month fluctuation. The chart below shows month-by-month data for total sponsored posts tracked.
e.l.f. Cosmetics's influencer activity by month
Number of sponsored posts
e.l.f. Cosmetics's influencer activity appears to have tapered over the year, from 3.3k posts in January down to 4.5k in December. March was the busiest month at 5.4k posts, 58% above the monthly average.
Social platforms breakdown
In our dataset (which only includes Instagram, YouTube, and TikTok), this is how the volume of e.l.f. Cosmetics's sponsored influencer collaborations break down by social platform:
- TikTok: 32.3k posts (78.5%)
- Instagram: 8.8k posts (21.5%)
e.l.f. Cosmetics's influencer activity by platform
Share of sponsored content by social network
TikTok influencer marketing is a clear focus for e.l.f. Cosmetics.
Here are 2 examples of e.l.f. Cosmetics's recent sponsored collaborations (one each for Instagram, TikTok).
liquiddeath x e.l.f. Cosmetics
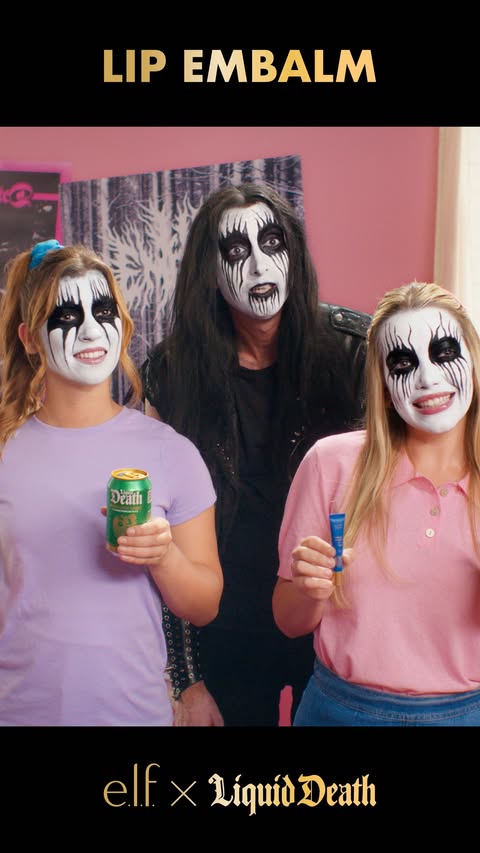
Influencer bio
We make bad things good. 🫀Low Calorie 🤘Low Sugar 🥤Huge Flavor #MurderYourThirst #DeathToPlasticBottles
Collaboration metrics
Get a free trial to find more data on influencer audiences, performance, and collaborations.
garythompson x e.l.f. Cosmetics
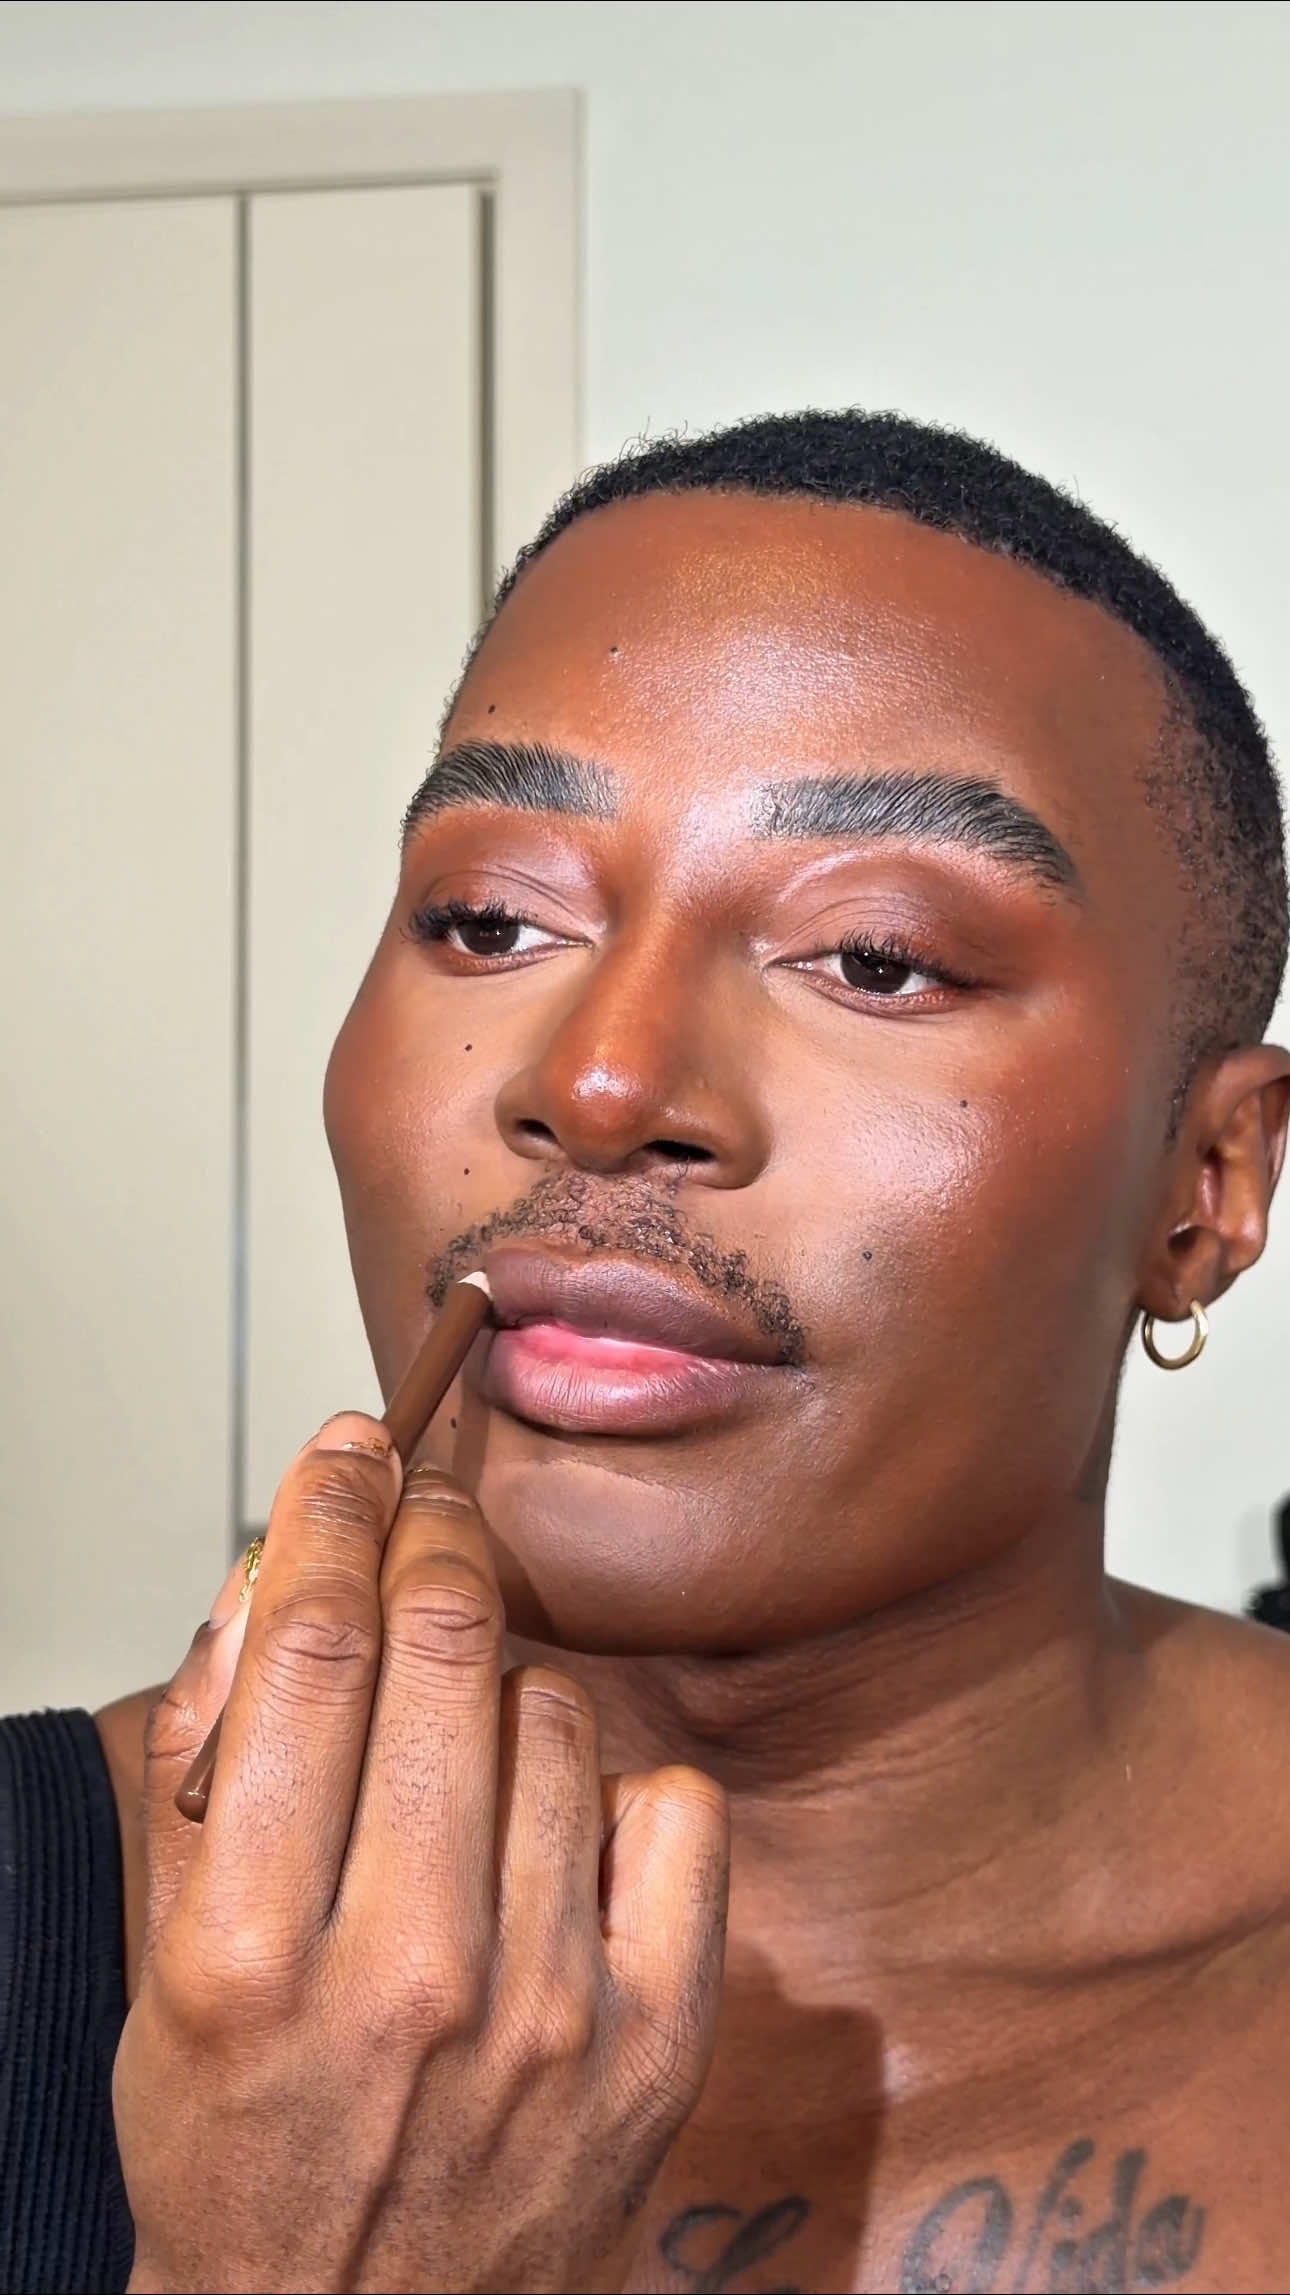
Influencer bio
Gary ✌🏿 London/NYC/LA Beauty Boy with a pinch of fashion & Fitness 📧 contact@mrgarythompson.com
Collaboration metrics
Get a free trial to find more data on influencer audiences, performance, and collaborations.
If you break this down further by content type on TikTok, this is what it looks like:
- Videos: 97.4%
- Carousels: 2.6%
💡 Related resource: How To Find TikTok Influencers.
Influencer audience size breakdown (by views)
For their top social platform (TikTok), here is a breakdown of the type of influencers e.l.f. Cosmetics are collaborating with, by audience size.
Note: this breakdown is based on each influencer's average views (not follower/subscriber count), because views typically correlate more closely with influencer pricing and impact.
e.l.f. Cosmetics's influencers average views (TikTok)
Based on each influencer's average views per post
With 53.9% of partnerships featuring creators averaging <1K views, e.l.f. Cosmetics's strategy suggests niche targeting and authenticity, likely leveraging collaboration models like gifting and affiliates to work with smaller creators.
Here is an example of a sponsored collaboration with a larger-audience creator on TikTok (12.9M avg views/post):
raghademakeup x e.l.f. Cosmetics
![TikTok post by @raghademakeup for e.l.f. Cosmetics. Caption reads: [...] وتعطي لمعة كأنها موية على الشفايف✨ @e.l.f.....](https://images.od.modash.io/5da36a595d3a9e80bcce8f73d63b77c98cac2330)
Influencer bio
📍 YNB | CAI 💌 redemakeup7@gmail.com ILY <3
Collaboration metrics
Get a free trial to find more data on influencer audiences, performance, and collaborations.
And here is another example with a smaller creator on TikTok (9.9k avg views/post):
by.emmaleah x e.l.f. Cosmetics
![TikTok post by @by.emmaleah for e.l.f. Cosmetics. Caption reads: [...] @medicube global age r booster* @e.l.f.....](https://images.od.modash.io/2162d28d27e862740adf0e7e8b27009fe35676ed)
Influencer bio
for the girls 🧚🏼 skincare, beauty, hair etc. 🌸🎀 london, emilia@lvesocial.com
Collaboration metrics
Get a free trial to find more data on influencer audiences, performance, and collaborations.
e.l.f. Cosmetics's repeat partnerships
Out of 20k unique influencers in our dataset, 1.4k of them (7%) posted content for e.l.f. Cosmetics in 3 or more separate calendar months. The most consistent partner is @glambervcruz, who has collaborated across 12 months with 68 total posts.
Here are 3 examples of e.l.f. Cosmetics's repeat influencer partnerships, with links to the sponsored content.
glambervcruz x e.l.f. Cosmetics

![TikTok post by @glambervcruz for e.l.f. Cosmetics. Caption reads: @e.l.f. Cosmetics HAIR?! Power grip stick & [...].](https://images.od.modash.io/3701bd917884fb4e600fe42ad26b91f01d65e5a4)
![TikTok post by @glambervcruz for e.l.f. Cosmetics. Caption reads: [...] in my entire life 🤯 @e.l.f. Cosmetics #elf....](https://images.od.modash.io/ae26f8f34df65b8c50817461081ab0a6fefc69e4)
daniellamagee x e.l.f. Cosmetics
![TikTok post by @daniellamagee for e.l.f. Cosmetics. Caption reads: [...] IS BACK!!! Runnnn🤎☕️ @e.l.f. Cosmetics....](https://images.od.modash.io/83e1510c91b189e2f4784385676708df713d876b)
jasminemayxx x e.l.f. Cosmetics
![TikTok post by @jasminemayxx for e.l.f. Cosmetics. Caption reads: [...] linked in the video. @e.l.f. Cosmetics UK....](https://images.od.modash.io/5cce9d81f1fb2958fccc18e7bb4ef280eb4ecafc)
![TikTok post by @jasminemayxx for e.l.f. Cosmetics. Caption reads: [...] E and Ferulic Acid ✨ @e.l.f. Cosmetics UK....](https://images.od.modash.io/3b7bf920fe181f6bf3971d0ae5f174c37e9449c4)

💡 Related resource: Long-Term Influencer Partnerships: Pros, Cons & How The Pros Manage Them.
Geographical breakdown
In our dataset, United States is where e.l.f. Cosmetics had the most influencer activity. 50.1% of their live influencer content in the last 12 months was posted by American influencers.
Based on the percentage of influencer content per market, other important markets include:
- United Kingdom (11.2%)
- India (8.5%)
- Canada (3.6%)
e.l.f. Cosmetics's influencer activity by market
Here is another example of e.l.f. Cosmetics collaborating with an influencer in United States.
instylemagazine x e.l.f. Cosmetics
![Instagram post by @instylemagazine for e.l.f. Cosmetics. Caption reads: [...] @kevinphuynh as he gets ready with....](https://images.od.modash.io/f397c99e6519787c1f05c7d686c463014abc4d68)
e.l.f. Cosmetics's influencer activity vs. related brands
COVERGIRL and Kylie Cosmetics are direct mass-to-mid makeup competitors that overlap with e.l.f. Cosmetics in color cosmetics, trend-led product drops, and influencer-driven marketing. Both compete for similar retail shelf space and social-first audiences across TikTok and Instagram.
Total influencer content
e.l.f. Cosmetics vs. related brands influencer activity
Total sponsored posts tracked (last 12 months)
e.l.f. Cosmetics leads with 41.1k sponsored posts, significantly outpacing COVERGIRL (14.8k posts) and Kylie Cosmetics (9.7k posts). Across all three brands, the average volume is 21.8k posts, indicating mature, scaled influencer programs. e.l.f. Cosmetics has far more total posts than both COVERGIRL and Kylie Cosmetics.
By social platform
e.l.f. Cosmetics vs. related brands influencer activity (by social platform)
Sponsored posts by platform
e.l.f. Cosmetics leads on Instagram and TikTok, while COVERGIRL leads on YouTube. The gap is most notable on TikTok, with e.l.f. Cosmetics at 32.3k, COVERGIRL at 11.7k, Kylie Cosmetics at 5.4k posts. e.l.f. Cosmetics's activity is particularly concentrated on TikTok. On TikTok, e.l.f. Cosmetics has several times more posts than COVERGIRL and Kylie Cosmetics.
By geographical market
e.l.f. Cosmetics vs. related brands influencer activity (by country)
Estimated sponsored posts in e.l.f. Cosmetics's top markets
e.l.f. Cosmetics has the highest estimated sponsored-post volume in United States (21k posts, 50.1%), United Kingdom (4.6k posts, 11.2%), India (3.5k posts, 8.5%), while COVERGIRL leads in Canada with 798 posts (5.4%), while Kylie Cosmetics leads in Brazil with 735 posts (7.6%). Looking at United States specifically, the split is e.l.f. Cosmetics at 21k posts (50.1%), COVERGIRL at 9.9k posts (66.7%), Kylie Cosmetics at 2.8k posts (29%). e.l.f. Cosmetics's strength in United States and United Kingdom may indicate a home-market focus, while COVERGIRL shows broader regional investment.
Read more influencer strategy breakdowns
Looking for more like this? Here are 5 similar influencer marketing strategy breakdowns for other brands:
- COVERGIRL's Influencer Marketing Strategy
- Kylie Cosmetics's Influencer Marketing Strategy
- MuscleBlaze's Influencer Marketing Strategy
- RENPHO's Influencer Marketing Strategy
- Revice Denim's Influencer Marketing Strategy
Or, if you want to access data like this for your own software or processes, take a look at Modash's API products:
Frequently asked questions
Scaling your influencer program?
When you outgrow your mishmash of spreadsheets & free tools, try Modash. Find & email influencers, track campaigns, ship products & more - all in one place.