RENPHO Influencer Marketing Strategy
(2026 Data & Insights)
We analyzed 3.1k pieces of influencer content sponsored by RENPHO over the last 12 months.
This report breaks down where & how RENPHO invests in influencer marketing, which social platforms they prioritize, top geographical markets, and more.
The data in this report comes from Modash's Brand Collaborations API.
P.S. for a simple list of influencers who have collaborated with RENPHO, see here: RENPHO influencers.
Influencer activity throughout the year
RENPHO's influencer marketing output shows strong seasonal variation, with some months seeing 3x or more activity than others. The chart below shows month-by-month data for total sponsored posts tracked.
RENPHO's influencer activity by month
Number of sponsored posts
RENPHO's sponsored post volume appears to trend upward over the 12-month period, rising from 362 posts in January to 546 in December. The peak month, December, reached 546 posts, 112% higher than the monthly average of 257.
Social platforms breakdown
In our dataset (which only includes Instagram, YouTube, and TikTok), this is how the volume of RENPHO's sponsored influencer collaborations break down by social platform:
- TikTok: 2.6k posts (85.2%)
- Instagram: 323 posts (10.4%)
- YouTube: 136 posts (4.4%)
RENPHO's influencer activity by platform
Share of sponsored content by social network
TikTok influencer marketing is a clear focus for RENPHO.
Here are 3 examples of RENPHO's recent sponsored collaborations (one each for Instagram, TikTok, YouTube).
kayla.amme x RENPHO
![Instagram post by @kayla.amme for RENPHO. Caption reads: [...] my code KAYLAAMME for a discount💫 The....](https://images.od.modash.io/b77930188a38b094e790e645ae15663a707e9999)
Influencer bio
✨Sharing my favorite Amazon finds & more!✨ My links & Amazon Storefront👇 Affiliate links
Collaboration metrics
Get a free trial to find more data on influencer audiences, performance, and collaborations.
jusfitz x RENPHO
![TikTok post by @jusfitz for RENPHO. Caption reads: [...] #foru? #foryourrpage #relatablee @RENPHO.](https://images.od.modash.io/7fbb915ee60b14f2687342cb5634ce38356512b6)
Influencer bio
Glory to God collabs:fitzwonline@gmail.com 📸: _jusfitz
Collaboration metrics
Get a free trial to find more data on influencer audiences, performance, and collaborations.
hongsmakeup x RENPHO
![YouTube post by @hongsmakeup for RENPHO. Caption reads: [...] 프레스드 파우더 N 165,000 KRW *제품제공 (노출 의무 없음)....](https://images.od.modash.io/40bb7161326829fc17bfdafbd453562e88b79f4a)
Influencer bio
안녕하세요 메이크업 아티스트 홍현정입니다! 쎌럽들의 원조 메이크업아티스트 홍언니가 알려주는 뷰티 노하우와 튜토리얼을 확인해보세요! Welcome to Hong’s MakeuPlay! I’m Hong, Pro makeup Artist from Seoul, S.Korea. Check out my K-celebrities’ make-up tutorials and beauty tips! *비즈니스 문의: Hongsmakeuplay@gmail.com *인스타그램: www.instagram.com/hongsmakeuplay *홈페이지: www.honghyunjeong.com *Business Enquires: Hongsmakeuplayl@gmail.com *Instagram: www.instagram.com/hongsmakeuplay *Website: www.honghyunjeong.com
Collaboration metrics
Get a free trial to find more data on influencer audiences, performance, and collaborations.
If you break this down further by content type on TikTok, this is what it looks like:
- Videos: 97.2%
- Carousels: 2.8%
💡 Related resource: How To Find TikTok Influencers.
Influencer audience size breakdown (by views)
For their top social platform (TikTok), here is a breakdown of the type of influencers RENPHO are collaborating with, by audience size.
Note: this breakdown is based on each influencer's average views (not follower/subscriber count), because views typically correlate more closely with influencer pricing and impact.
RENPHO's influencers average views (TikTok)
Based on each influencer's average views per post
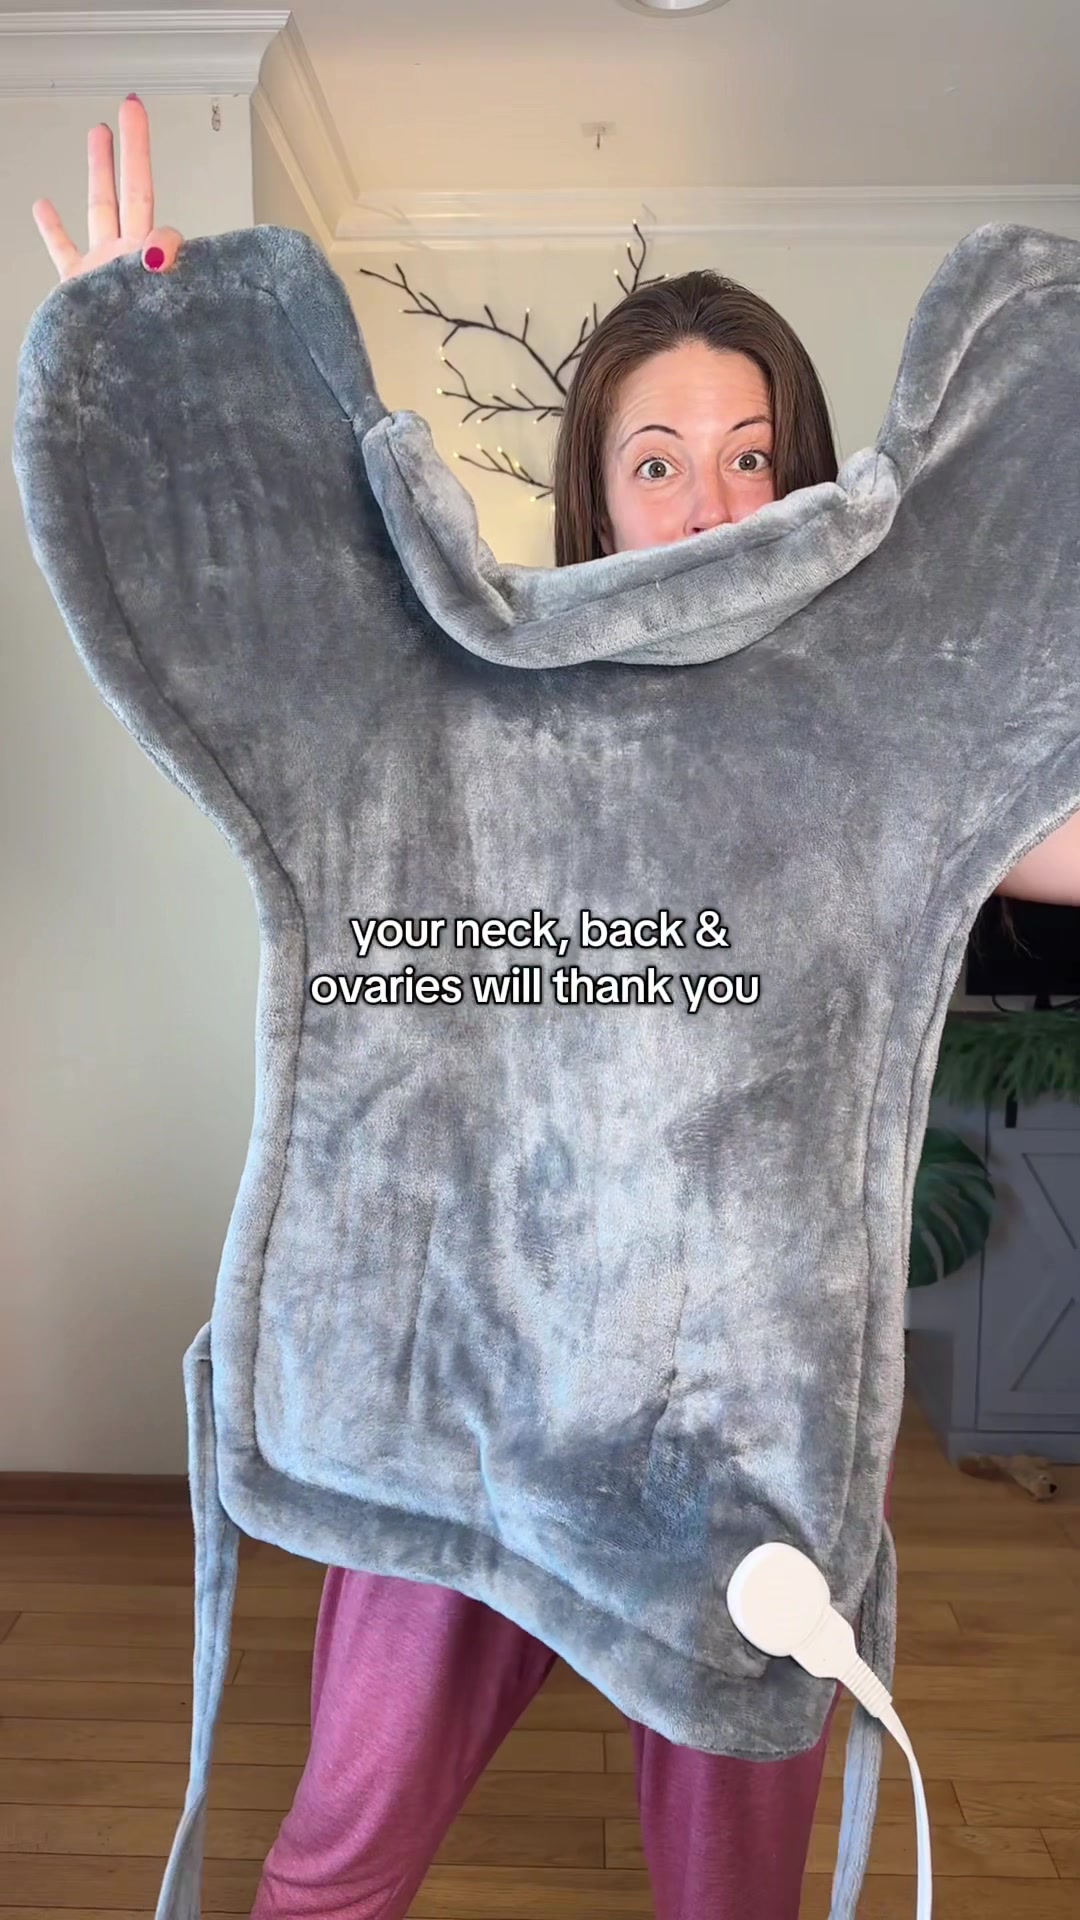
With 62.5% of partnerships featuring creators averaging <1K views, RENPHO's strategy suggests niche targeting and authenticity, likely leveraging collaboration models like gifting and affiliates to work with smaller creators.
Here is an example of a sponsored collaboration with a larger-audience creator on TikTok (52.8k avg views/post):
shopdealsbyquis x RENPHO

Influencer bio
Becoming Better, Together 📈 Paid Collabs: Marquisnelsontiktokaffiliate@gmail.com
Collaboration metrics
Get a free trial to find more data on influencer audiences, performance, and collaborations.
And here is another example with a smaller creator on TikTok (9.0k avg views/post):
samn8r x RENPHO
![TikTok post by @samn8r for RENPHO. Caption reads: [...] stress reliever for me these days 😌 @RENPHO....](https://images.od.modash.io/2c158cc03fe84dcc36ef5e634550108f3992ad29)
Influencer bio
FL ☀️ IF YOU’RE READING THIS, ILY boy mom, June 2026!! 💙 samanatorcollab@gmail.com
Collaboration metrics
Get a free trial to find more data on influencer audiences, performance, and collaborations.
RENPHO's repeat partnerships
Out of 1.6k unique influencers in our dataset, 93 of them (6%) posted content for RENPHO in 3 or more separate calendar months. The most consistent partner is @jackieriso, who has collaborated across 7 months with 57 total posts.
Here are 3 examples of RENPHO's repeat influencer partnerships, with links to the sponsored content.
jackieriso x RENPHO
![TikTok post by @jackieriso for RENPHO. Caption reads: [...] this one takes the 🎂 10% off: RENPHOFS....](https://images.od.modash.io/e80d612040ad684d86231a86b108c4f7a79cb7ee)
![TikTok post by @jackieriso for RENPHO. Caption reads: [...] #tiktokcybermonday @RENPHO.](https://images.od.modash.io/85d8bd2f944f03bee8ffa4d08dbdc55cd33760f3)
ladymawa x RENPHO
![YouTube post by @ladymawa for RENPHO. Caption reads: [...] plus free shipping ♥️ ✨✨✨ **⚖️ RENPHO APP....](https://images.od.modash.io/59f982c464d9e26ade0160cf4415a8bcf5b3ff9e)
![YouTube post by @ladymawa for RENPHO. Caption reads: [...] like to try it out ✨✨✨ **⚖️ RENPHO APP AND....](https://images.od.modash.io/1fbc0ae94931ae43ccbb87a1aefe5ac9d672d535)
![YouTube post by @ladymawa for RENPHO. Caption reads: [...] like to try it out ✨✨✨ **⚖️ RENPHO APP AND....](https://images.od.modash.io/9cc9c6b188238280e18d2bef46bce507ce6a79d8)
ambernicolefashion x RENPHO
![TikTok post by @ambernicolefashion for RENPHO. Caption reads: [...] I’ve linked it below! @RENPHO #heatingpad....](https://images.od.modash.io/d0d13c31b4fb7a676aeb0012f209987fe6e2a9ef)
![TikTok post by @ambernicolefashion for RENPHO. Caption reads: [...] this back heating pad from @RENPHO It’s....](https://images.od.modash.io/328077bd75b8757190cc3ce66d620cde47972340)
![TikTok post by @ambernicolefashion for RENPHO. Caption reads: [...] it! I’ve linked it below. @RENPHO #renpho....](https://images.od.modash.io/ffb324d32050ade6648781baffb1181ce6aeea23)
💡 Related resource: Long-Term Influencer Partnerships: Pros, Cons & How The Pros Manage Them.
Geographical breakdown
In our dataset, United States is where RENPHO had the most influencer activity. 53.2% of their live influencer content in the last 12 months was posted by American influencers.
Based on the percentage of influencer content per market, other important markets include:
- United Kingdom (9.8%)
- Japan (4.5%)
- Brazil (3.7%)
RENPHO's influencer activity by market
Here is another example of RENPHO collaborating with an influencer in United States.
jackieriso x RENPHO
RENPHO's influencer activity vs. related brands
RENPHO overlaps with WHOOP and Hidratei in connected wellness tech where data, routines, and habit-building drive retention. All three target health-focused creators for product integration in fitness and self-care content.
Total influencer content
RENPHO vs. related brands influencer activity
Total sponsored posts tracked (last 12 months)
Hidratei leads with 3.8k sponsored posts, notably outpacing RENPHO (3.1k posts) and WHOOP (2.1k posts). Across all three brands, the average volume is 3k posts, indicating mature, scaled influencer programs.
By social platform
RENPHO vs. related brands influencer activity (by social platform)
Sponsored posts by platform
RENPHO leads on TikTok and YouTube, while Hidratei leads on Instagram. The gap is most notable on TikTok, with RENPHO at 2.6k, Hidratei at 1.7k, WHOOP at 373 posts. RENPHO's activity is particularly concentrated on TikTok. On TikTok, RENPHO has far more posts than WHOOP, while on Instagram, RENPHO has far fewer posts than WHOOP and Hidratei.
By geographical market
RENPHO vs. related brands influencer activity (by country)
Estimated sponsored posts in RENPHO's top markets
Hidratei has the highest estimated sponsored-post volume in Brazil (3.5k posts, 92.9%), Portugal (19 posts, 0.5%), while RENPHO has the highest estimated sponsored-post volume in United States (1.6k posts, 53.2%), United Kingdom (303 posts, 9.8%), Japan (139 posts, 4.5%), while WHOOP leads in Australia with 135 posts (6.3%). RENPHO's strength in United States, United Kingdom, and Japan may indicate a home-market focus, while Hidratei shows broader regional investment.
Read more influencer strategy breakdowns
Looking for more like this? Here are 5 similar influencer marketing strategy breakdowns for other brands:
- WHOOP's Influencer Marketing Strategy
- Hidratei's Influencer Marketing Strategy
- DISSH's Influencer Marketing Strategy
- Nvgtn's Influencer Marketing Strategy
- VEGAMOUR's Influencer Marketing Strategy
Or, if you want to access data like this for your own software or processes, take a look at Modash's API products:
Frequently asked questions
Scaling your influencer program?
When you outgrow your mishmash of spreadsheets & free tools, try Modash. Find & email influencers, track campaigns, ship products & more - all in one place.