ELEGOO Influencer Marketing Strategy
(2026 Data & Insights)
We analyzed 2.1k pieces of influencer content sponsored by ELEGOO over the last 12 months.
This report breaks down where & how ELEGOO invests in influencer marketing, which social platforms they prioritize, top geographical markets, and more.
The data in this report comes from Modash's Brand Collaborations API.
P.S. for a simple list of influencers who have collaborated with ELEGOO, see here: ELEGOO influencers.
Influencer activity throughout the year
ELEGOO's influencer campaigns are active year-round with notable month-to-month fluctuation. The chart below shows month-by-month data for total sponsored posts tracked.
ELEGOO's influencer activity by month
Number of sponsored posts
ELEGOO's influencer output appears relatively consistent throughout the year, averaging about 173 sponsored posts per month. June recorded the highest volume at 236 posts (36% above average), while April was the quietest at 121 posts.
Social platforms breakdown
In our dataset (which only includes Instagram, YouTube, and TikTok), this is how the volume of ELEGOO's sponsored influencer collaborations break down by social platform:
- Instagram: 1.1k posts (53.1%)
- YouTube: 541 posts (26%)
- TikTok: 437 posts (21%)
ELEGOO's influencer activity by platform
Share of sponsored content by social network
Instagram influencer marketing is a clear focus for ELEGOO.
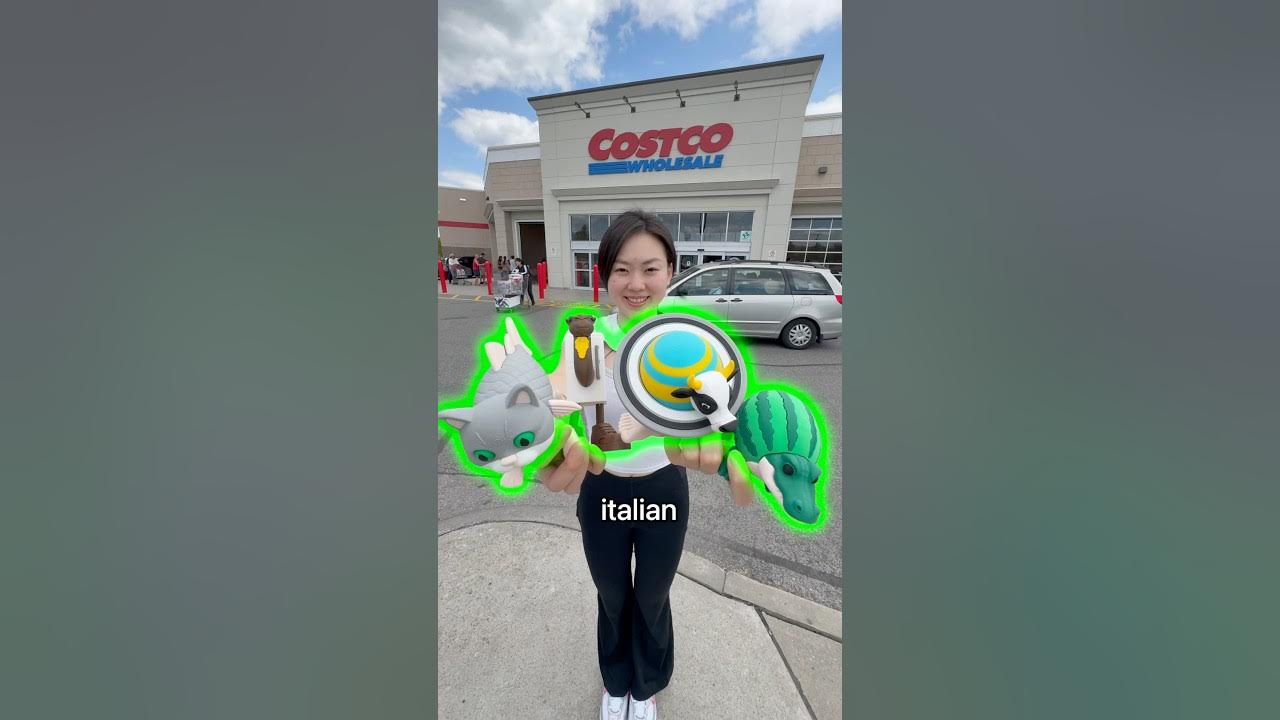
Here are 3 examples of ELEGOO's recent sponsored collaborations (one each for Instagram, TikTok, YouTube).
gracescharfdesign x ELEGOO
![Instagram post by @gracescharfdesign for ELEGOO. Caption reads: [...] let me know what you think! Thankyou to....](https://images.od.modash.io/4e22debdf2b55d0054f66e3ad88421a95361481e)
Influencer bio
Stocked at @agwadesignstore @solari_studio Xx
Collaboration metrics
Get a free trial to find more data on influencer audiences, performance, and collaborations.
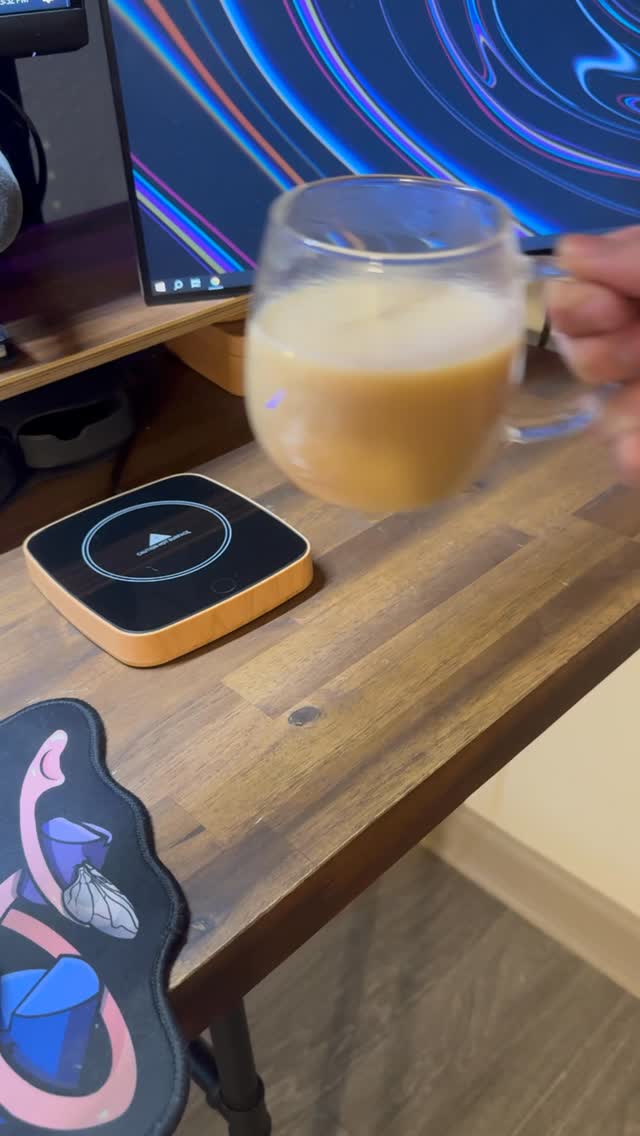
fattmariaphoto x ELEGOO

Influencer bio
Commercial Photographer | Boston
Collaboration metrics
Get a free trial to find more data on influencer audiences, performance, and collaborations.
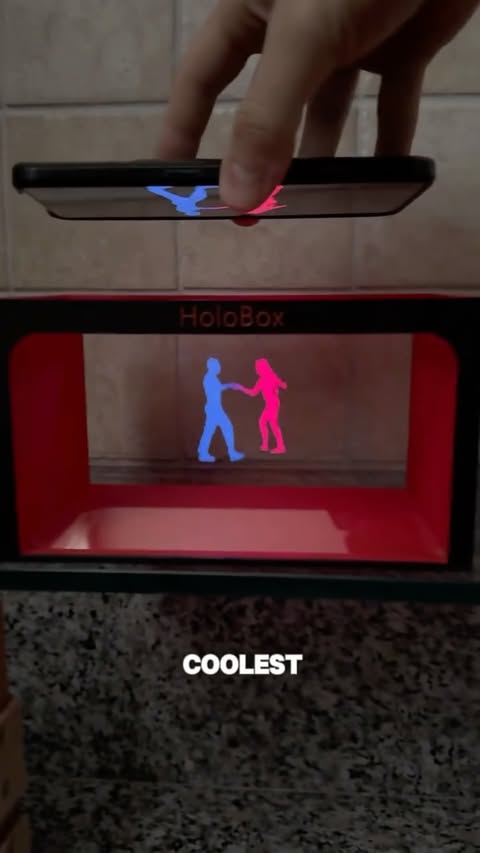
SleepyCrafter x ELEGOO
Influencer bio
Hi! My name is Summer. Let’s get crafty together! 🫶 📩 sleepycrafterYT@gmail.com Hope my videos bring a little joy to your day! Made with love (and caffeine ☕)
Collaboration metrics
Get a free trial to find more data on influencer audiences, performance, and collaborations.
If you break this down further by content type on Instagram, this is what it looks like:
- Reels: 81.3%
- Posts: 18.7%
💡 Related resource: How To Find Instagram Influencers.
Influencer audience size breakdown (by views)
For their top social platform (Instagram), here is a breakdown of the type of influencers ELEGOO are collaborating with, by audience size.
Note: this breakdown is based on each influencer's average views (not follower/subscriber count), because views typically correlate more closely with influencer pricing and impact.
ELEGOO's influencers average views (Instagram)
Based on each influencer's average views per post
With 37.4% of partnerships featuring creators averaging 10K-50K views, ELEGOO's strategy suggests cost-efficiency and engagement-focused partnerships.
Here is an example of a sponsored collaboration with a larger-audience creator on Instagram (2.2M avg views/post):
elegoo_fr x ELEGOO
![Instagram post by @elegoo_fr for ELEGOO. Caption reads: [...] Check the pinned post or link in bio #ELEGOO....](https://images.od.modash.io/7272794f43b9e78f612283a573cfc4baac93f446)
Influencer bio
Rejoignez notre défi #printforpets avec @elegoo et tentez de gagner une imprimante 3D 🥰
Collaboration metrics
Get a free trial to find more data on influencer audiences, performance, and collaborations.
And here is another example with a smaller creator on Instagram (9.9k avg views/post):
walsh3d x ELEGOO
Influencer bio
🇺🇸/🇨🇳 i 3d model personal: @walsh.stl
Collaboration metrics
Get a free trial to find more data on influencer audiences, performance, and collaborations.
ELEGOO's repeat partnerships
Out of 875 unique influencers in our dataset, 57 of them (7%) posted content for ELEGOO in 3 or more separate calendar months. The most consistent partner is @auspextactics, who has collaborated across 11 months with 41 total posts.
Here are 3 examples of ELEGOO's repeat influencer partnerships, with links to the sponsored content.
auspextactics x ELEGOO
![YouTube post by @auspextactics for ELEGOO. Caption reads: [...] Merch - 3D Printers from Elegoo Here -....](https://images.od.modash.io/ba66072c1cc60adf76950704b89cfbe886a3a623)
![YouTube post by @auspextactics for ELEGOO. Caption reads: [...] Merch - 3D Printers from Elegoo Here -....](https://images.od.modash.io/57403dceee68e70ef8a25965b60b04a41d1baac1)
![YouTube post by @auspextactics for ELEGOO. Caption reads: [...] Miniatures - 3D Printers from Elegoo Here -....](https://images.od.modash.io/390a6e13ac8ac09df04e5883fc4ed21ec24c84a7)
3d_printall x ELEGOO
![Instagram post by @3d_printall for ELEGOO. Caption reads: [...] parts printed with PETG on @elegoo Centauri....](https://images.od.modash.io/4dba9ea79286d8cf8b0ea5ead3de4c7b41452ce2)
![Instagram post by @3d_printall for ELEGOO. Caption reads: [...] 🏓 I used PLA and TPU on @elegoo Centauri....](https://images.od.modash.io/08b8be0cda66680bcc92716e3bc60f778ccc6c74)
elegoo_fr x ELEGOO
![Instagram post by @elegoo_fr for ELEGOO. Caption reads: [...] its own throne 👑 Printer: ELEGOO....](https://images.od.modash.io/7b90b3e313d98aff3569a0e12e5a00a141fbd771)
💡 Related resource: Long-Term Influencer Partnerships: Pros, Cons & How The Pros Manage Them.
Geographical breakdown
In our dataset, United States is where ELEGOO had the most influencer activity. 41.2% of their live influencer content in the last 12 months was posted by American influencers.
Based on the percentage of influencer content per market, other important markets include:
- Brazil (10.7%)
- United Kingdom (6.8%)
- India (4.8%)
ELEGOO's influencer activity by market
Here is another example of ELEGOO collaborating with an influencer in United States.
unclejessy4real x ELEGOO
![Instagram post by @unclejessy4real for ELEGOO. Caption reads: [...] @whitespaceprops Ref Maker App + your....](https://images.od.modash.io/5a27be005bef4349d9442eb7433e93e396ab31e2)
ELEGOO's influencer activity vs. related brands
ELEGOO competes in creator/DIY tech, and xTool and Polaroid are close adjacent benchmarks for how maker and creative hardware brands use influencer demos, project content, and review-driven consideration.
Total influencer content
ELEGOO vs. related brands influencer activity
Total sponsored posts tracked (last 12 months)
xTool leads with 3.1k sponsored posts, significantly outpacing ELEGOO (2.1k posts) and Polaroid (779 posts). Across all three brands, the average volume is 2k posts, suggesting established influencer marketing investments. Polaroid has far fewer total posts than ELEGOO and xTool.
By social platform
ELEGOO vs. related brands influencer activity (by social platform)
Sponsored posts by platform
ELEGOO leads on YouTube, while xTool has the most activity on Instagram and TikTok. The gap is most notable on Instagram, with xTool at 2.3k, ELEGOO at 1.1k, Polaroid at 556 posts. xTool's activity is particularly concentrated on Instagram. On YouTube, ELEGOO has far more posts than xTool and Polaroid.
By geographical market
ELEGOO vs. related brands influencer activity (by country)
Estimated sponsored posts in ELEGOO's top markets
xTool has the highest estimated sponsored-post volume in United States (1.2k posts, 37.5%), France (450 posts, 14.6%), Spain (222 posts, 7.2%), suggesting a Europe focus, while ELEGOO has the highest estimated sponsored-post volume in Brazil (223 posts, 10.7%), United Kingdom (142 posts, 6.8%), while Polaroid leads in Japan with 45 posts (5.8%). Looking at United States specifically, the split is xTool at 1.2k posts (37.5%), ELEGOO at 859 posts (41.2%), Polaroid at 368 posts (47.3%). ELEGOO's strength in United Kingdom may indicate a home-market focus, while xTool shows broader regional investment.
Read more influencer strategy breakdowns
Looking for more like this? Here are 5 similar influencer marketing strategy breakdowns for other brands:
- xTool's Influencer Marketing Strategy
- Polaroid's Influencer Marketing Strategy
- COROS's Influencer Marketing Strategy
- Universal Musiek's Influencer Marketing Strategy
- BLUETTI's Influencer Marketing Strategy
Or, if you want to access data like this for your own software or processes, take a look at Modash's API products:
Scaling your influencer program?
When you outgrow your mishmash of spreadsheets & free tools, try Modash. Find & email influencers, track campaigns, ship products & more - all in one place.