xTool Influencer Marketing Strategy
(2026 Data & Insights)
We analyzed 3.1k pieces of influencer content sponsored by xTool over the last 12 months.
This report breaks down where & how xTool invests in influencer marketing, which social platforms they prioritize, top geographical markets, and more.
The data in this report comes from Modash's Brand Collaborations API.
P.S. for a simple list of influencers who have collaborated with xTool, see here: xTool influencers.
Influencer activity throughout the year
xTool's influencer campaigns are active year-round with notable month-to-month fluctuation. The chart below shows month-by-month data for total sponsored posts tracked.
xTool's influencer activity by month
Number of sponsored posts
xTool's sponsored post volume peaks in December with 428 posts, 67% higher than the monthly average of 257. April recorded the lowest activity at 123 posts, 52% below average.
Social platforms breakdown
In our dataset (which only includes Instagram, YouTube, and TikTok), this is how the volume of xTool's sponsored influencer collaborations break down by social platform:
- Instagram: 2.3k posts (75%)
- TikTok: 712 posts (23.1%)
- YouTube: 59 posts (1.9%)
xTool's influencer activity by platform
Share of sponsored content by social network
Instagram influencer marketing is a clear focus for xTool.
Here are 3 examples of xTool's recent sponsored collaborations (one each for Instagram, TikTok, YouTube).
sheikhendesigns x xTool

Influencer bio
━ ɴᴏʀᴡᴇɢɪᴀɴ ᴍᴀᴅᴇ ᴊᴇᴡᴇʟʀʏ | ᴄʀᴀꜰᴛᴇᴅ ᴡɪᴛʜ ʜᴇʀɪᴛᴀɢᴇ ━ @abdel_shb
Collaboration metrics
Get a free trial to find more data on influencer audiences, performance, and collaborations.
familleenxl x xTool
![TikTok post by @familleenxl for xTool. Caption reads: [...] "INCROYAUX" cliquez sur le lien☝️ #xtool....](https://images.od.modash.io/c8c2e8e5967bd249e0133c48d4857e0db15a8bea)
Influencer bio
tout simplement nous et nos délires en famille contact : familleenxl@outlook.fr
Collaboration metrics
Get a free trial to find more data on influencer audiences, performance, and collaborations.
BODY3D x xTool
![YouTube post by @BODY3D for xTool. Caption reads: [...] couleurs, alors j'ai gravé dessus ! 😏....](https://images.od.modash.io/bb96a96f0ed42c97c0ed8f7664d777371f631242)
Influencer bio
🎨 Modélisation & impression 3D 🛠️ Jouets, Fidgets & Projets 🌍 +600 000 passionnés de 3D dans la communauté ⬇️ Lien en bio
Collaboration metrics
Get a free trial to find more data on influencer audiences, performance, and collaborations.
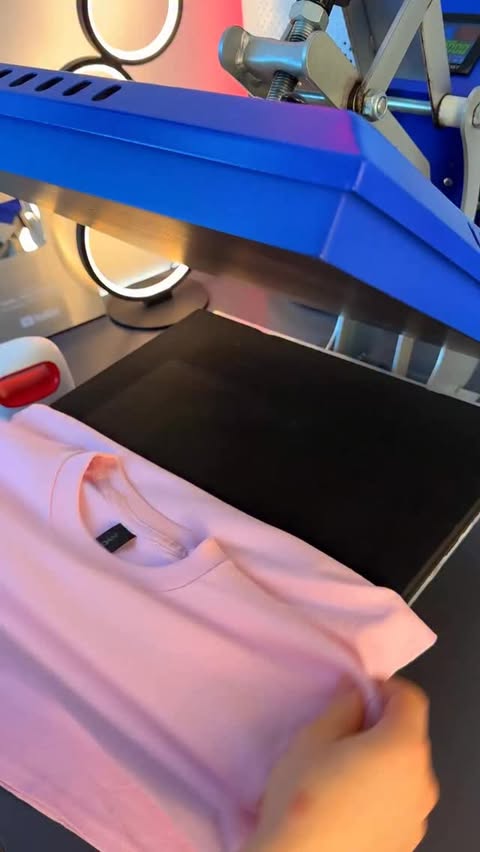
If you break this down further by content type on Instagram, this is what it looks like:
- Reels: 94.5%
- Posts: 5.5%
💡 Related resource: How To Find Instagram Influencers.
Influencer audience size breakdown (by views)
For their top social platform (Instagram), here is a breakdown of the type of influencers xTool are collaborating with, by audience size.
Note: this breakdown is based on each influencer's average views (not follower/subscriber count), because views typically correlate more closely with influencer pricing and impact.
xTool's influencers average views (Instagram)
Based on each influencer's average views per post
With 43.7% of partnerships featuring creators averaging 10K-50K views, xTool's strategy suggests cost-efficiency and engagement-focused partnerships.
Here is an example of a sponsored collaboration with a larger-audience creator on Instagram (1.7M avg views/post):
startupdeacasa x xTool
Influencer bio
👇Start Business 🤝
Collaboration metrics
Get a free trial to find more data on influencer audiences, performance, and collaborations.
And here is another example with a smaller creator on Instagram (10.0k avg views/post):
atomm_official x xTool
![Instagram post by @atomm_official for xTool. Caption reads: [...] in my bio. Partnership @atomm_official &....](https://images.od.modash.io/91f820a79857a71fb34659466389991dabe866cb)
Influencer bio
Collaboration metrics
Get a free trial to find more data on influencer audiences, performance, and collaborations.
xTool's repeat partnerships
Out of 1k unique influencers in our dataset, 206 of them (20%) posted content for xTool in 3 or more separate calendar months. The most consistent partner is @theimaginery, who has collaborated across 11 months with 31 total posts.
Here are 3 examples of xTool's repeat influencer partnerships, with links to the sponsored content.
theimaginery x xTool
![Instagram post by @theimaginery for xTool. Caption reads: • XTOOL F2 • En colaboración con xTool [...].](https://images.od.modash.io/586a500fba7f014e193ce815d3868784d974557b)
![Instagram post by @theimaginery for xTool. Caption reads: • XTOOL APPAREL PRINTER • ⠀⠀⠀⠀⠀⠀⠀⠀⠀ [...].](https://images.od.modash.io/9b8e26711627fae912d1c39e37cb5e81e6fbdc0f)
![Instagram post by @theimaginery for xTool. Caption reads: [...] para colgar en sus mochilas 🤩 xTool P2 los....](https://images.od.modash.io/c42881fa7f28aea208ac9c3621f048a24d48cbb9)
marion_tubiana_artist x xTool
![Instagram post by @marion_tubiana_artist for xTool. Caption reads: [...] #atomm #diy #noelmagique #xtool #xtoolfrance....](https://images.od.modash.io/ac0e93ca26e9992dea5a65a460dda3e8c5e694d5)
![Instagram post by @marion_tubiana_artist for xTool. Caption reads: [...] l’atelier : J’ai dégainé la xTool F2 et le....](https://images.od.modash.io/f184de55f06f307218cee41faa88b9f62ff7af1e)
![Instagram post by @marion_tubiana_artist for xTool. Caption reads: [...] ou codes promos par message 📨 #xtool....](https://images.od.modash.io/883462c4c25cea4dc514e6e0b543cddb0fdacebb)
crispscrafts x xTool
![TikTok post by @crispscrafts for xTool. Caption reads: [...] #winter #foryoupage #fyp #fyf @xTool....](https://images.od.modash.io/5c264d2e96dc702a9219e6bd5b861ea3e674e401)
![TikTok post by @crispscrafts for xTool. Caption reads: [...] #foryoupage #fyf #fyp @xTool @xtoolofficial.](https://images.od.modash.io/70700cc723f3f496958773530c62c4281efde99e)
![TikTok post by @crispscrafts for xTool. Caption reads: [...] #fyp #fyf #christmas @xTool @xtoolofficial.](https://images.od.modash.io/96be7ee4f3d9abfeaaa6869857ce06fd90a83af1)
💡 Related resource: Long-Term Influencer Partnerships: Pros, Cons & How The Pros Manage Them.
Geographical breakdown
In our dataset, United States is where xTool had the most influencer activity. 37.5% of their live influencer content in the last 12 months was posted by American influencers.
Based on the percentage of influencer content per market, other important markets include:
- France (14.6%)
- Spain (7.2%)
- Brazil (6.2%)
xTool's influencer activity by market
Here is another example of xTool collaborating with an influencer in United States.
pygmallionaire x xTool
xTool's influencer activity vs. related brands
xTool overlaps with ELEGOO and Ohuhu in the maker/DIY creator economy, where crafting tools and creative outputs are showcased through tutorial-driven influencer content and project-based UGC.
Total influencer content
xTool vs. related brands influencer activity
Total sponsored posts tracked (last 12 months)
Ohuhu leads with 5.6k sponsored posts, significantly outpacing xTool (3.1k posts) and ELEGOO (2.2k posts). Across all three brands, the average volume is 3.6k posts, indicating mature, scaled influencer programs.
By social platform
xTool vs. related brands influencer activity (by social platform)
Sponsored posts by platform
xTool leads on Instagram, while Ohuhu has the most activity on TikTok and YouTube. The gap is most notable on TikTok, with Ohuhu at 4.3k, xTool at 712, ELEGOO at 407 posts. xTool's activity is particularly concentrated on Instagram. Ohuhu has far more TikTok posts than xTool and ELEGOO, while xTool has far more Instagram posts than ELEGOO and Ohuhu.
By geographical market
xTool vs. related brands influencer activity (by country)
Estimated sponsored posts in xTool's top markets
Ohuhu has the highest estimated sponsored-post volume in United States (2.1k posts, 37%), India (721 posts, 12.8%), Brazil (360 posts, 6.4%), while xTool has the highest estimated sponsored-post volume in France (450 posts, 14.6%), Spain (222 posts, 7.2%), suggesting a Europe focus, while ELEGOO leads in United Kingdom with 167 posts (7.5%). Looking at United States specifically, the split is Ohuhu at 2.1k posts (37%), xTool at 1.2k posts (37.5%), ELEGOO at 935 posts (41.9%). xTool's strength in France may indicate a home-market focus, while Ohuhu shows broader regional investment.
Read more influencer strategy breakdowns
Looking for more like this? Here are 5 similar influencer marketing strategy breakdowns for other brands:
- ELEGOO's Influencer Marketing Strategy
- Ohuhu's Influencer Marketing Strategy
- WHOOP's Influencer Marketing Strategy
- TIRTIR's Influencer Marketing Strategy
- EVRY JEWELS's Influencer Marketing Strategy
Or, if you want to access data like this for your own software or processes, take a look at Modash's API products:
Scaling your influencer program?
When you outgrow your mishmash of spreadsheets & free tools, try Modash. Find & email influencers, track campaigns, ship products & more - all in one place.