Neuro Influencer Marketing Strategy
(2026 Data & Insights)
We analyzed 8.8k pieces of influencer content sponsored by Neuro over the last 12 months.
This report breaks down where & how Neuro invests in influencer marketing, which social platforms they prioritize, top geographical markets, and more.
The data in this report comes from Modash's Brand Collaborations API.
P.S. for a simple list of influencers who have collaborated with Neuro, see here: Neuro influencers.
Influencer activity throughout the year
Neuro's influencer campaigns are active year-round with notable month-to-month fluctuation. The chart below shows month-by-month data for total sponsored posts tracked.
Neuro's influencer activity by month
Number of sponsored posts
Neuro's sponsored post volume appears to trend upward over the 12-month period, rising from 661 posts in January to 1.4k in December. The peak month, December, reached 1.4k posts, 91% higher than the monthly average of 729.
Social platforms breakdown
In our dataset (which only includes Instagram, YouTube, and TikTok), this is how the volume of Neuro's sponsored influencer collaborations break down by social platform:
- TikTok: 8.6k posts (97.7%)
- YouTube: 203 posts (2.3%)
Neuro's influencer activity by platform
Share of sponsored content by social network
TikTok influencer marketing is a clear focus for Neuro.
Here are 2 examples of Neuro's recent sponsored collaborations (one each for TikTok, YouTube).
nursehanni x Neuro

Influencer bio
travel cath lab nurse a swirly twirly girly ! 🫀✨🪩🤸🏼♀️ dancing, singing, saving lives 💌 nursehanni@gmail.com
Collaboration metrics
Get a free trial to find more data on influencer audiences, performance, and collaborations.
TimDillonShow x Neuro
![YouTube post by @TimDillonShow for Neuro. Caption reads: [...] into the fryer. Live Dates: 🎟 SPONSORS:....](https://images.od.modash.io/109d8d2b2551c0f5c7a374c3d2e6dc97edf7ca8c)
Influencer bio
The Tim Dillon Show airs every Saturday at 9am PST. For bonus episodes every week, and the entire archive of the show: https://www.patreon.com/thetimdillonshow Live Dates! http://timdilloncomedy.com/#shows
Collaboration metrics
Get a free trial to find more data on influencer audiences, performance, and collaborations.
If you break this down further by content type on TikTok, this is what it looks like:
- Videos: 93.4%
- Carousels: 6.6%
💡 Related resource: How To Find TikTok Influencers.
Influencer audience size breakdown (by views)
For their top social platform (TikTok), here is a breakdown of the type of influencers Neuro are collaborating with, by audience size.
Note: this breakdown is based on each influencer's average views (not follower/subscriber count), because views typically correlate more closely with influencer pricing and impact.
Neuro's influencers average views (TikTok)
Based on each influencer's average views per post
With 84.9% of partnerships featuring creators averaging <1K views, Neuro's strategy suggests niche targeting and authenticity, likely leveraging collaboration models like gifting and affiliates to work with smaller creators.
Here is an example of a sponsored collaboration with a larger-audience creator on TikTok (586.8k avg views/post):
meavisdeals x Neuro
Influencer bio
Best Finds on TikTok Shop 📲 collinjbbiz@gmail.com 📩 Portfolio ⬇️
Collaboration metrics
Get a free trial to find more data on influencer audiences, performance, and collaborations.
And here is another example with a smaller creator on TikTok (9.7k avg views/post):
antonioastorga77 x Neuro
![TikTok post by @antonioastorga77 for Neuro. Caption reads: [...] café es igual a una gama de máscara de....](https://images.od.modash.io/a43adc8a9c481c7f440bb523017266ec36fdf15b)
Influencer bio
📈Aprende TikTok Shop💡 | Productos 👇🏼 GRATIS | 💰Descuentos | Estilo🙌🏼 | Tecnología 📲🛠
Collaboration metrics
Get a free trial to find more data on influencer audiences, performance, and collaborations.
Neuro's repeat partnerships
Out of 3.3k unique influencers in our dataset, 290 of them (9%) posted content for Neuro in 3 or more separate calendar months. The most consistent partner is @deadtalkspodcast, who has collaborated across 11 months with 96 total posts.
Here are 3 examples of Neuro's repeat influencer partnerships, with links to the sponsored content.
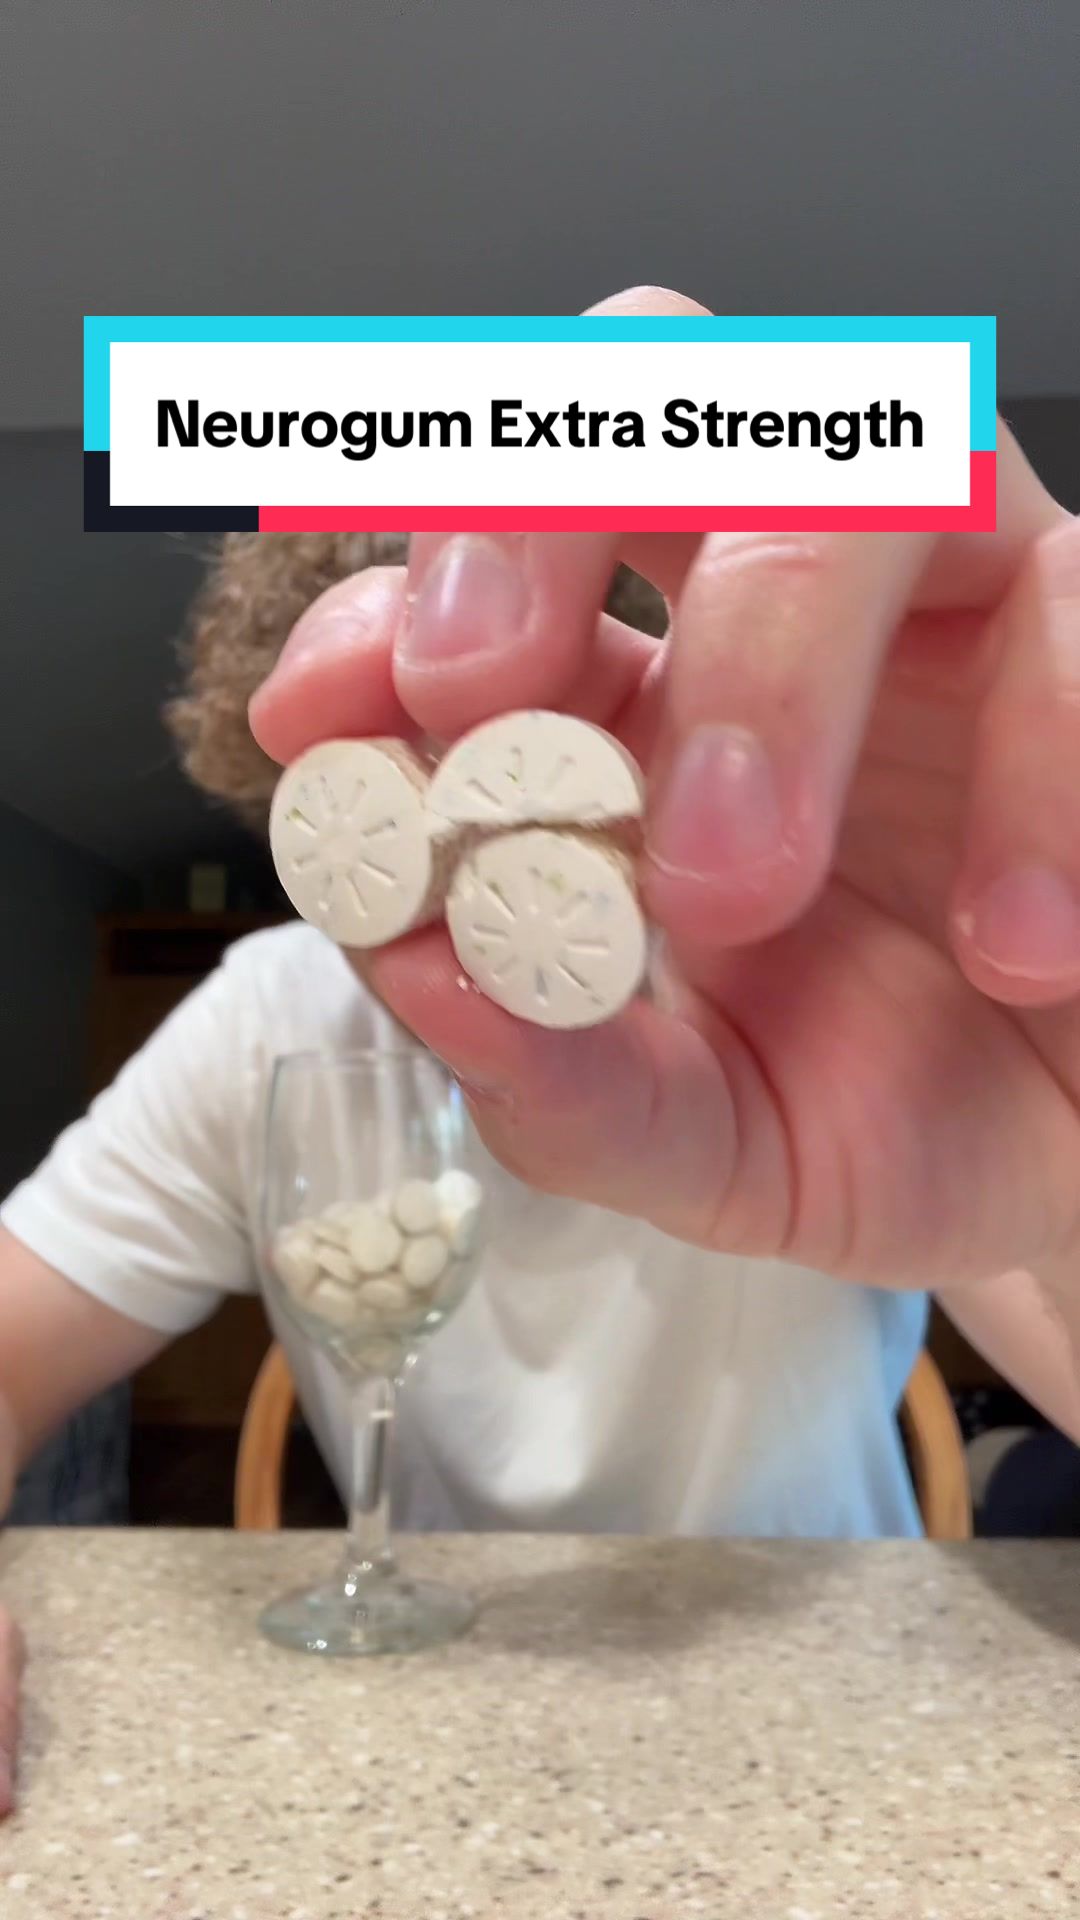
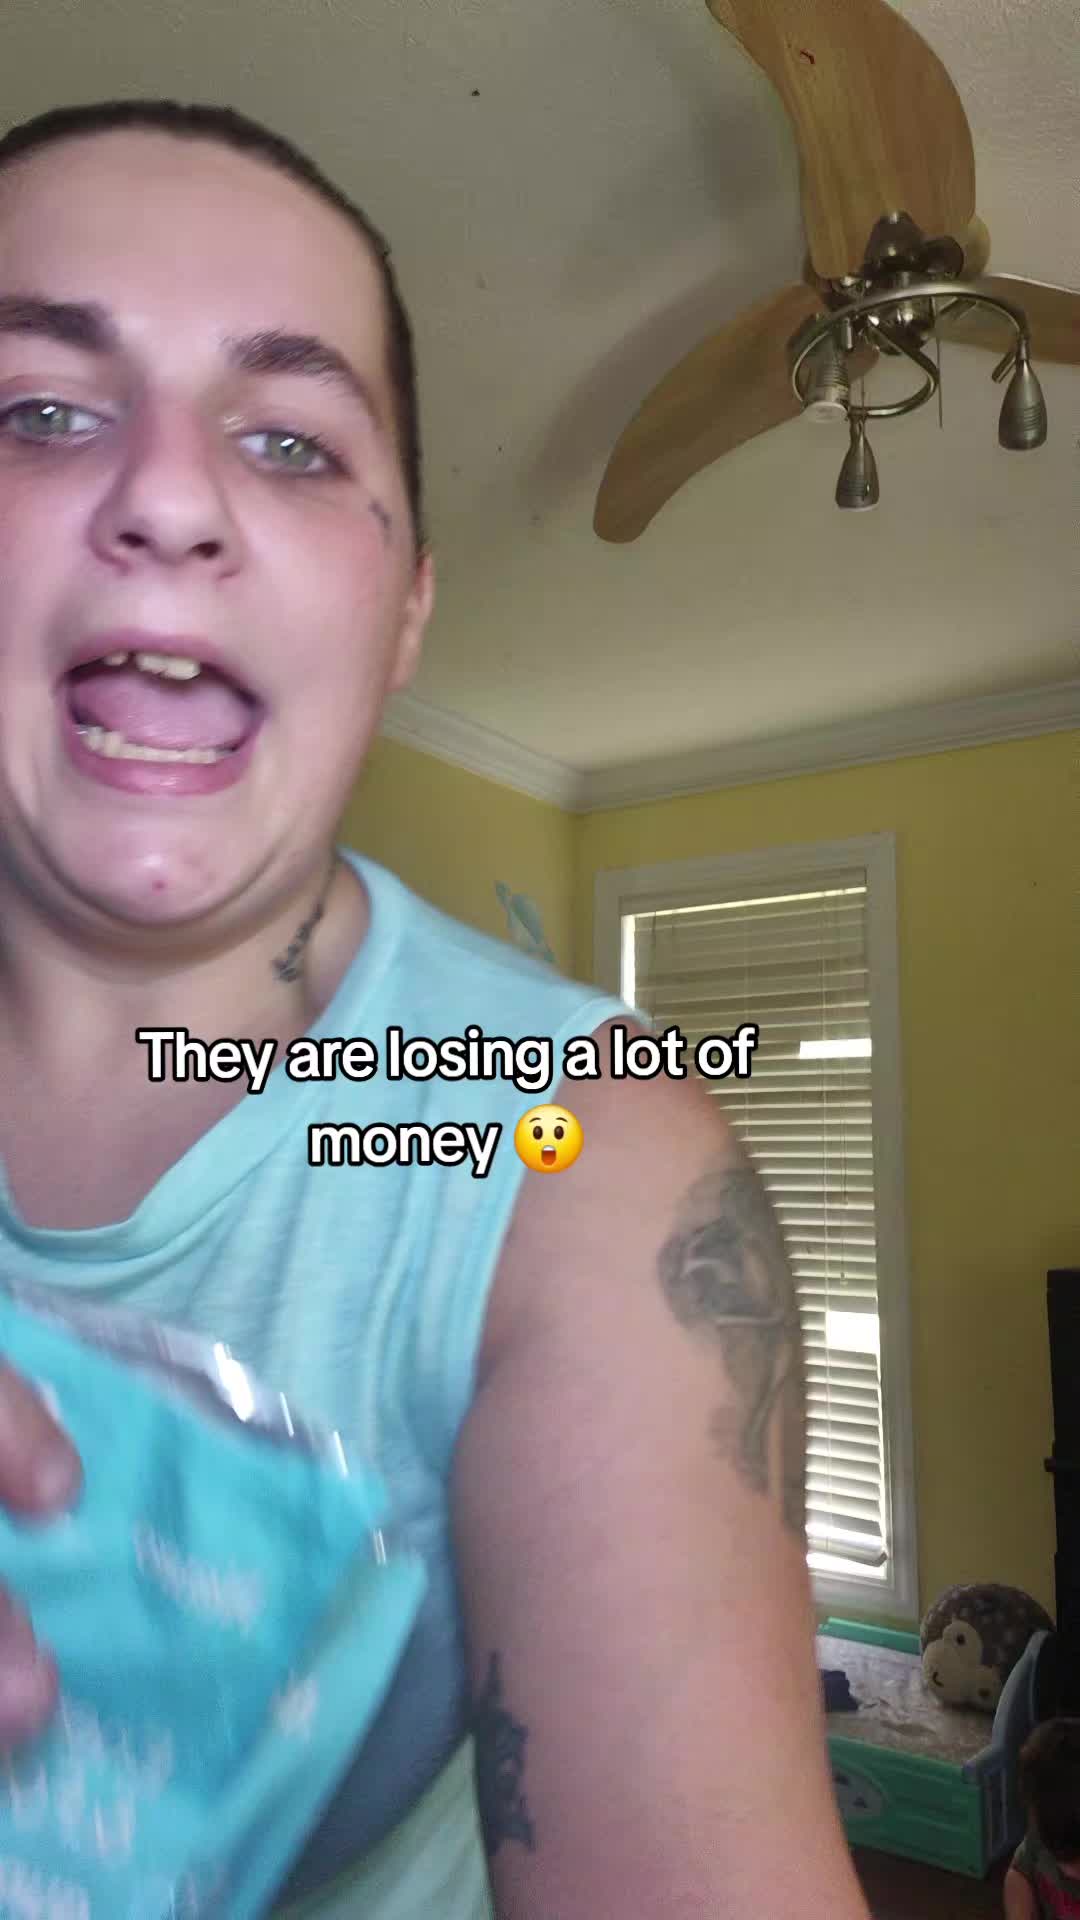
breeannadunn x Neuro
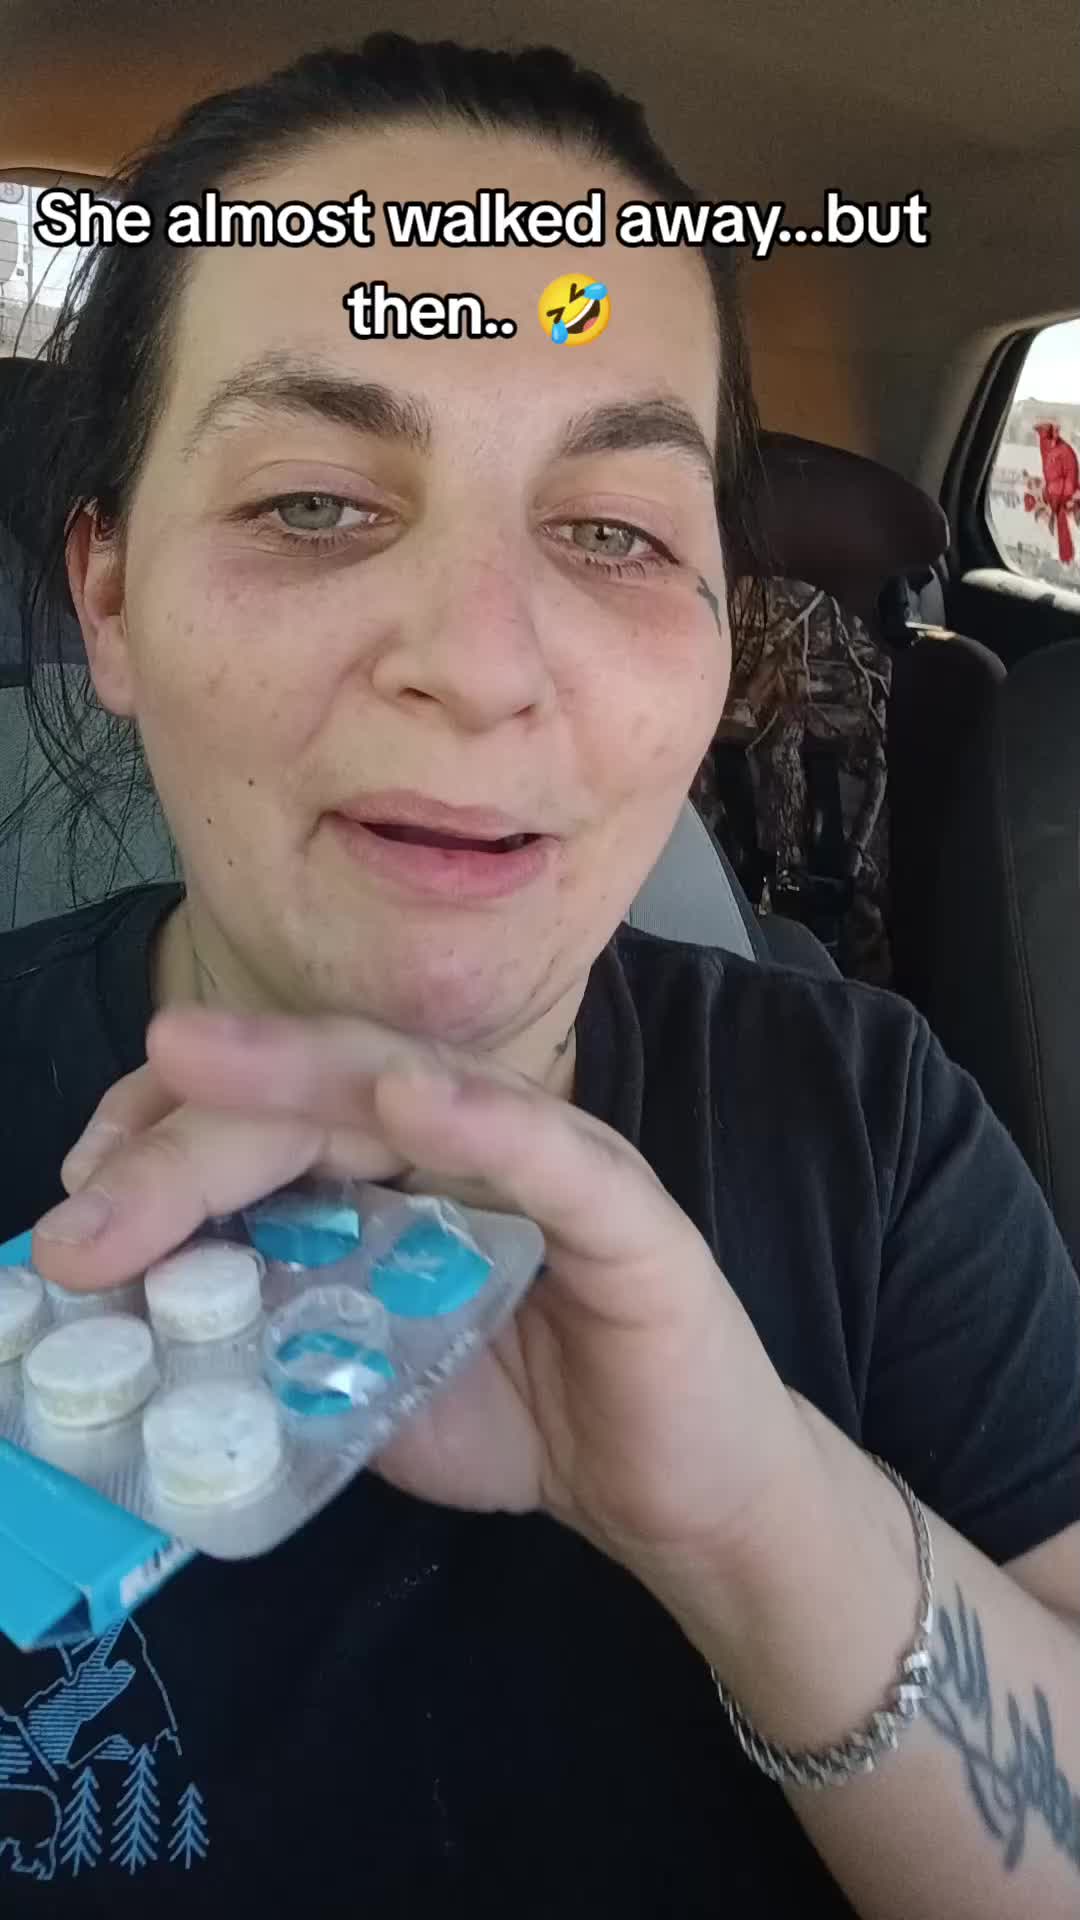
![TikTok post by @breeannadunn for Neuro. Caption reads: @Neuro Gum #dealsforyoudays #mrbeast [...].](https://images.od.modash.io/2214898bc51a0bcc064d9ca8e96b8267208cce3f)
pfinlaw x Neuro
![TikTok post by @pfinlaw for Neuro. Caption reads: [...] on a #budget or looking to try #neurogum for....](https://images.od.modash.io/a21b7b61876c2eabbba2e698d4af23336059bde3)
![TikTok post by @pfinlaw for Neuro. Caption reads: #neurogum #sale #savebig [...].](https://images.od.modash.io/e9861229313bf478015cd4ff656724080ec4158c)
![TikTok post by @pfinlaw for Neuro. Caption reads: [...] an #affordable bundle of #neurogum that has....](https://images.od.modash.io/13dc826f03c2da2339379762d7f221c72d831923)
christinagenx71 x Neuro
![TikTok post by @christinagenx71 for Neuro. Caption reads: @Neuro Gum Hey GenX if ya need a [...].](https://images.od.modash.io/816627840eacea0cd1c5388c7b1819cefca5220c)

![TikTok post by @christinagenx71 for Neuro. Caption reads: Neuro Energy and Focus gum gives that [...].](https://images.od.modash.io/b3a4e9e199f43d82d447ea15d92526c015aa6a47)
💡 Related resource: Long-Term Influencer Partnerships: Pros, Cons & How The Pros Manage Them.
Geographical breakdown
In our dataset, United States is where Neuro had the most influencer activity. 73.6% of their live influencer content in the last 12 months was posted by American influencers.
Based on the percentage of influencer content per market, other important markets include:
- Canada (9.2%)
- United Kingdom (7.7%)
- Australia (2.9%)
Neuro's influencer activity by market
Here is another example of Neuro collaborating with an influencer in United States.
repwellnesss x Neuro
![TikTok post by @repwellnesss for Neuro. Caption reads: [...] Von x Blou & Zias x Daniel Lubetzky ||....](https://images.od.modash.io/4038c18b65b2c88a24ca5423a7eddde7cd5c88b9)
Neuro's influencer activity vs. related brands
Neuro’s functional beverage positioning competes with Poppi and OLIPOP for better-for-you drinkers, with similar influencer angles around daily routines, taste tests, and wellness benefits.
Total influencer content
Neuro vs. related brands influencer activity
Total sponsored posts tracked (last 12 months)
Poppi leads with 9.5k sponsored posts, marginally ahead of Neuro (8.8k posts) and OLIPOP (5.9k posts). Across all three brands, the average volume is 8.1k posts, indicating mature, scaled influencer programs.
By social platform
Neuro vs. related brands influencer activity (by social platform)
Sponsored posts by platform
Neuro leads on TikTok, while Poppi has the most activity on Instagram and OLIPOP has the most activity on YouTube. The gap is most notable on TikTok, with Neuro at 8.6k, Poppi at 6.7k, OLIPOP at 2.7k posts. Neuro's activity is particularly concentrated on TikTok. Neuro has far more TikTok posts than OLIPOP and no Instagram posts, while Poppi and OLIPOP each have thousands on Instagram.
By geographical market
Neuro vs. related brands influencer activity (by country)
Estimated sponsored posts in Neuro's top markets
Poppi leads in United States with 7.4k posts (77.4%), while Neuro has the highest estimated sponsored-post volume in Canada (808 posts, 9.2%), United Kingdom (676 posts, 7.7%). Looking at United States specifically, the split is Poppi at 7.4k posts (77.4%), Neuro at 6.5k posts (73.6%), OLIPOP at 4.8k posts (81.9%).
Read more influencer strategy breakdowns
Looking for more like this? Here are 5 similar influencer marketing strategy breakdowns for other brands:
- Poppi's Influencer Marketing Strategy
- OLIPOP's Influencer Marketing Strategy
- Curlyme's Influencer Marketing Strategy
- Outcast Clothing's Influencer Marketing Strategy
- Forever21's Influencer Marketing Strategy
Or, if you want to access data like this for your own software or processes, take a look at Modash's API products:
Frequently asked questions
Scaling your influencer program?
When you outgrow your mishmash of spreadsheets & free tools, try Modash. Find & email influencers, track campaigns, ship products & more - all in one place.