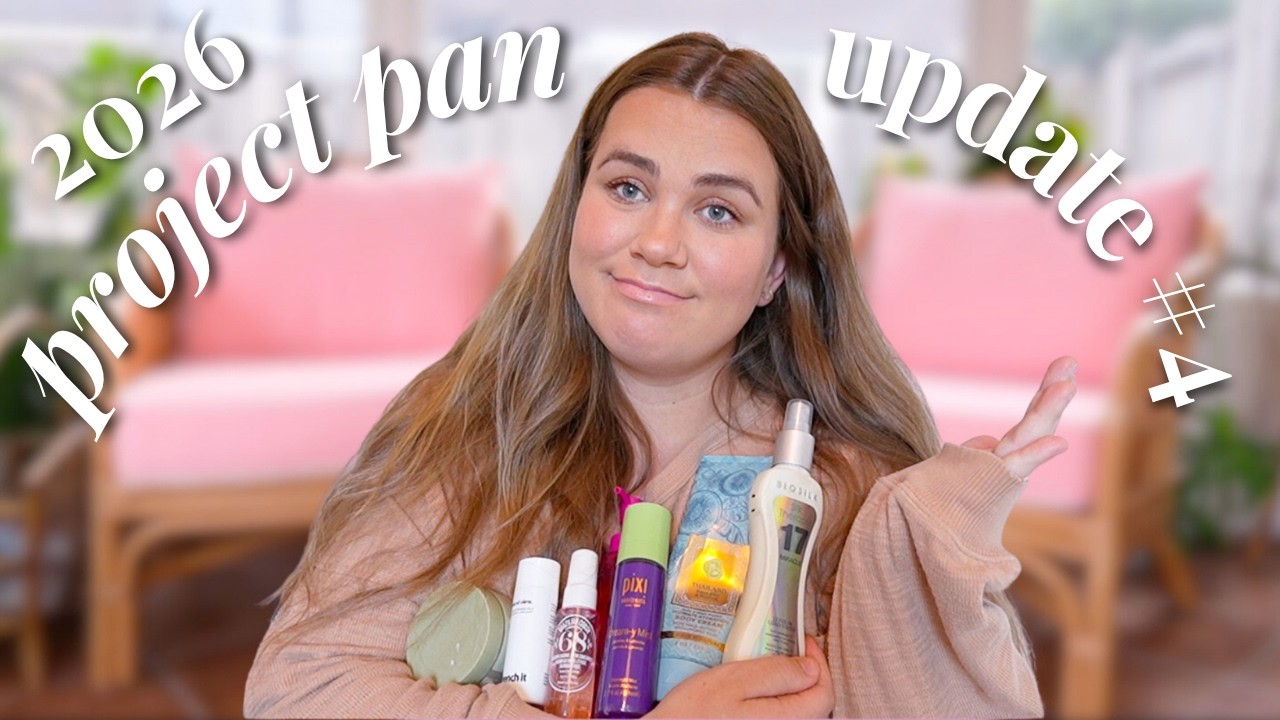
OFRA Cosmetics Influencer Marketing Strategy
(2026 Data & Insights)
We analyzed 1.7k pieces of influencer content sponsored by OFRA Cosmetics over the last 12 months.
This report breaks down where & how OFRA Cosmetics invests in influencer marketing, which social platforms they prioritize, top geographical markets, and more.
The data in this report comes from Modash's Brand Collaborations API.
P.S. for a simple list of influencers who have collaborated with OFRA Cosmetics, see here: OFRA Cosmetics influencers.
Influencer activity throughout the year
OFRA Cosmetics's influencer campaigns are active year-round with notable month-to-month fluctuation. The chart below shows month-by-month data for total sponsored posts tracked.
OFRA Cosmetics's influencer activity by month
Number of sponsored posts
OFRA Cosmetics's influencer output appears relatively consistent throughout the year, averaging about 140 sponsored posts per month. May recorded the highest volume at 212 posts (51% above average), while October was the quietest at 109 posts.
Social platforms breakdown
In our dataset (which only includes Instagram, YouTube, and TikTok), this is how the volume of OFRA Cosmetics's sponsored influencer collaborations break down by social platform:
- Instagram: 887 posts (52.6%)
- TikTok: 756 posts (44.9%)
- YouTube: 42 posts (2.5%)
OFRA Cosmetics's influencer activity by platform
Share of sponsored content by social network
Instagram influencer marketing is a clear focus for OFRA Cosmetics.
Here are 3 examples of OFRA Cosmetics's recent sponsored collaborations (one each for Instagram, TikTok, YouTube).
ujjja_e x OFRA Cosmetics

Influencer bio
🌷🌷🌷🌷🌷🌷🌷🌷 ️🌈색 조합 장인이 되리라 🎀오드타입 최저가 프로필링크🔥🎀 💌 mohanu.yujin@gmail.com
Collaboration metrics
Get a free trial to find more data on influencer audiences, performance, and collaborations.
brittanymiller344 x OFRA Cosmetics
![TikTok post by @brittanymiller344 for OFRA Cosmetics. Caption reads: [...] Revolution Irl Concealer (C15) @OFRA....](https://images.od.modash.io/e65dbd97b1a453806464a059a4fa0b676968825e)
Influencer bio
Makeup • Skincare • Lifestyle @bririxx is my secondary 📩Lillian.Esedebe@grail-talent.com 🇯🇲
Collaboration metrics
Get a free trial to find more data on influencer audiences, performance, and collaborations.
PaigeKoren x OFRA Cosmetics
Influencer bio
Hey guys! My name is Paige! I am a 28 year old mom and I live in Jacksonville, Florida. I love sharing my life on the internet :) Instagram: @misspaigekoren TikTok: @misspaigekoren
Collaboration metrics
Get a free trial to find more data on influencer audiences, performance, and collaborations.
If you break this down further by content type on Instagram, this is what it looks like:
- Reels: 63.4%
- Posts: 36.6%
💡 Related resource: How To Find Instagram Influencers.
Influencer audience size breakdown (by views)
For their top social platform (Instagram), here is a breakdown of the type of influencers OFRA Cosmetics are collaborating with, by audience size.
Note: this breakdown is based on each influencer's average views (not follower/subscriber count), because views typically correlate more closely with influencer pricing and impact.
OFRA Cosmetics's influencers average views (Instagram)
Based on each influencer's average views per post
OFRA Cosmetics's creator selection appears relatively diversified across size tiers, with no single segment dominating. This suggests a balanced approach to influencer partnerships, spreading investment across different audience sizes.
Here is an example of a sponsored collaboration with a larger-audience creator on Instagram (689.5k avg views/post, 580.9k followers):
ham._.cheeze x OFRA Cosmetics

Influencer bio
⠀ 📧 hamcheeezz@gmail.com ⋆꙳⊹⋰ @ham._daily 먹방/일상은 여기 💭
Collaboration metrics
Get a free trial to find more data on influencer audiences, performance, and collaborations.
And here is another example with a smaller creator on Instagram (6.5k avg views/post, 41.6k followers):
indolented_h x OFRA Cosmetics

Influencer bio
📩 leehyewon.biz@gmail.com
Collaboration metrics
Get a free trial to find more data on influencer audiences, performance, and collaborations.
OFRA Cosmetics's repeat partnerships
Out of 1.1k unique influencers in our dataset, 40 of them (4%) posted content for OFRA Cosmetics in 3 or more separate calendar months. The most consistent partner is @jessicadadlani, who has collaborated across 10 months with 38 total posts.
Here are 3 examples of OFRA Cosmetics's repeat influencer partnerships, with links to the sponsored content.
jessicadadlani x OFRA Cosmetics
![TikTok post by @jessicadadlani for OFRA Cosmetics. Caption reads: [...] cashmere palette from @OFRA Cosmetics, LLC....](https://images.od.modash.io/b5f9faa98dd4fe07216c2e5e8c9c5d312860d81b)
![TikTok post by @jessicadadlani for OFRA Cosmetics. Caption reads: [...] palette is everything @OFRA Cosmetics, LLC....](https://images.od.modash.io/9c635fb849371f8bb94d742ca38e54224d524571)
![TikTok post by @jessicadadlani for OFRA Cosmetics. Caption reads: [...] It is so stinking good. @OFRA Cosmetics, LLC....](https://images.od.modash.io/a3472ace01ff1aad8f8d64e921744d07f2c0d6b9)
_its..tori x OFRA Cosmetics
![TikTok post by @_its..tori for OFRA Cosmetics. Caption reads: [...] my ride or die pallete 🤞 @OFRA Cosmetics,....](https://images.od.modash.io/041cee4a40d3fa96520d2b79fd9e949dff54c92f)
![TikTok post by @_its..tori for OFRA Cosmetics. Caption reads: [...] @e.l.f. Cosmetics @OFRA Cosmetics, LLC....](https://images.od.modash.io/e64cbe82c39fb37a491459d6c3ae50dfddd529db)
![TikTok post by @_its..tori for OFRA Cosmetics. Caption reads: [...] @L’Oréal Professionnel @OFRA Cosmetics, LLC.](https://images.od.modash.io/73b0dfeb96d14a97fd71231a7f76e2ba7b40b2db)
anjane.xo x OFRA Cosmetics
![TikTok post by @anjane.xo for OFRA Cosmetics. Caption reads: @OFRA Cosmetics, LLC midi palette in [...].](https://images.od.modash.io/706a00f7cb49d42a95267764dbcb7b57a0b79cc3)
![TikTok post by @anjane.xo for OFRA Cosmetics. Caption reads: @OFRA Cosmetics, LLC highlighter in [...].](https://images.od.modash.io/2801da8d8d3417c4d491214732dade96260878e0)
![TikTok post by @anjane.xo for OFRA Cosmetics. Caption reads: [...] Christmas lip combo 💋 @OFRA Cosmetics, LLC....](https://images.od.modash.io/b627c96eca97b6a52cbd4e6180b5c5e63e2b2e66)
💡 Related resource: Long-Term Influencer Partnerships: Pros, Cons & How The Pros Manage Them.
Geographical breakdown
In our dataset, Japan is where OFRA Cosmetics had the most influencer activity. 29% of their live influencer content in the last 12 months was posted by Japanese influencers.
Based on the percentage of influencer content per market, other important markets include:
- United States (28.1%)
- South Korea (10.6%)
- India (4.2%)
OFRA Cosmetics's influencer activity by market
Here is another example of OFRA Cosmetics collaborating with an influencer in Japan.
lucirliv x OFRA Cosmetics
OFRA Cosmetics's influencer activity vs. related brands
OFRA competes with BPerfect Cosmetics and MADE BY MITCHELL in bold, artist-driven color cosmetics, where collabs, creator authority, and viral product moments shape demand.
Total influencer content
OFRA Cosmetics vs. related brands influencer activity
Total sponsored posts tracked (last 12 months)
MADE BY MITCHELL leads with 14.9k sponsored posts, marginally ahead of BPerfect Cosmetics (13.5k posts) and OFRA Cosmetics (1.7k posts). Across all three brands, the average volume is 10k posts, indicating mature, scaled influencer programs. BPerfect Cosmetics and MADE BY MITCHELL have many more total posts than OFRA Cosmetics.
By social platform
OFRA Cosmetics vs. related brands influencer activity (by social platform)
Sponsored posts by platform
OFRA Cosmetics leads on YouTube, while BPerfect Cosmetics has the most activity on Instagram and MADE BY MITCHELL has the most activity on TikTok. The gap is most notable on TikTok, with MADE BY MITCHELL at 13.5k, BPerfect Cosmetics at 11.1k, OFRA Cosmetics at 756 posts. BPerfect Cosmetics's activity is particularly concentrated on TikTok. TikTok posts for BPerfect Cosmetics and MADE BY MITCHELL far exceed both their Instagram counts and OFRA Cosmetics' TikTok count.
By geographical market
OFRA Cosmetics vs. related brands influencer activity (by country)
Estimated sponsored posts in OFRA Cosmetics's top markets
MADE BY MITCHELL has the highest estimated sponsored-post volume in United States (5.4k posts, 36.5%), Nigeria (536 posts, 3.6%), while BPerfect Cosmetics has the highest estimated sponsored-post volume in United Kingdom (5.3k posts, 39%), Ireland (2k posts, 15.2%), suggesting a Europe focus, while OFRA Cosmetics has the highest estimated sponsored-post volume in Japan (489 posts, 29%), South Korea (179 posts, 10.6%), suggesting a Asia focus. Looking at United States specifically, the split is MADE BY MITCHELL at 5.4k posts (36.5%), BPerfect Cosmetics at 2.2k posts (16.3%), OFRA Cosmetics at 473 posts (28.1%). OFRA Cosmetics's strength in Japan may indicate a home-market focus, while BPerfect Cosmetics shows broader regional investment.
Read more influencer strategy breakdowns
Looking for more like this? Here are 5 similar influencer marketing strategy breakdowns for other brands:
- BPerfect Cosmetics's Influencer Marketing Strategy
- MADE BY MITCHELL's Influencer Marketing Strategy
- Tru Fru's Influencer Marketing Strategy
- Unilever's Influencer Marketing Strategy
- Bala's Influencer Marketing Strategy
Or, if you want to access data like this for your own software or processes, take a look at Modash's API products:
Frequently asked questions
Scaling your influencer program?
When you outgrow your mishmash of spreadsheets & free tools, try Modash. Find & email influencers, track campaigns, ship products & more - all in one place.