MADE BY MITCHELL Influencer Marketing Strategy
(2026 Data & Insights)
We analyzed 14.8k pieces of influencer content sponsored by MADE BY MITCHELL over the last 12 months.
This report breaks down where & how MADE BY MITCHELL invests in influencer marketing, which social platforms they prioritize, top geographical markets, and more.
The data in this report comes from Modash's Brand Collaborations API.
P.S. for a simple list of influencers who have collaborated with MADE BY MITCHELL, see here: MADE BY MITCHELL influencers.
Influencer activity throughout the year
MADE BY MITCHELL's influencer campaigns are active year-round with notable month-to-month fluctuation. The chart below shows month-by-month data for total sponsored posts tracked.
MADE BY MITCHELL's influencer activity by month
Number of sponsored posts
MADE BY MITCHELL's influencer output appears relatively consistent throughout the year, averaging about 1.2k sponsored posts per month. March recorded the highest volume at 1.5k posts (25% above average), while September was the quietest at 949 posts.
Social platforms breakdown
In our dataset (which only includes Instagram, YouTube, and TikTok), this is how the volume of MADE BY MITCHELL's sponsored influencer collaborations break down by social platform:
- TikTok: 13.4k posts (90.6%)
- Instagram: 1.4k posts (9.4%)
MADE BY MITCHELL's influencer activity by platform
Share of sponsored content by social network
TikTok influencer marketing is a clear focus for MADE BY MITCHELL.
Here are 2 examples of MADE BY MITCHELL's recent sponsored collaborations (one each for Instagram, TikTok).
mmmmitchell x MADE BY MITCHELL
![Instagram post by @mmmmitchell for MADE BY MITCHELL. Caption reads: [...] SQUAREPANTS IS HERE… 🧽🌊✨🥵 #madebymitchell....](https://images.od.modash.io/7e6bf0fa0247ac2d255ac373a2320cef9fe6cef8)
Influencer bio
☆ founder & creative director @madebymitchell ☆ ☆ visionary, artist, free spirit & lover ☆ ☆ mitchell@outshinetalent.com ☆
Collaboration metrics
Get a free trial to find more data on influencer audiences, performance, and collaborations.
michaelpeacockbackup x MADE BY MITCHELL
Influencer bio
TT Shop Best Finds 🙌🏽
Collaboration metrics
Get a free trial to find more data on influencer audiences, performance, and collaborations.
If you break this down further by content type on TikTok, this is what it looks like:
- Videos: 98.8%
- Carousels: 1.2%
💡 Related resource: How To Find TikTok Influencers.
Influencer audience size breakdown (by views)
For their top social platform (TikTok), here is a breakdown of the type of influencers MADE BY MITCHELL are collaborating with, by audience size.
Note: this breakdown is based on each influencer's average views (not follower/subscriber count), because views typically correlate more closely with influencer pricing and impact.
MADE BY MITCHELL's influencers average views (TikTok)
Based on each influencer's average views per post
With 43.8% of partnerships featuring creators averaging <1K views, MADE BY MITCHELL's strategy suggests niche targeting and authenticity, likely leveraging collaboration models like gifting and affiliates to work with smaller creators.
Here is an example of a sponsored collaboration with a larger-audience creator on TikTok (1.2M avg views/post):
le0nild4 x MADE BY MITCHELL
![TikTok post by @le0nild4 for MADE BY MITCHELL. Caption reads: [...] my most frequently asked uses....](https://images.od.modash.io/5dcaac52efaabf5c63cb04149c96c61579835e23)
Influencer bio
🇦🇴22🇵🇹 📍LDN A safe space for girlies with acne prone skin 💫 Founder of: @thelovergirl.archives
Collaboration metrics
Get a free trial to find more data on influencer audiences, performance, and collaborations.
And here is another example with a smaller creator on TikTok (9.6k avg views/post):
jazlmao x MADE BY MITCHELL
![TikTok post by @jazlmao for MADE BY MITCHELL. Caption reads: [...] It feels so therapeutic! Using....](https://images.od.modash.io/1d61dddfb206e25025124576ae2bae0ac44d92b5)
Influencer bio
SF ✨ UBC ✨filipina 🇵🇭 💌 jazlmao@palettemgmt.com 💌
Collaboration metrics
Get a free trial to find more data on influencer audiences, performance, and collaborations.
MADE BY MITCHELL's repeat partnerships
Out of 4.8k unique influencers in our dataset, 561 of them (12%) posted content for MADE BY MITCHELL in 3 or more separate calendar months. The most consistent partner is @errinfetter, who has collaborated across 12 months with 131 total posts.
Here are 3 examples of MADE BY MITCHELL's repeat influencer partnerships, with links to the sponsored content.
errinfetter x MADE BY MITCHELL
![TikTok post by @errinfettermua for MADE BY MITCHELL. Caption reads: [...] your skin but better @🇬🇧MADEBYMITCHELL🇬🇧....](https://images.od.modash.io/a88fca181ded46dff8dcf0317445063c05eb6ec0)
![TikTok post by @errinfettermua for MADE BY MITCHELL. Caption reads: Made by Mitchell build foundation is [...].](https://images.od.modash.io/11a134f284ae70651aadc82979d44f2edd08db7e)
![TikTok post by @errinfettermua for MADE BY MITCHELL. Caption reads: [...] powder away from me! @🇬🇧MADEBYMITCHELL🇬🇧....](https://images.od.modash.io/a13d69f9c4806135b6cb10a2ca292bf205bf94ca)
mmmmitchell x MADE BY MITCHELL
![Instagram post by @mmmmitchell for MADE BY MITCHELL. Caption reads: [...] 🗣️ bronzer 🗣️ feat. @madebymitchell and....](https://images.od.modash.io/a9a4db6d5a9863f14c77f220676eaf3dd280d7bb)
![Instagram post by @mmmmitchell for MADE BY MITCHELL. Caption reads: [...] ALLLLLL OVER. 😜💅🏼💋 @madebymitchell just....](https://images.od.modash.io/40f0ba6277ea63f5ae5ab8d261e06ec804bffd78)
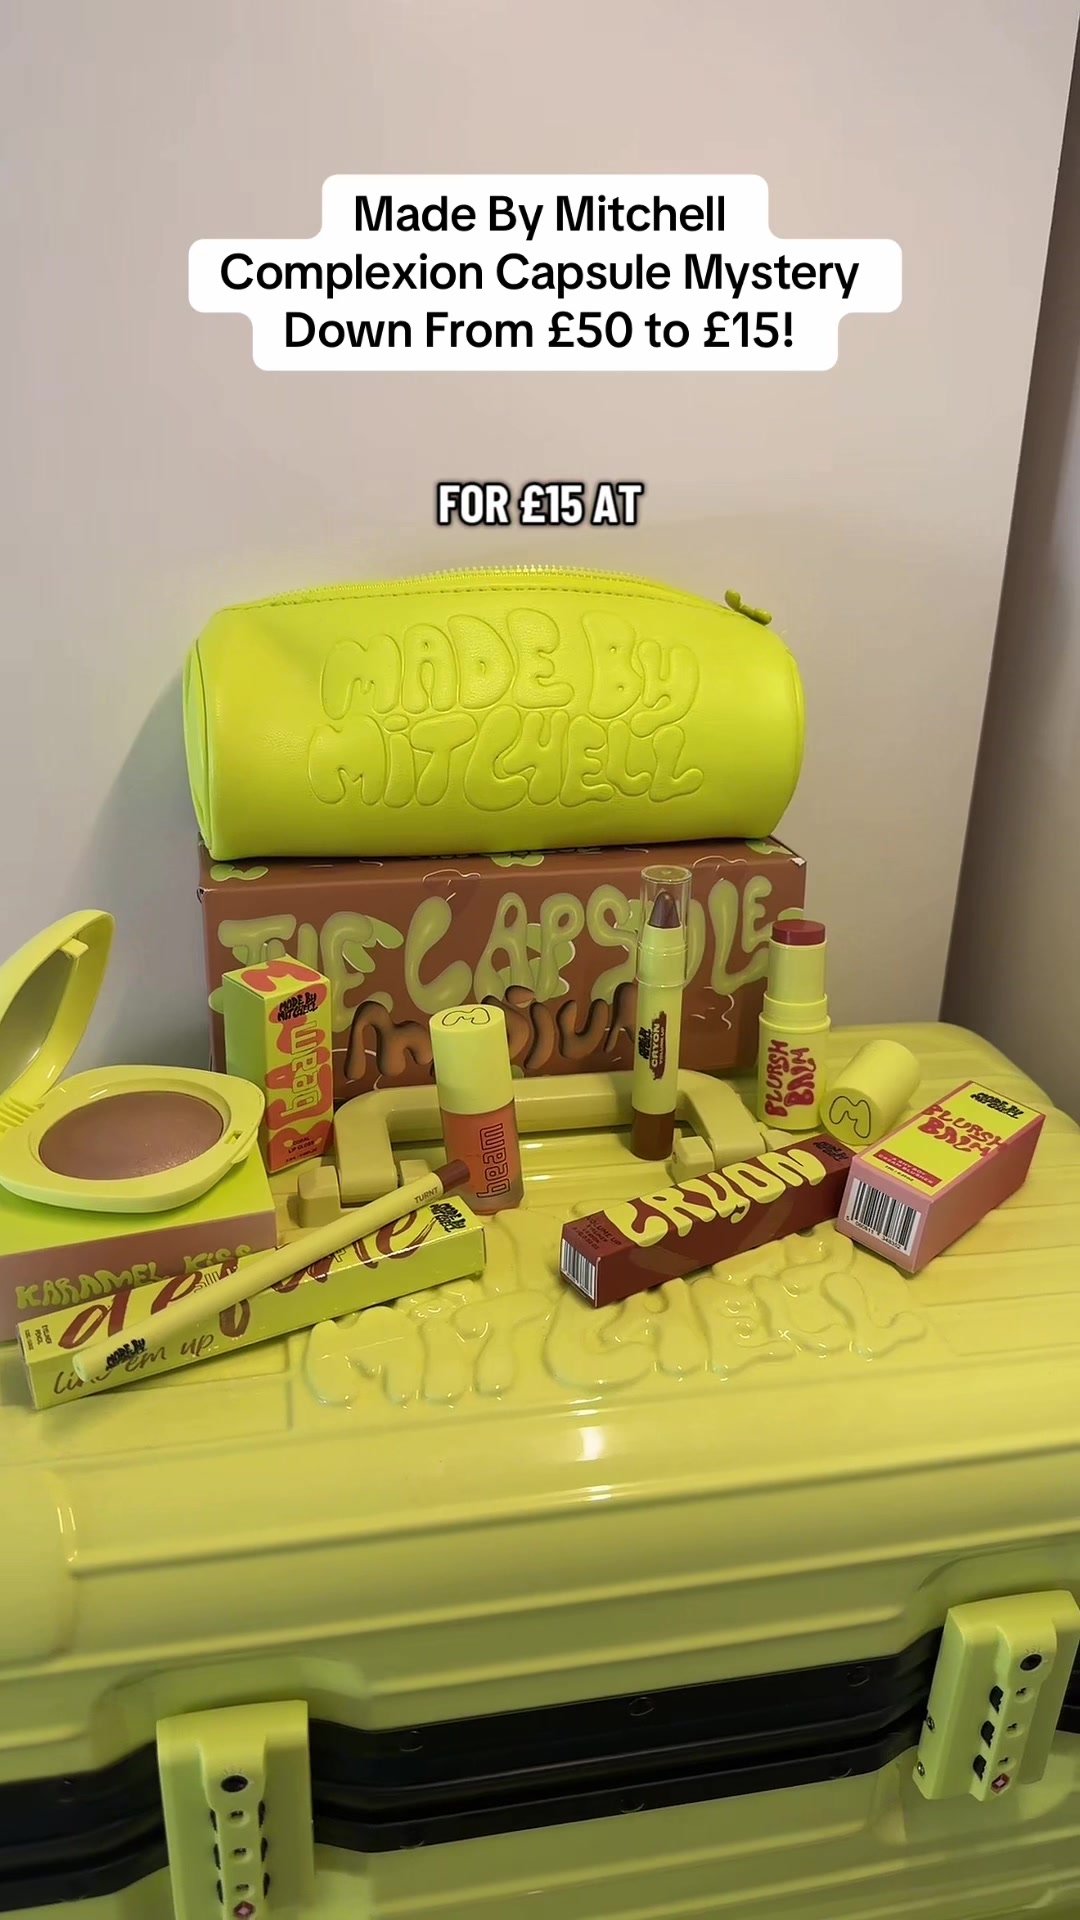
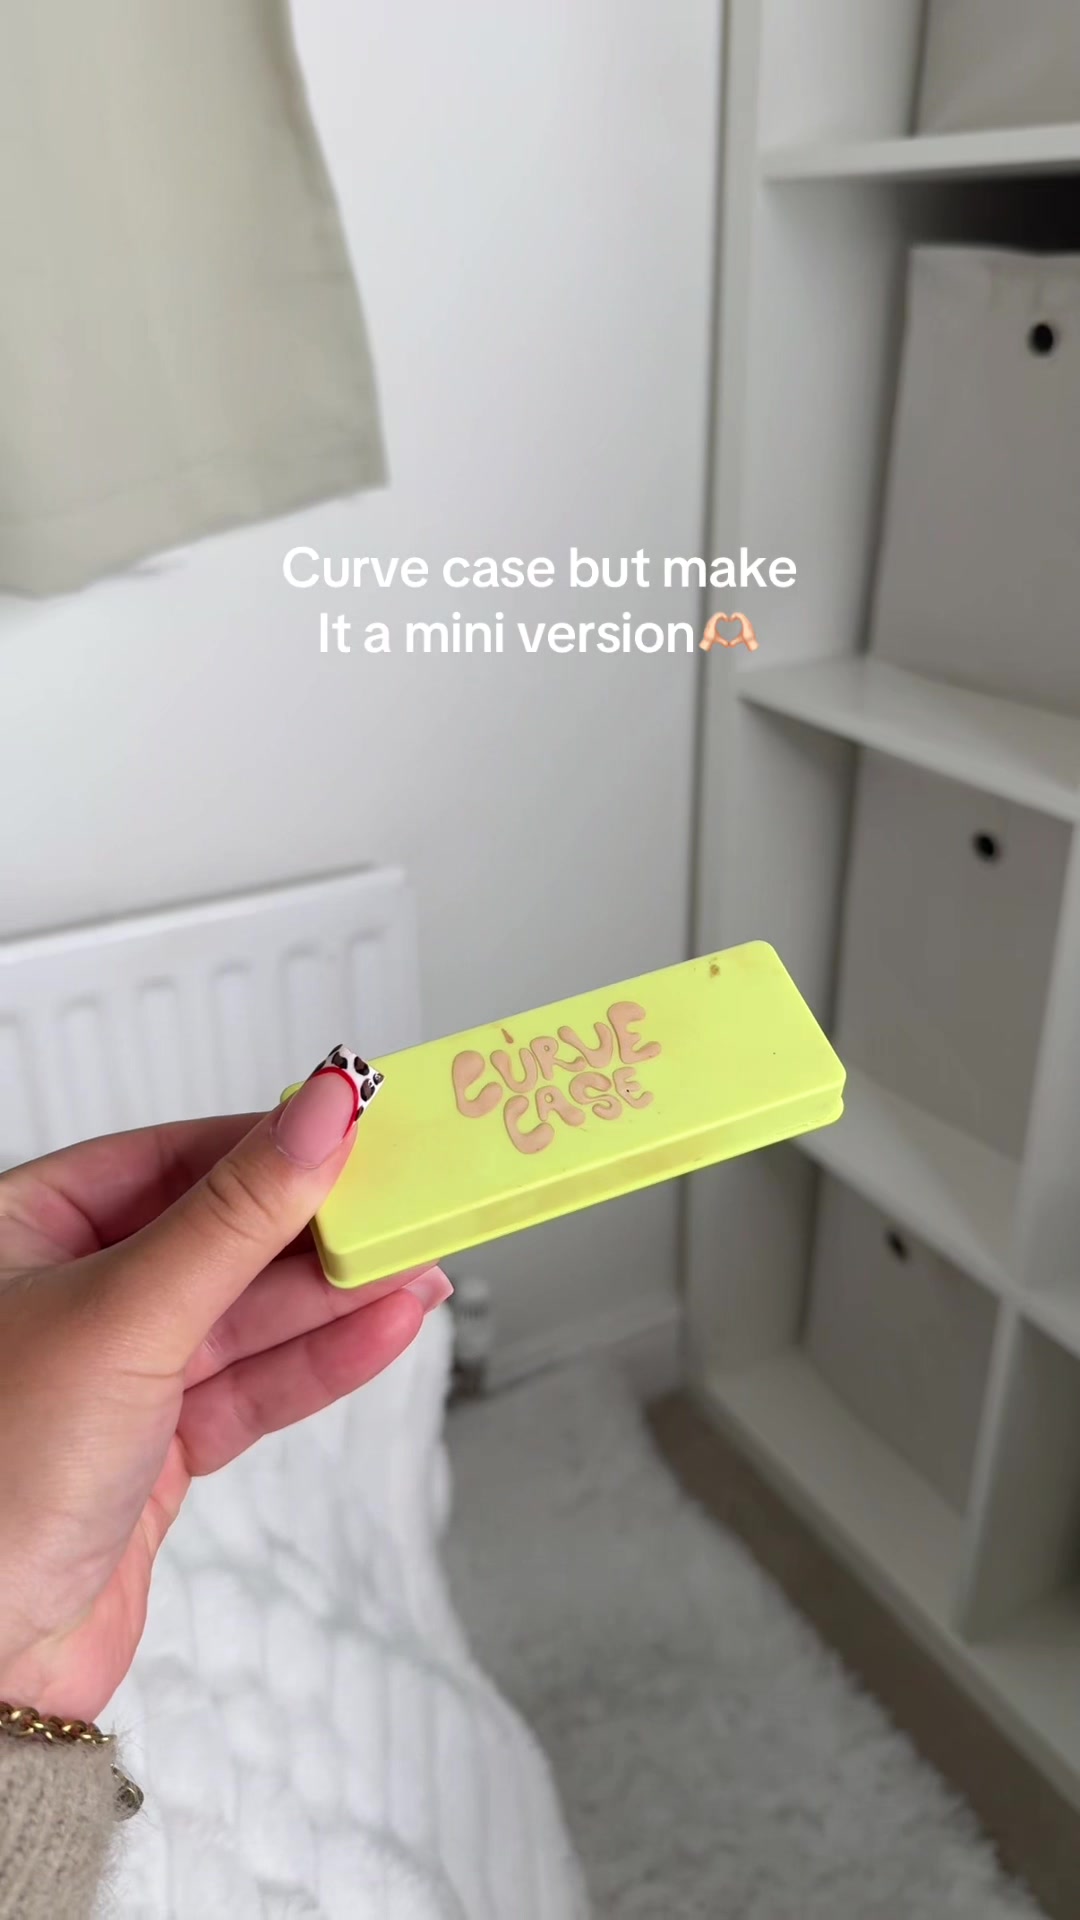
nicdrane x MADE BY MITCHELL
![TikTok post by @nicdrane for MADE BY MITCHELL. Caption reads: [...] And so multiuse too! @🇬🇧MADEBYMITCHELL🇬🇧....](https://images.od.modash.io/a144bf6d1dc6adc882ff4219649b9bf00e99092e)
![TikTok post by @nicdrane for MADE BY MITCHELL. Caption reads: [...] £20 for 5 items from @🇬🇧MADEBYMITCHELL🇬🇧....](https://images.od.modash.io/4ed00b38534fc0b883e8cc091d27b00ff58b9d5e)
![TikTok post by @nicdrane for MADE BY MITCHELL. Caption reads: [...] Goo! Don’t miss out!!....](https://images.od.modash.io/c8120238d09651bdcb27af00c950afd52a50eeff)
💡 Related resource: Long-Term Influencer Partnerships: Pros, Cons & How The Pros Manage Them.
Geographical breakdown
In our dataset, United States is where MADE BY MITCHELL had the most influencer activity. 41.1% of their live influencer content in the last 12 months was posted by American influencers.
Based on the percentage of influencer content per market, other important markets include:
- United Kingdom (28.7%)
- Brazil (5.2%)
- Australia (4.2%)
MADE BY MITCHELL's influencer activity by market
Here is another example of MADE BY MITCHELL collaborating with an influencer in United Kingdom.
shinyefinds x MADE BY MITCHELL
MADE BY MITCHELL's influencer activity vs. related brands
MADE BY MITCHELL, BPerfect Cosmetics, and OFRA Cosmetics all compete in highly pigmented, artist-loved makeup that thrives on bold tutorials and creator demonstrations. Their audiences overlap around technique-driven content, viral shades, and performance-focused product reviews.
Total influencer content
MADE BY MITCHELL vs. related brands influencer activity
Total sponsored posts tracked (last 12 months)
MADE BY MITCHELL leads with 14.8k sponsored posts, marginally ahead of BPerfect Cosmetics (13.5k posts) and OFRA Cosmetics (1.7k posts). Across all three brands, the average volume is 10k posts, indicating mature, scaled influencer programs.
By social platform
MADE BY MITCHELL vs. related brands influencer activity (by social platform)
Sponsored posts by platform
MADE BY MITCHELL leads on TikTok, while BPerfect Cosmetics has the most activity on Instagram and OFRA Cosmetics has the most activity on YouTube. The gap is most notable on TikTok, with MADE BY MITCHELL at 13.4k, BPerfect Cosmetics at 11.1k, OFRA Cosmetics at 756 posts. MADE BY MITCHELL's activity is particularly concentrated on TikTok. TikTok drives most of MADE BY MITCHELL’s posts, with far fewer on Instagram and none on YouTube.
By geographical market
MADE BY MITCHELL vs. related brands influencer activity (by country)
Estimated sponsored posts in MADE BY MITCHELL's top markets
MADE BY MITCHELL has the highest estimated sponsored-post volume in United States (6.1k posts, 41.1%), Brazil (771 posts, 5.2%), while BPerfect Cosmetics has the highest estimated sponsored-post volume in United Kingdom (5.3k posts, 39%), Ireland (2k posts, 15.2%), suggesting a Europe focus, while OFRA Cosmetics has the highest estimated sponsored-post volume in Japan (489 posts, 29%), South Korea (179 posts, 10.6%), suggesting a Asia focus. Looking at United States specifically, the split is MADE BY MITCHELL at 6.1k posts (41.1%), BPerfect Cosmetics at 2.2k posts (16.3%), OFRA Cosmetics at 473 posts (28.1%). MADE BY MITCHELL's strength in United States may indicate a home-market focus, while BPerfect Cosmetics shows broader regional investment.
Read more influencer strategy breakdowns
Looking for more like this? Here are 5 similar influencer marketing strategy breakdowns for other brands:
- BPerfect Cosmetics's Influencer Marketing Strategy
- OFRA Cosmetics's Influencer Marketing Strategy
- Selkie's Influencer Marketing Strategy
- Tubby Todd's Influencer Marketing Strategy
- Poppi's Influencer Marketing Strategy
Or, if you want to access data like this for your own software or processes, take a look at Modash's API products:
Frequently asked questions
Scaling your influencer program?
When you outgrow your mishmash of spreadsheets & free tools, try Modash. Find & email influencers, track campaigns, ship products & more - all in one place.