Unilever Influencer Marketing Strategy
(2026 Data & Insights)
We analyzed 2.0k pieces of influencer content sponsored by Unilever over the last 12 months.
This report breaks down where & how Unilever invests in influencer marketing, which social platforms they prioritize, top geographical markets, and more.
The data in this report comes from Modash's Brand Collaborations API.
P.S. for a simple list of influencers who have collaborated with Unilever, see here: Unilever influencers.
Influencer activity throughout the year
Unilever's influencer campaigns are active year-round with notable month-to-month fluctuation. The chart below shows month-by-month data for total sponsored posts tracked.
Unilever's influencer activity by month
Number of sponsored posts
Unilever's sponsored post volume appears to trend upward over the 12-month period, rising from 127 posts in January to 127 in December. The peak month, October, reached 529 posts, 221% higher than the monthly average of 165.
Social platforms breakdown
In our dataset (which only includes Instagram, YouTube, and TikTok), this is how the volume of Unilever's sponsored influencer collaborations break down by social platform:
- Instagram: 1.4k posts (69.9%)
- TikTok: 597 posts (30.1%)
Unilever's influencer activity by platform
Share of sponsored content by social network
Instagram influencer marketing is a clear focus for Unilever.
Here are 2 examples of Unilever's recent sponsored collaborations (one each for Instagram, TikTok).
danyaelll x Unilever
![Instagram post by @danyaelll for Unilever. Caption reads: [...] #VaselinePhilippines @vaselineph....](https://images.od.modash.io/7782c00bbb50b1210d0d13fd0d035fac8b0bbb83)
Influencer bio
💁🏻♂️ Hybrid Athlete | 2x HYROXer | Sustainable Fashion | Solo-Living 🤳 I vlog a lot on Tiktok 243K 📩 for inquiries/work 👉🏻 ianxyael@gmail.com
Collaboration metrics
Get a free trial to find more data on influencer audiences, performance, and collaborations.
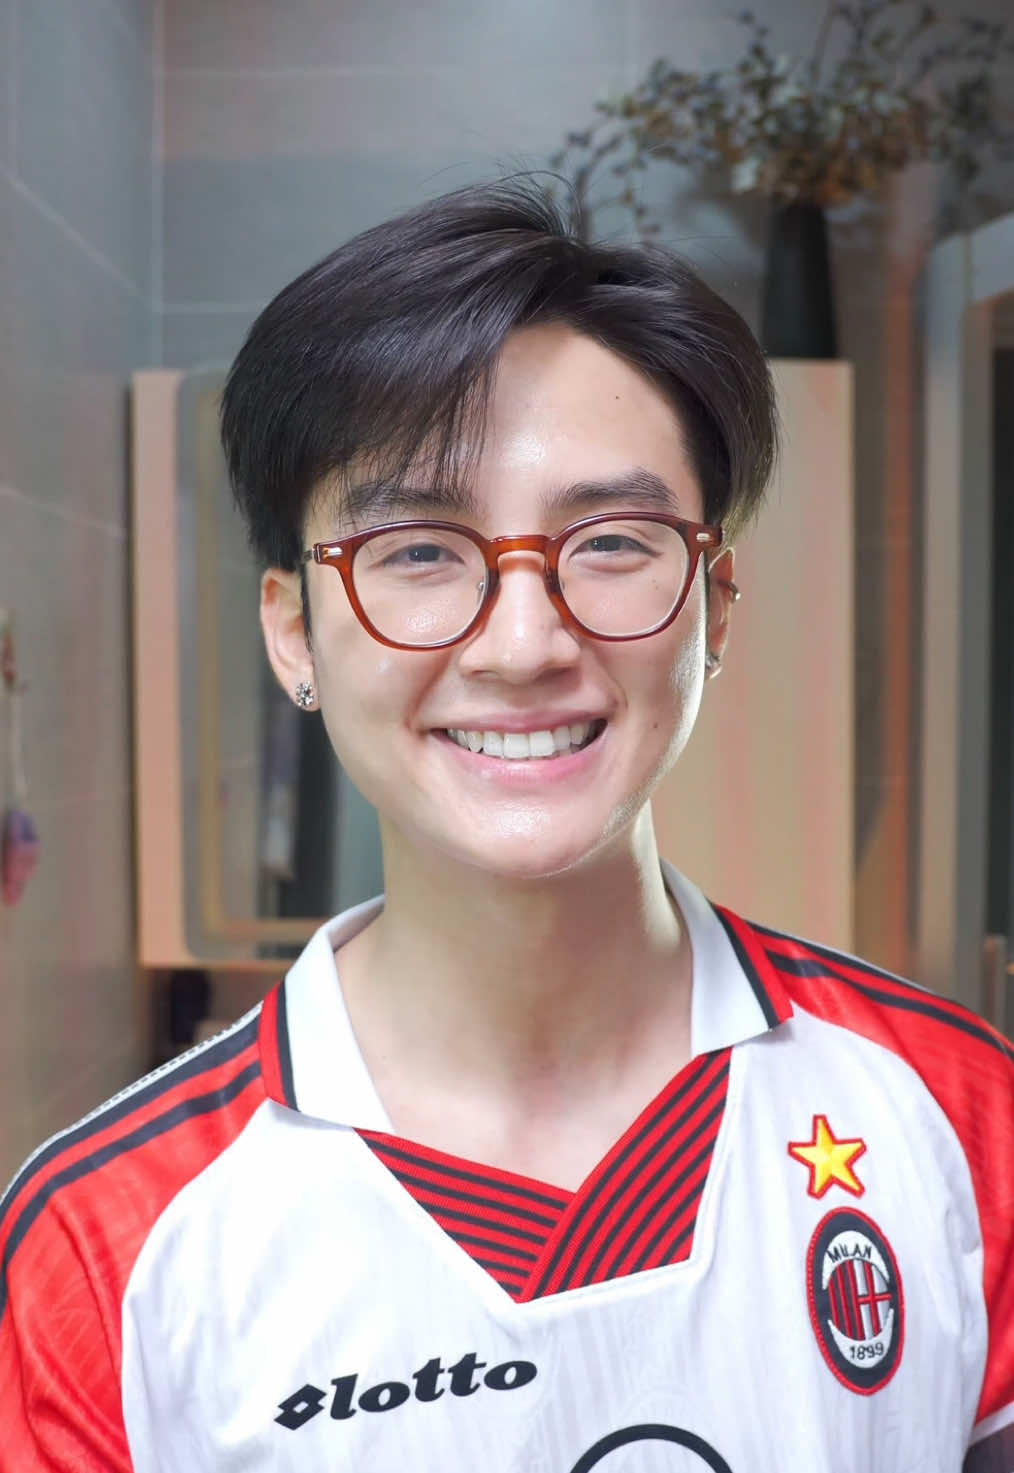
darrelespinar x Unilever
![TikTok post by @darrelespinar for Unilever. Caption reads: [...] my yellow basket. Try it now! @@AXE....](https://images.od.modash.io/d1d380869bfa78fdabc99bb7e639407b35325db7)
Influencer bio
Gymrat•Runner•Engineering Student🏹 Outwork yesterday espinardarrel@gmail.com📩
Collaboration metrics
Get a free trial to find more data on influencer audiences, performance, and collaborations.
If you break this down further by content type on Instagram, this is what it looks like:
- Reels: 78%
- Posts: 22%
💡 Related resource: How To Find Instagram Influencers.
Influencer audience size breakdown (by views)
For their top social platform (Instagram), here is a breakdown of the type of influencers Unilever are collaborating with, by audience size.
Note: this breakdown is based on each influencer's average views (not follower/subscriber count), because views typically correlate more closely with influencer pricing and impact.
Unilever's influencers average views (Instagram)
Based on each influencer's average views per post
With 29.3% of partnerships featuring creators averaging 10K-50K views, Unilever's strategy suggests cost-efficiency and engagement-focused partnerships. The 1K-5K views segment is also prominent at 21.4%, indicating investment across adjacent tiers.
Here is an example of a sponsored collaboration with a larger-audience creator on Instagram (579.3k avg views/post):
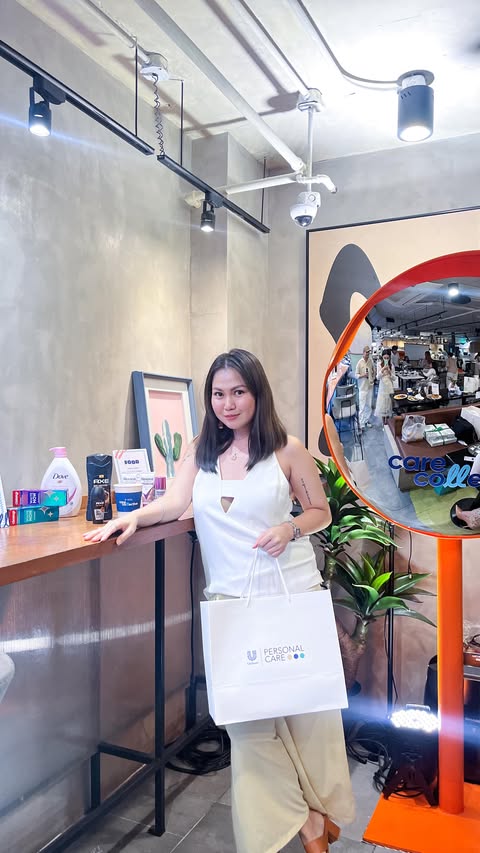
abbytabladillo x Unilever
![Instagram post by @abbytabladillo for Unilever. Caption reads: [...] deserves to radiate. 💖 @vaselineph....](https://images.od.modash.io/d0cc4749c7627b004b7f1071eba1377bca54d252)
Influencer bio
🧑🧑🧒#MomOf3Boys 👰♀️Wife to @henz0me 🤳Lifestyle|Fashion|Beauty|Mom|Travel|Food|Tech 📧abbydora.tabladillo@gmail.com Tiktok: 63.4k followers
Collaboration metrics
Get a free trial to find more data on influencer audiences, performance, and collaborations.
And here is another example with a smaller creator on Instagram (9.8k avg views/post):
thejamiecasino x Unilever
![Instagram post by @thejamiecasino for Unilever. Caption reads: [...] for a kickoff dinner with @creamsilkph....](https://images.od.modash.io/ae04bdc33aba3917a5b8b1aec4fe0a949e6825d2)
Influencer bio
Your Transpiration🏳️⚧️ on TikTok(690K|42M) Model & Content Creator+Public Speaker mom to @barbiethecorgi @mikisevenhayley 💌thejamiecasino@gmail.com
Collaboration metrics
Get a free trial to find more data on influencer audiences, performance, and collaborations.
Unilever's repeat partnerships
Out of 1.5k unique influencers in our dataset, 22 of them (1%) posted content for Unilever in 3 or more separate calendar months. The most consistent partner is @naky.nhatky, who has collaborated across 5 months with 10 total posts.
Here are 3 examples of Unilever's repeat influencer partnerships, with links to the sponsored content.
naky.nhatky x Unilever
![TikTok post by @naky.nhatky for Unilever. Caption reads: [...] yêu thương dần đang đến với @Unilever - Chăm....](https://images.od.modash.io/d8e8e30649807e7fc6115ff0c07af520daca01c3)

hanniwander x Unilever
![Instagram post by @hanniwander for Unilever. Caption reads: [...] #DoveDeo #DovePH #UnileverPersonalCare [...].](https://images.od.modash.io/63c9638e71cc986da9a566c86cfb1af91aa11395)
![Instagram post by @hanniwander for Unilever. Caption reads: [...] I got to join the first ever Unilever....](https://images.od.modash.io/8de4bde3a3efa2d9f2e68827c6341e0d0846f7fe)
allexpslm x Unilever
![Instagram post by @allexpslm for Unilever. Caption reads: [...] this Mega Holiday Sale 🛒....](https://images.od.modash.io/04048a8a6af407cf9982a8c992c79941c0fc3d62)
![Instagram post by @allexpslm for Unilever. Caption reads: @unileverphilippines Personal Care [...].](https://images.od.modash.io/b02086af111ceefa6a9ebd6b6da847c2767f13f6)
![Instagram post by @allexpslm for Unilever. Caption reads: [...] my tuesday morning with my....](https://images.od.modash.io/155bc8a6dd28c21f4a31776e231c4607860e4ad7)
💡 Related resource: Long-Term Influencer Partnerships: Pros, Cons & How The Pros Manage Them.
Geographical breakdown
In our dataset, India is where Unilever had the most influencer activity. 22.4% of their live influencer content in the last 12 months was posted by Indian influencers.
Based on the percentage of influencer content per market, other important markets include:
- Philippines (21.6%)
- United States (11.4%)
- Indonesia (8.7%)
Unilever's influencer activity by market
Here is another example of Unilever collaborating with an influencer in Philippines.
kennethchann x Unilever
![TikTok post by @kennethchann for Unilever. Caption reads: [...] it out on my yellow basket! @AXE PH....](https://images.od.modash.io/66673590c8737596fbedfdefff21051252cb1b19)
Unilever's influencer activity vs. related brands
Unilever spans mass beauty and personal care where influencer marketing is used to drive scale across hero products. Revlon and COVERGIRL are comparable large, mass-market beauty players and good benchmarks for always-on creator and retail-driven campaigns.
Total influencer content
Unilever vs. related brands influencer activity
Total sponsored posts tracked (last 12 months)
COVERGIRL leads with 14.8k sponsored posts, significantly outpacing Revlon (10.9k posts) and Unilever (2k posts). Across all three brands, the average volume is 9.2k posts, indicating mature, scaled influencer programs. Revlon and COVERGIRL each have multiple times more total posts than Unilever.
By social platform
Unilever vs. related brands influencer activity (by social platform)
Sponsored posts by platform
Among these brands, Revlon leads on Instagram and COVERGIRL leads on TikTok and YouTube. The gap is most notable on TikTok, with COVERGIRL at 11.7k, Revlon at 5.6k, Unilever at 597 posts. COVERGIRL's activity is particularly concentrated on TikTok. On TikTok, COVERGIRL has multiple times more posts than both Revlon and Unilever.
By geographical market
Unilever vs. related brands influencer activity (by country)
Estimated sponsored posts in Unilever's top markets
COVERGIRL has the highest estimated sponsored-post volume in United States (9.9k posts, 66.7%), Canada (798 posts, 5.4%), United Kingdom (650 posts, 4.4%), suggesting a North America focus, while Revlon has the highest estimated sponsored-post volume in Japan (1.7k posts, 15.5%), India (1.2k posts, 10.6%), suggesting a Asia focus, while Unilever leads in Philippines with 429 posts (21.6%). Looking at United States specifically, the split is COVERGIRL at 9.9k posts (66.7%), Revlon at 2.6k posts (24.2%), Unilever at 226 posts (11.4%).
Read more influencer strategy breakdowns
Looking for more like this? Here are 5 similar influencer marketing strategy breakdowns for other brands:
- Revlon's Influencer Marketing Strategy
- COVERGIRL's Influencer Marketing Strategy
- Medicube's Influencer Marketing Strategy
- OneSkin's Influencer Marketing Strategy
- Blank Street's Influencer Marketing Strategy
Or, if you want to access data like this for your own software or processes, take a look at Modash's API products:
Frequently asked questions
Scaling your influencer program?
When you outgrow your mishmash of spreadsheets & free tools, try Modash. Find & email influencers, track campaigns, ship products & more - all in one place.