Ohuhu Influencer Marketing Strategy
(2026 Data & Insights)
We analyzed 6.1k pieces of influencer content sponsored by Ohuhu over the last 12 months.
This report breaks down where & how Ohuhu invests in influencer marketing, which social platforms they prioritize, top geographical markets, and more.
The data in this report comes from Modash's Brand Collaborations API.
P.S. for a simple list of influencers who have collaborated with Ohuhu, see here: Ohuhu influencers.
Influencer activity throughout the year
Ohuhu's influencer campaigns are active year-round with notable month-to-month fluctuation. The chart below shows month-by-month data for total sponsored posts tracked.
Ohuhu's influencer activity by month
Number of sponsored posts
Ohuhu's sponsored post volume peaks in December with 800 posts, 57% higher than the monthly average of 509. June recorded the lowest activity at 278 posts, 45% below average.
Social platforms breakdown
In our dataset (which only includes Instagram, YouTube, and TikTok), this is how the volume of Ohuhu's sponsored influencer collaborations break down by social platform:
- TikTok: 4.7k posts (76.7%)
- YouTube: 1.4k posts (23.3%)
Ohuhu's influencer activity by platform
Share of sponsored content by social network
TikTok influencer marketing is a clear focus for Ohuhu.
Here are 2 examples of Ohuhu's recent sponsored collaborations (one each for TikTok, YouTube).
mireyacolors x Ohuhu
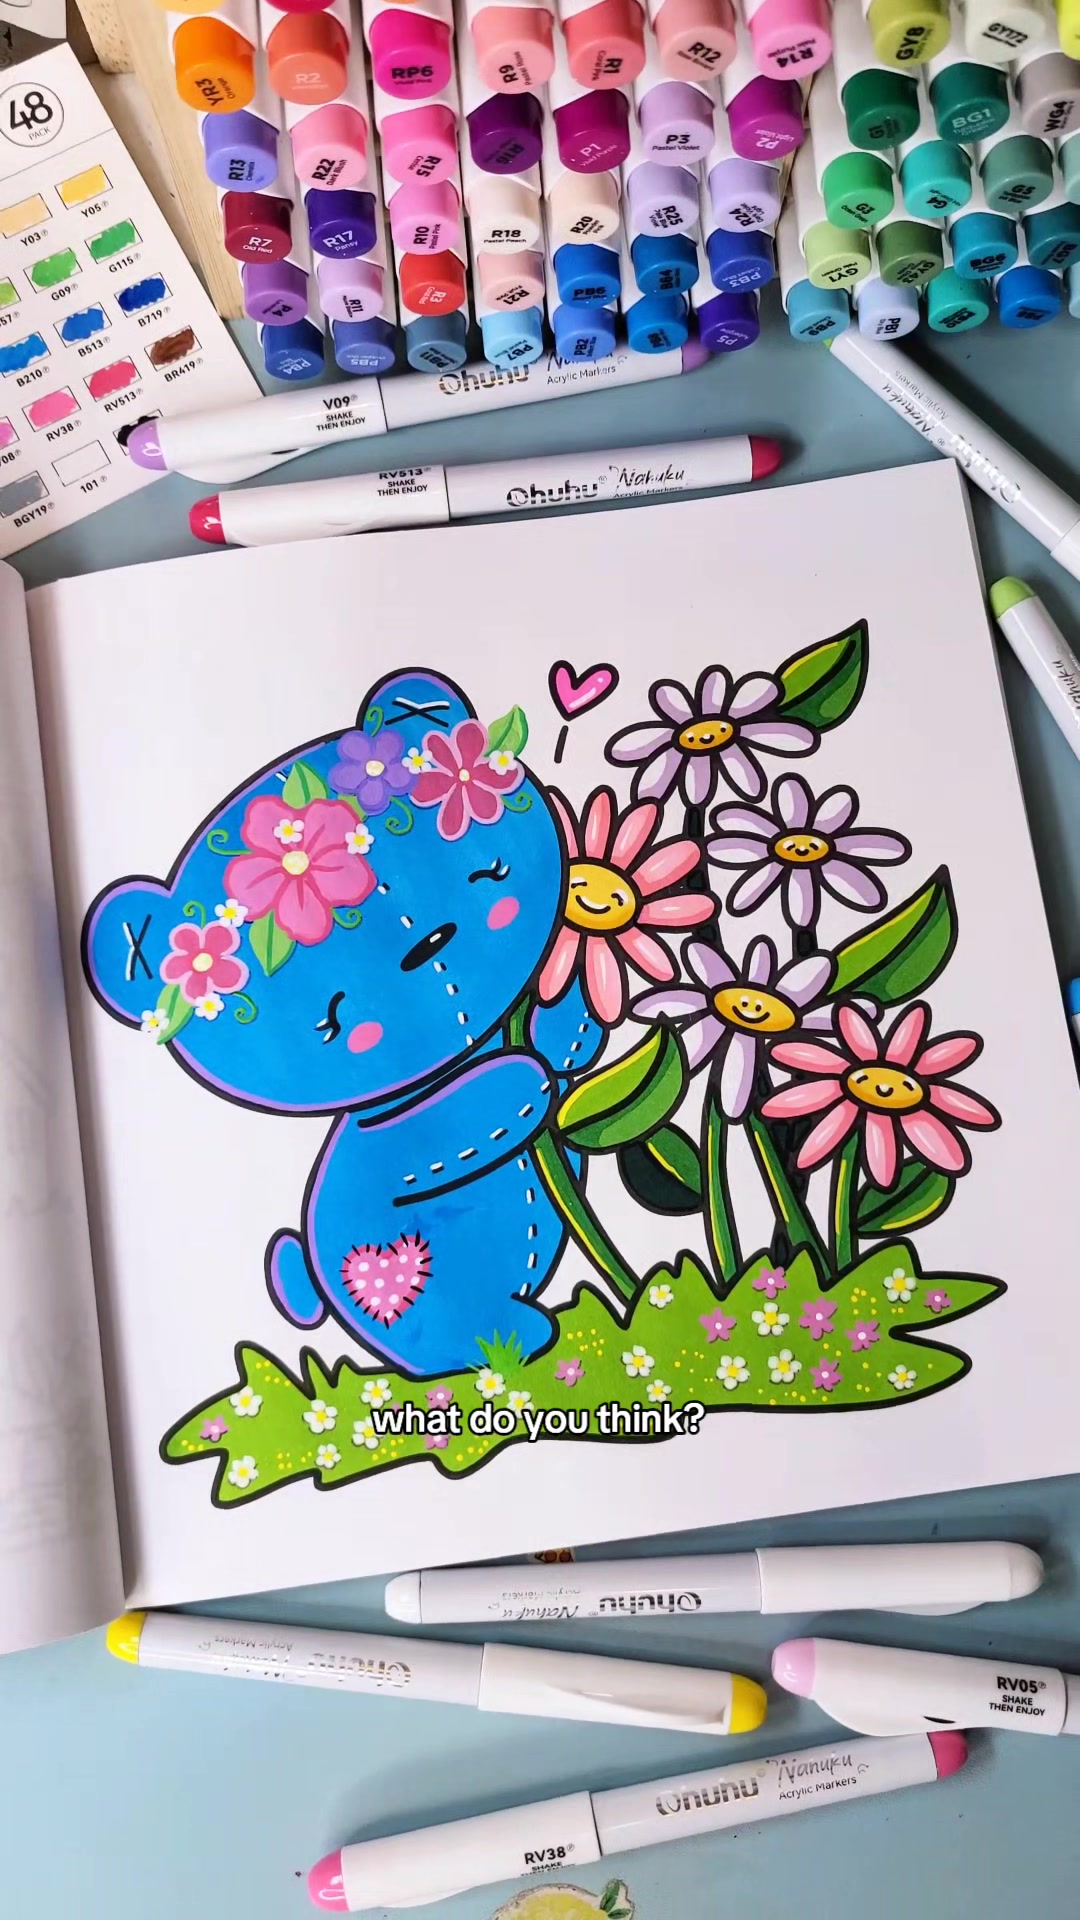
Influencer bio
Coloring book techniques, Disney mashups, arts and crafts, cozy hobbies. What I use 👇
Collaboration metrics
Get a free trial to find more data on influencer audiences, performance, and collaborations.
FunnSkill1 x Ohuhu
![YouTube post by @FunnSkill1 for Ohuhu. Caption reads: [...] pencils ✨Mont marte skin tone colours ✨Ohuhu....](https://images.od.modash.io/739185b2318e8cfb154b74694c9a98c827939601)
Influencer bio
😀Welcome to my channel😀!!!! I do art and other stuff🎇........ 🌟 realism artist 🌟 she/her 🌟 self-taught (learned basics from mother) 🌟 my lil sister also does art on this channel 🌟 I upload one or two times a week (Tuesday, Friday or Saturday) For more content, make sure to subscribe to my channel🔔💖. If it takes more time🕐 for me to upload my video, be sure to know that I am giving my best efforts in the making and editing of my video😃. For business contact me on Gmail funnskill1@gmail.com Thank you for viewing my channel😊!!!
Collaboration metrics
Get a free trial to find more data on influencer audiences, performance, and collaborations.
If you break this down further by content type on TikTok, this is what it looks like:
- Videos: 94.3%
- Carousels: 5.7%
💡 Related resource: How To Find TikTok Influencers.
Influencer audience size breakdown (by views)
For their top social platform (TikTok), here is a breakdown of the type of influencers Ohuhu are collaborating with, by audience size.
Note: this breakdown is based on each influencer's average views (not follower/subscriber count), because views typically correlate more closely with influencer pricing and impact.
Ohuhu's influencers average views (TikTok)
Based on each influencer's average views per post
With 35.5% of partnerships featuring creators averaging 1K-5K views, Ohuhu's strategy suggests niche targeting and authenticity, likely leveraging collaboration models like gifting and affiliates to work with smaller creators.
Here is an example of a sponsored collaboration with a larger-audience creator on TikTok (1.3M avg views/post):
relajarteconarte x Ohuhu
Influencer bio
Bienvenidx a mi espacio seguro ✨🖍️💖 Vamos a crear juntos (colabs) ⬇️ relajarteconartee@gmail.com
Collaboration metrics
Get a free trial to find more data on influencer audiences, performance, and collaborations.
And here is another example with a smaller creator on TikTok (10.0k avg views/post):
maddybellcolors x Ohuhu

Influencer bio
Here to romanticize your markers....and mine 🖍️ tutorials•coloring sessions•coloring inspo 💌 maddybellcolors@gmail.com
Collaboration metrics
Get a free trial to find more data on influencer audiences, performance, and collaborations.
Ohuhu's repeat partnerships
Out of 1.8k unique influencers in our dataset, 256 of them (14%) posted content for Ohuhu in 3 or more separate calendar months. The most consistent partner is @MyColourfulCountryLife, who has collaborated across 12 months with 112 total posts.
Here are 3 examples of Ohuhu's repeat influencer partnerships, with links to the sponsored content.
MyColourfulCountryLife x Ohuhu
![YouTube post by @MyColourfulCountryLife for Ohuhu. Caption reads: 🎨 OHUHU HALAWA vs POLYCHROMOS – [...].](https://images.od.modash.io/a80d0b895107520126d22a5a13407833978348c2)
![YouTube post by @MyColourfulCountryLife for Ohuhu. Caption reads: [...] with code COUNTRYLIFE20 • Ohuhu - 10% off....](https://images.od.modash.io/feb2a6383b6c66b7d19093e589bac39baf5a9c7f)
![YouTube post by @MyColourfulCountryLife for Ohuhu. Caption reads: Are Ohuhu’s new Soft Chisel Tip Markers [...].](https://images.od.modash.io/406f1c8d563cb4872545bbe6005db0513abe3bea)
cozyartbymik x Ohuhu
![TikTok post by @cozyartbymik for Ohuhu. Caption reads: [...] My absolute favorite!!! 🤩💖 @Ohuhuart....](https://images.od.modash.io/7d4084f67972f9f7fd52d87d0d9ae275bf8b34cd)
![TikTok post by @cozyartbymik for Ohuhu. Caption reads: [...] kitty page 🤭💖 @Hikaru Kotz @Ohuhuart....](https://images.od.modash.io/bb32329ea25c96afd4a16662289f592da6ac9db6)
![TikTok post by @cozyartbymik for Ohuhu. Caption reads: [...] @Vivi Tinta Coloring Book @Ohuhuart #ohuhu....](https://images.od.modash.io/c385dc988559abb12f941d54a391a68155034f9d)
KwikDraw35 x Ohuhu
![YouTube post by @KwikDraw35 for Ohuhu. Caption reads: [...] #art #twitch #twitchstreamer OHUHU Markers....](https://images.od.modash.io/bc6a8a680f4e29335ba91255ca70197289a926ca)
![YouTube post by @KwikDraw35 for Ohuhu. Caption reads: [...] #nba #nbafinals #arttutorial OHUHU Markers....](https://images.od.modash.io/39caecb4eae3e38e780f621b818d1d9a4e0bfc7c)
![YouTube post by @KwikDraw35 for Ohuhu. Caption reads: [...] fineliners! #art #drawing OHUHU Markers 🎨....](https://images.od.modash.io/a30ecaef3c3f944f13a9727a7b2cb7fbd585fb0f)
💡 Related resource: Long-Term Influencer Partnerships: Pros, Cons & How The Pros Manage Them.
Geographical breakdown
In our dataset, United States is where Ohuhu had the most influencer activity. 34.7% of their live influencer content in the last 12 months was posted by American influencers.
Based on the percentage of influencer content per market, other important markets include:
- India (10.4%)
- Brazil (10.1%)
- United Kingdom (5.5%)
Ohuhu's influencer activity by market
Here is another example of Ohuhu collaborating with an influencer in United States.
KwikDraw35 x Ohuhu
Ohuhu's influencer activity vs. related brands
Ohuhu targets the creator and hobbyist audience with art supplies, which overlaps with Vograce’s maker/artist community and Polaroid’s creator-driven visual culture—each competing for similar social discovery and UGC.
Total influencer content
Ohuhu vs. related brands influencer activity
Total sponsored posts tracked (last 12 months)
Ohuhu leads with 6.1k sponsored posts, significantly outpacing Vograce (1.2k posts) and Polaroid (796 posts). Across all three brands, the average volume is 2.7k posts, indicating mature, scaled influencer programs. Ohuhu has multiple times more total posts than Vograce and Polaroid.
By social platform
Ohuhu vs. related brands influencer activity (by social platform)
Sponsored posts by platform
Ohuhu leads on TikTok and YouTube, while Vograce leads on Instagram. The gap is most notable on TikTok, with Ohuhu at 4.7k, Vograce at 279, Polaroid at 241 posts. Ohuhu's activity is particularly concentrated on TikTok. On TikTok and YouTube, Ohuhu has multiple times more posts than Vograce and Polaroid.
By geographical market
Ohuhu vs. related brands influencer activity (by country)
Estimated sponsored posts in Ohuhu's top markets
Ohuhu has the highest estimated sponsored-post volume in United States (2.1k posts, 34.7%), India (636 posts, 10.4%), Brazil (618 posts, 10.1%), while Vograce leads in Mexico with 91 posts (7.6%), while Polaroid has the highest estimated sponsored-post volume in United Kingdom (78 posts, 9.8%), Japan (58 posts, 7.3%). Looking at United States specifically, the split is Ohuhu at 2.1k posts (34.7%), Vograce at 654 posts (54.8%), Polaroid at 341 posts (42.9%). Ohuhu's strength in United States may indicate a home-market focus, while Vograce shows broader regional investment.
Read more influencer strategy breakdowns
Looking for more like this? Here are 5 similar influencer marketing strategy breakdowns for other brands:
- Vograce's Influencer Marketing Strategy
- Polaroid's Influencer Marketing Strategy
- cleanskinclub's Influencer Marketing Strategy
- Poppi's Influencer Marketing Strategy
- Summer Fridays's Influencer Marketing Strategy
Or, if you want to access data like this for your own software or processes, take a look at Modash's API products:
Frequently asked questions
Scaling your influencer program?
When you outgrow your mishmash of spreadsheets & free tools, try Modash. Find & email influencers, track campaigns, ship products & more - all in one place.