Poppi Influencer Marketing Strategy
(2026 Data & Insights)
We analyzed 9.5k pieces of influencer content sponsored by Poppi over the last 12 months.
This report breaks down where & how Poppi invests in influencer marketing, which social platforms they prioritize, top geographical markets, and more.
The data in this report comes from Modash's Brand Collaborations API.
P.S. for a simple list of influencers who have collaborated with Poppi, see here: Poppi influencers.
Influencer activity throughout the year
Poppi's influencer campaigns are active year-round with notable month-to-month fluctuation. The chart below shows month-by-month data for total sponsored posts tracked.
Poppi's influencer activity by month
Number of sponsored posts
Poppi's influencer output appears relatively consistent throughout the year, averaging about 795 sponsored posts per month. December recorded the highest volume at 1.2k posts (45% above average), while June was the quietest at 370 posts.
Social platforms breakdown
In our dataset (which only includes Instagram, YouTube, and TikTok), this is how the volume of Poppi's sponsored influencer collaborations break down by social platform:
- TikTok: 6.7k posts (70.6%)
- Instagram: 2.8k posts (29.1%)
- YouTube: 29 posts (0.3%)
Poppi's influencer activity by platform
Share of sponsored content by social network
TikTok influencer marketing is a clear focus for Poppi.
Here are 3 examples of Poppi's recent sponsored collaborations (one each for Instagram, TikTok, YouTube).
treaclychild x Poppi

Influencer bio
I’m in charge
Collaboration metrics
Get a free trial to find more data on influencer audiences, performance, and collaborations.
harperzilmer4 x Poppi

Influencer bio
Teamharperzilmer@wmeagency.com
Collaboration metrics
Get a free trial to find more data on influencer audiences, performance, and collaborations.
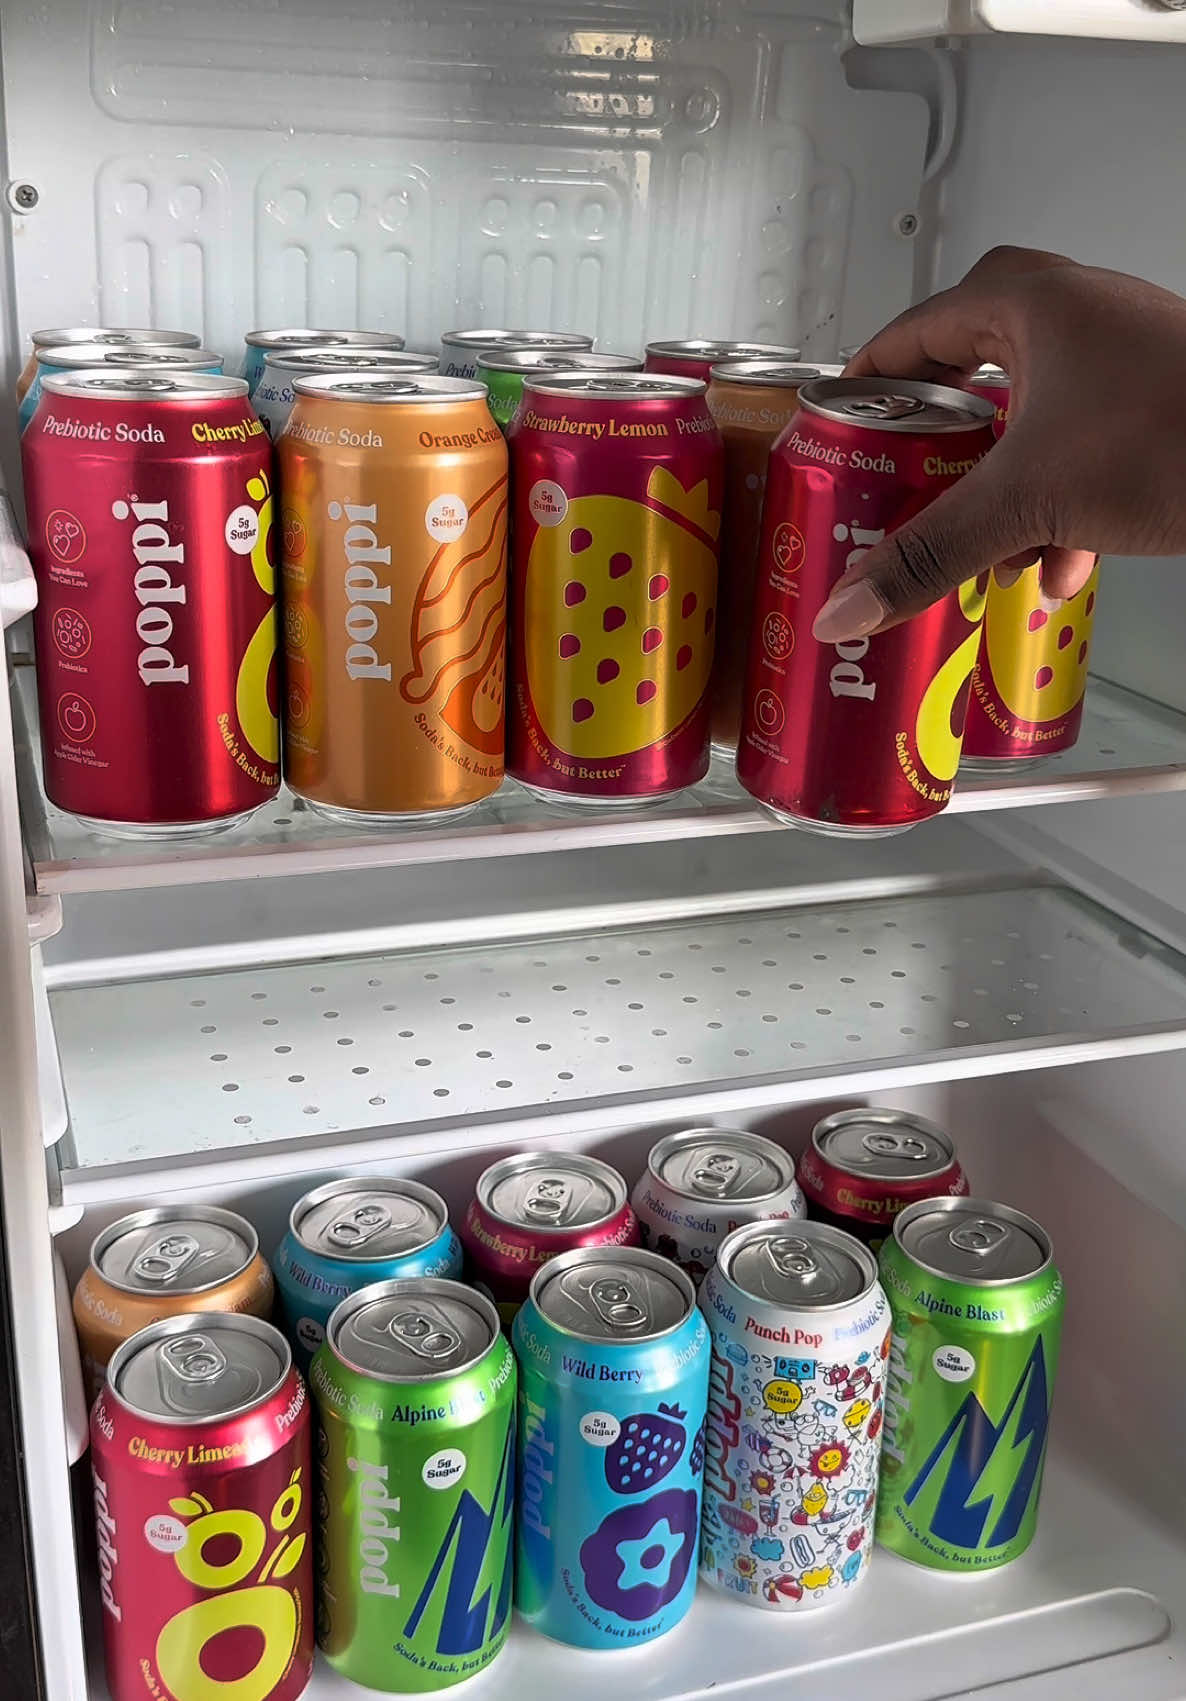
ashleym_lin x Poppi
![YouTube post by @ashleym_lin for Poppi. Caption reads: [...] of the week: 🥭🫐🍓🥝 + lots of @drinkpoppi....](https://images.od.modash.io/29fbfb581feb0b51d375b9bc3c92757a4247f134)
Influencer bio
Ashley Lin just a girl and her fridge ashleylin@underscoretalent.com
Collaboration metrics
Get a free trial to find more data on influencer audiences, performance, and collaborations.
If you break this down further by content type on TikTok, this is what it looks like:
- Videos: 96.5%
- Carousels: 3.5%
💡 Related resource: How To Find TikTok Influencers.
Influencer audience size breakdown (by views)
For their top social platform (TikTok), here is a breakdown of the type of influencers Poppi are collaborating with, by audience size.
Note: this breakdown is based on each influencer's average views (not follower/subscriber count), because views typically correlate more closely with influencer pricing and impact.
Poppi's influencers average views (TikTok)
Based on each influencer's average views per post
With 37% of partnerships featuring creators averaging 1K-5K views, Poppi's strategy suggests niche targeting and authenticity, likely leveraging collaboration models like gifting and affiliates to work with smaller creators.
Here is an example of a sponsored collaboration with a larger-audience creator on TikTok (5.4M avg views/post):
charlixcx x Poppi
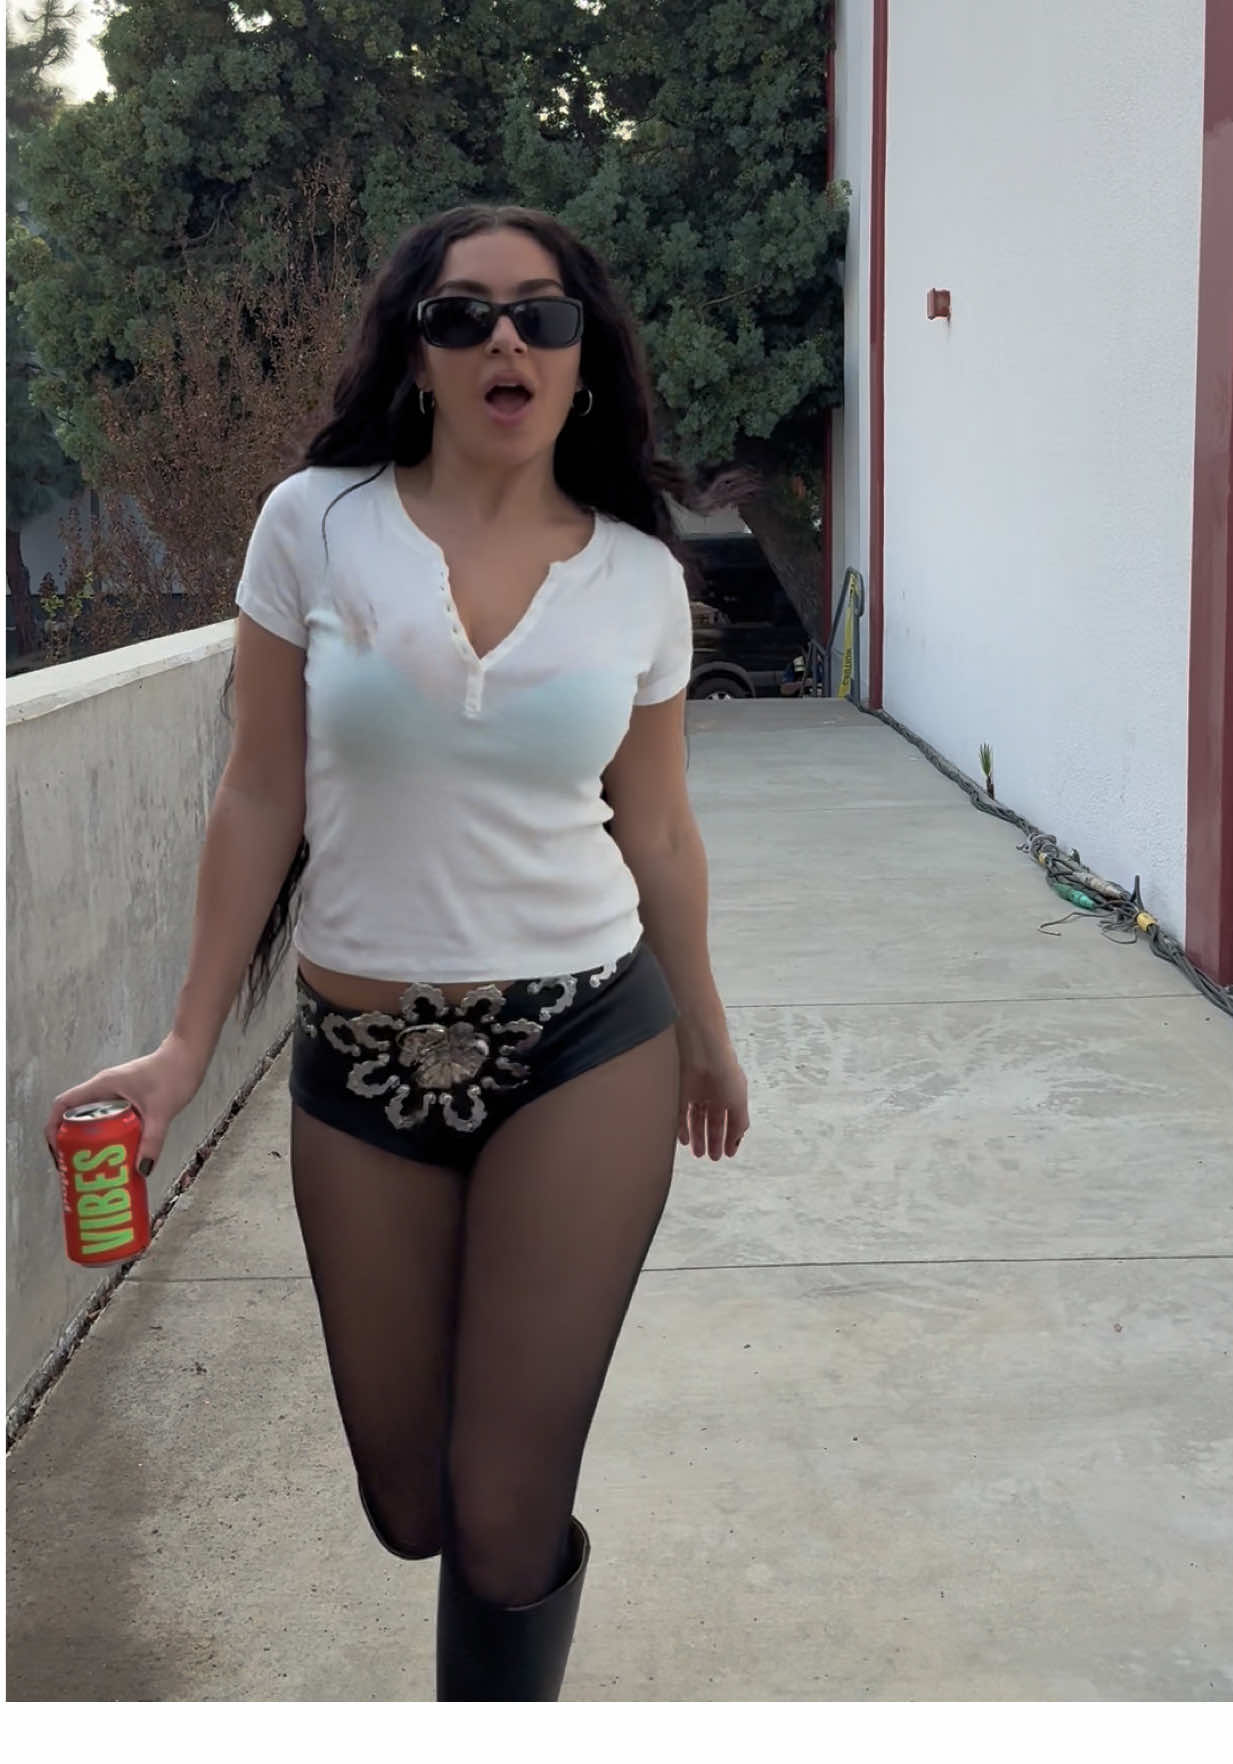
Influencer bio
Music, Fashion, Film out july 24th
Collaboration metrics
Get a free trial to find more data on influencer audiences, performance, and collaborations.
And here is another example with a smaller creator on TikTok (10.0k avg views/post):
kylieann.n x Poppi

Influencer bio
my favs, my life, & more 💌 teamkylie@modernmediaservices.com @Darling Digitals
Collaboration metrics
Get a free trial to find more data on influencer audiences, performance, and collaborations.
Poppi's repeat partnerships
Out of 5.2k unique influencers in our dataset, 329 of them (6%) posted content for Poppi in 3 or more separate calendar months. The most consistent partner is @chloeguzz, who has collaborated across 12 months with 48 total posts.
Here are 3 examples of Poppi's repeat influencer partnerships, with links to the sponsored content.
chloeguzz x Poppi
![TikTok post by @chloeguzz for Poppi. Caption reads: [...] SO MUCH MORE CONTENT TO COME!! #poppipartner....](https://images.od.modash.io/3e43b564f360cda835f8cb1f88ff1c0bcf97f4d8)
![TikTok post by @chloeguzz for Poppi. Caption reads: poppi in Starbs is just so perfect to [...].](https://images.od.modash.io/3a27269001d949f4e167452856f4459d32390b06)
ritamenja x Poppi
![TikTok post by @ritamenja for Poppi. Caption reads: [...] for this opportunity @drinkpoppi @Alix Earle....](https://images.od.modash.io/63c53a92b78a1018e1f7eeae44c9f713c54ebd73)
![TikTok post by @ritamenja for Poppi. Caption reads: [...] the day with me! @Parke @drinkpoppi....](https://images.od.modash.io/5f76a4dade77a9f718620c7d9dddd6b251b48ab4)
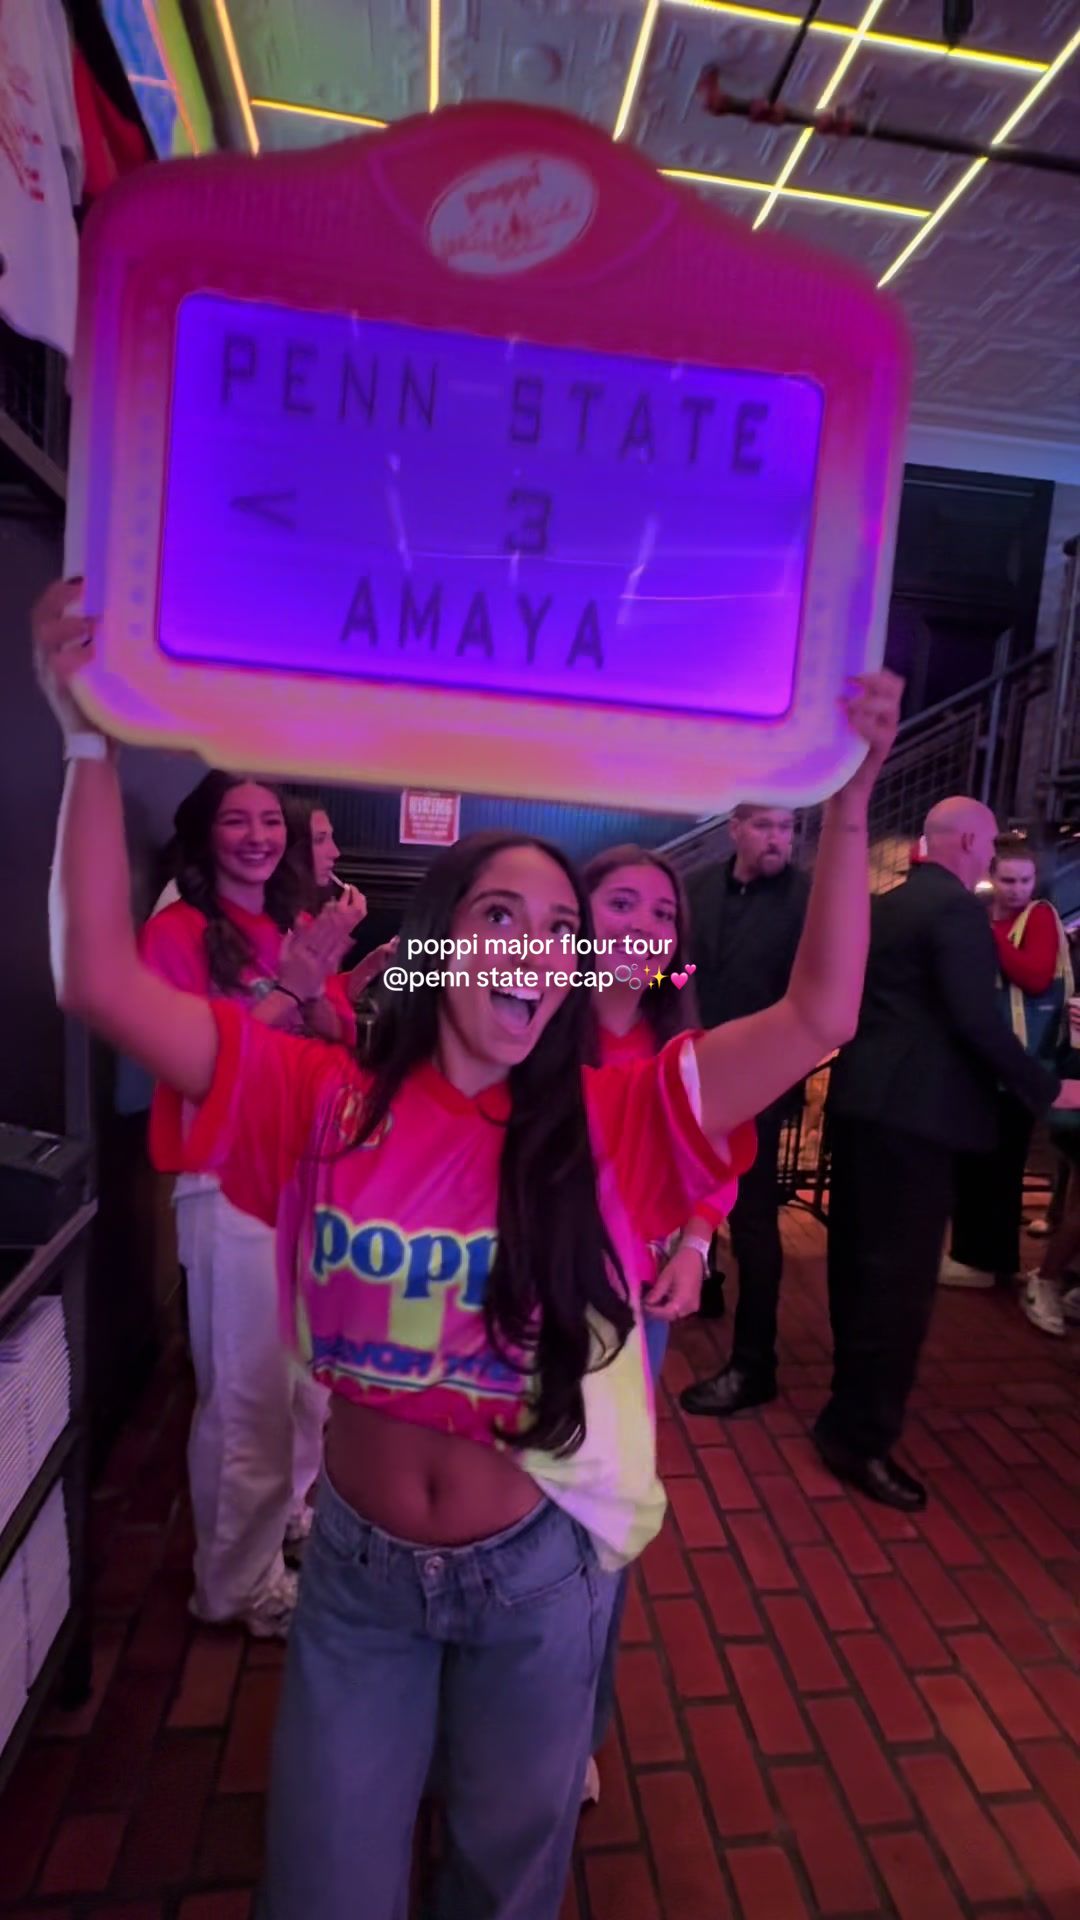
brynnwrightt x Poppi
![TikTok post by @brynnwrightt for Poppi. Caption reads: [...] back to campus and share🤭💘 @poppi shop....](https://images.od.modash.io/f3357f485cbc4aa619a85347d29bc708dd9cd849)

![TikTok post by @brynnwrightt for Poppi. Caption reads: poppi in starbs 😍😍 #poppipartner [...].](https://images.od.modash.io/bfa895d5d55cacefa323aad9b52f2584f30ce336)
💡 Related resource: Long-Term Influencer Partnerships: Pros, Cons & How The Pros Manage Them.
Geographical breakdown
In our dataset, United States is where Poppi had the most influencer activity. 77.4% of their live influencer content in the last 12 months was posted by American influencers.
Based on the percentage of influencer content per market, other important markets include:
- Canada (6.6%)
- United Kingdom (4.4%)
- Brazil (2.4%)
Poppi's influencer activity by market
Here is another example of Poppi collaborating with an influencer in United States.
octopusslover8 x Poppi

Poppi's influencer activity vs. related brands
Poppi competes with OLIPOP and DrinkPrime in better-for-you beverages marketed through lifestyle creators and functional benefit positioning. They target similar health-conscious consumers choosing alternatives to traditional soda and sports drinks based on social proof.
Total influencer content
Poppi vs. related brands influencer activity
Total sponsored posts tracked (last 12 months)
Poppi leads with 9.5k sponsored posts, significantly outpacing OLIPOP (5.9k posts) and DrinkPrime (3.6k posts). Across all three brands, the average volume is 6.4k posts, indicating mature, scaled influencer programs. Poppi has more total posts than OLIPOP and DrinkPrime combined.
By social platform
Poppi vs. related brands influencer activity (by social platform)
Sponsored posts by platform
Poppi leads on Instagram and TikTok, while OLIPOP leads on YouTube. The gap is most notable on TikTok, with Poppi at 6.7k, OLIPOP at 2.7k, DrinkPrime at 1.4k posts. Poppi's activity is particularly concentrated on TikTok. On TikTok, Poppi has multiple times more posts than OLIPOP and DrinkPrime, while on YouTube OLIPOP has far more posts than Poppi and DrinkPrime.
By geographical market
Poppi vs. related brands influencer activity (by country)
Estimated sponsored posts in Poppi's top markets
Poppi has the highest estimated sponsored-post volume in United States (7.4k posts, 77.4%), Canada (630 posts, 6.6%), United Kingdom (420 posts, 4.4%), suggesting a North America focus, while DrinkPrime leads in India with 337 posts (9.3%). Looking at United States specifically, the split is Poppi at 7.4k posts (77.4%), OLIPOP at 4.8k posts (81.9%), DrinkPrime at 1.9k posts (53.1%). Poppi's strength in United States and United Kingdom may indicate a home-market focus, while DrinkPrime shows broader regional investment.
Read more influencer strategy breakdowns
Looking for more like this? Here are 5 similar influencer marketing strategy breakdowns for other brands:
- OLIPOP's Influencer Marketing Strategy
- DrinkPrime's Influencer Marketing Strategy
- FIGS's Influencer Marketing Strategy
- Ellis Brooklyn's Influencer Marketing Strategy
- Spark Paws's Influencer Marketing Strategy
Or, if you want to access data like this for your own software or processes, take a look at Modash's API products:
Frequently asked questions
Scaling your influencer program?
When you outgrow your mishmash of spreadsheets & free tools, try Modash. Find & email influencers, track campaigns, ship products & more - all in one place.