Triquetra Health Influencer Marketing Strategy
(2026 Data & Insights)
We analyzed 12.1k pieces of influencer content sponsored by Triquetra Health over the last 12 months.
This report breaks down where & how Triquetra Health invests in influencer marketing, which social platforms they prioritize, top geographical markets, and more.
The data in this report comes from Modash's Brand Collaborations API.
P.S. for a simple list of influencers who have collaborated with Triquetra Health, see here: Triquetra Health influencers.
Influencer activity throughout the year
Triquetra Health's influencer campaigns are active year-round with notable month-to-month fluctuation. The chart below shows month-by-month data for total sponsored posts tracked.
Triquetra Health's influencer activity by month
Number of sponsored posts
Triquetra Health's sponsored post volume peaks in January with 2k posts, 97% higher than the monthly average of 1k. June recorded the lowest activity at 219 posts, 78% below average.
Social platforms breakdown
In our dataset (which only includes Instagram, YouTube, and TikTok), this is how the volume of Triquetra Health's sponsored influencer collaborations break down by social platform:
- TikTok: 12.1k posts (100%)
- YouTube: 2 posts (0%)
Triquetra Health's influencer activity by platform
Share of sponsored content by social network
TikTok influencer marketing is a clear focus for Triquetra Health.
Here are 2 examples of Triquetra Health's recent sponsored collaborations (one each for TikTok, YouTube).
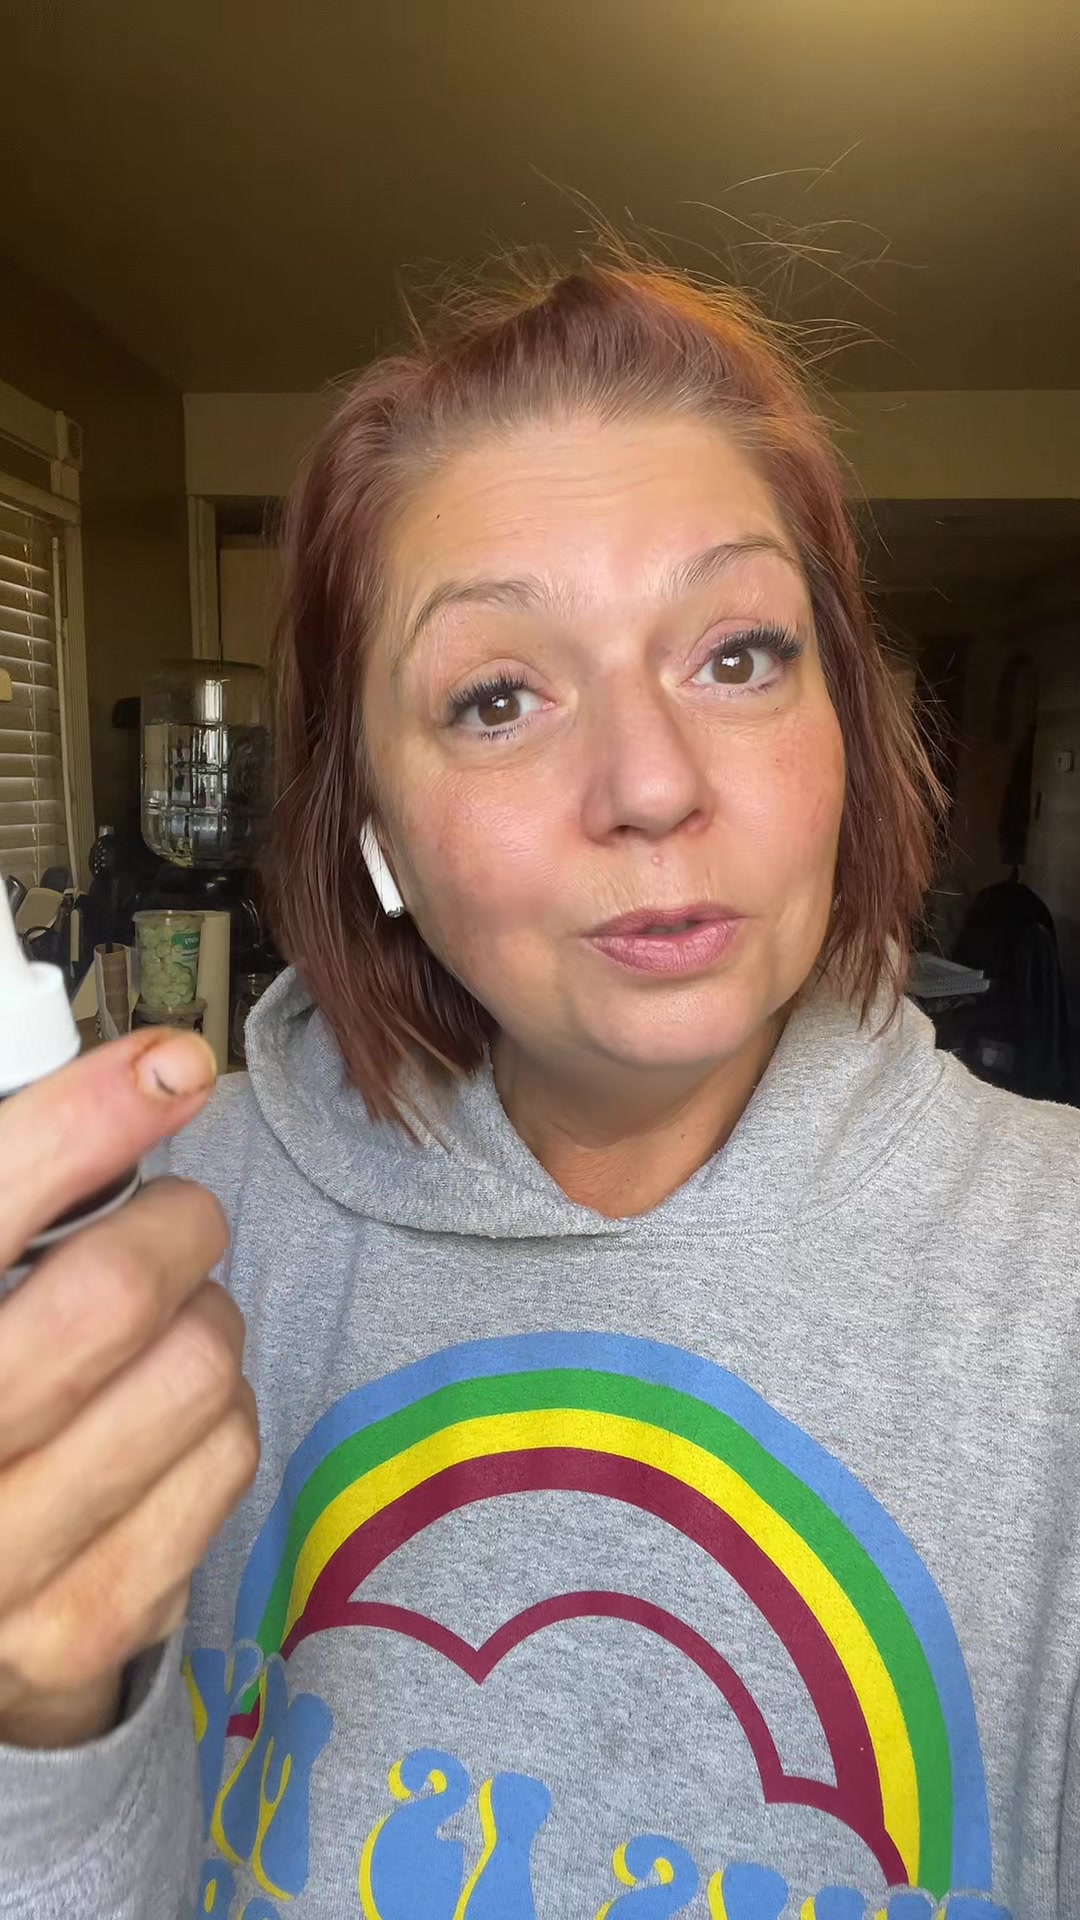
robinsfavorites x Triquetra Health

Influencer bio
GEN X MOM who ❤️ TTS + sharing my FAVORITES ❤️ 📧collabs:robinsfavorites123@gmail.com
Collaboration metrics
Get a free trial to find more data on influencer audiences, performance, and collaborations.
Tegan_Michelle x Triquetra Health

Influencer bio
I’m Tegan Michelle creator of the MetaMind Method. This channel is for high-capacity humans who understand that health isn’t separate from wealth, relationships, or leadership — it accelerates all of them. When your nervous system is regulated and your metabolism is supported, everything expands: • Your clarity • Your energy • Your emotional capacity • Your ability to lead, love, and create wealth This work doesn’t start with habits or motivation. It starts with who you are becoming — and whether your body feels safe enough to support that identity. Your health is your wealth. And when your health is aligned, your relationships deepen and your income follows. Your body isn’t broken. It’s been protecting you. Let’s build a body that supports the life you’re meant to live.
Collaboration metrics
Get a free trial to find more data on influencer audiences, performance, and collaborations.
If you break this down further by content type on TikTok, this is what it looks like:
- Videos: 95.3%
- Carousels: 4.7%
💡 Related resource: How To Find TikTok Influencers.
Influencer audience size breakdown (by views)
For their top social platform (TikTok), here is a breakdown of the type of influencers Triquetra Health are collaborating with, by audience size.
Note: this breakdown is based on each influencer's average views (not follower/subscriber count), because views typically correlate more closely with influencer pricing and impact.
Triquetra Health's influencers average views (TikTok)
Based on each influencer's average views per post
With 88.7% of partnerships featuring creators averaging <1K views, Triquetra Health's strategy suggests niche targeting and authenticity, likely leveraging collaboration models like gifting and affiliates to work with smaller creators.
Here is an example of a sponsored collaboration with a larger-audience creator on TikTok (164.6k avg views/post):
rphreviews x Triquetra Health

Influencer bio
Pharmacist for 18+ yrs giving you the rx tea your normal pharmacist is too busy to give you. Pharmacist is in ✌🏻 therphreviews@gmail.com
Collaboration metrics
Get a free trial to find more data on influencer audiences, performance, and collaborations.
And here is another example with a smaller creator on TikTok (8.8k avg views/post):
nursebrandiwithani x Triquetra Health

Influencer bio
💜ER Nurse | Mature Skincare & Makeup | Fashion Finds Backup Acct⬇️ @mark_brandi_countrylivin Collabs nursebrandicollabs@gmail.com
Collaboration metrics
Get a free trial to find more data on influencer audiences, performance, and collaborations.
Triquetra Health's repeat partnerships
Out of 3.9k unique influencers in our dataset, 290 of them (7%) posted content for Triquetra Health in 3 or more separate calendar months. The most consistent partner is @iamhollymoss, who has collaborated across 11 months with 234 total posts.
Here are 3 examples of Triquetra Health's repeat influencer partnerships, with links to the sponsored content.
iamhollymoss x Triquetra Health


thewholesome_mom x Triquetra Health

robinsfavorites x Triquetra Health

💡 Related resource: Long-Term Influencer Partnerships: Pros, Cons & How The Pros Manage Them.
Geographical breakdown
In our dataset, United States is where Triquetra Health had the most influencer activity. 79.1% of their live influencer content in the last 12 months was posted by American influencers.
Based on the percentage of influencer content per market, other important markets include:
- United Kingdom (9.7%)
- Canada (7.5%)
- South Africa (2.2%)
Triquetra Health's influencer activity by market
Here is another example of Triquetra Health collaborating with an influencer in United States.
authenticallythrive x Triquetra Health

Triquetra Health's influencer activity vs. related brands
Triquetra Health competes with Grüns and Sports Research in supplements where credibility and routine-based creator content are key. They target health-minded consumers looking for functional benefits and repeatable daily habits.
Total influencer content
Triquetra Health vs. related brands influencer activity
Total sponsored posts tracked (last 12 months)
Triquetra Health leads with 12.1k sponsored posts, significantly outpacing Grüns (4.6k posts) and Sports Research (4.2k posts). Across all three brands, the average volume is 6.9k posts, indicating mature, scaled influencer programs. Triquetra Health has nearly three times as many total posts as Grüns and Sports Research.
By social platform
Triquetra Health vs. related brands influencer activity (by social platform)
Sponsored posts by platform
Triquetra Health leads on TikTok, while Sports Research has the most activity on Instagram and Grüns has the most activity on YouTube. The gap is most notable on TikTok, with Triquetra Health at 12.1k, Grüns at 4.2k, Sports Research at 3.6k posts. Triquetra Health's activity is particularly concentrated on TikTok. Triquetra Health’s posting activity is almost entirely on TikTok, while Sports Research has a large share of posts on Instagram.
By geographical market
Triquetra Health vs. related brands influencer activity (by country)
Estimated sponsored posts in Triquetra Health's top markets
Triquetra Health has the highest estimated sponsored-post volume in United States (9.6k posts, 79.1%), United Kingdom (1.2k posts, 9.7%), Canada (907 posts, 7.5%), suggesting a North America focus, while Sports Research has the highest estimated sponsored-post volume in Brazil (260 posts, 6.2%), India (172 posts, 4.1%). Looking at United States specifically, the split is Triquetra Health at 9.6k posts (79.1%), Grüns at 3.4k posts (75%), Sports Research at 3.1k posts (73.5%). Triquetra Health's strength in United States and United Kingdom may indicate a home-market focus, while Sports Research shows broader regional investment.
Read more influencer strategy breakdowns
Looking for more like this? Here are 5 similar influencer marketing strategy breakdowns for other brands:
- Grüns's Influencer Marketing Strategy
- Sports Research's Influencer Marketing Strategy
- Aputure's Influencer Marketing Strategy
- HSIA Lingerie's Influencer Marketing Strategy
- OGL Move's Influencer Marketing Strategy
Or, if you want to access data like this for your own software or processes, take a look at Modash's API products:
Frequently asked questions
Scaling your influencer program?
When you outgrow your mishmash of spreadsheets & free tools, try Modash. Find & email influencers, track campaigns, ship products & more - all in one place.