Aputure Influencer Marketing Strategy
(2026 Data & Insights)
We analyzed 1.2k pieces of influencer content sponsored by Aputure over the last 12 months.
This report breaks down where & how Aputure invests in influencer marketing, which social platforms they prioritize, top geographical markets, and more.
The data in this report comes from Modash's Brand Collaborations API.
P.S. for a simple list of influencers who have collaborated with Aputure, see here: Aputure influencers.
Influencer activity throughout the year
Aputure's influencer campaigns are active year-round with notable month-to-month fluctuation. The chart below shows month-by-month data for total sponsored posts tracked.
Aputure's influencer activity by month
Number of sponsored posts
Aputure's influencer output appears relatively consistent throughout the year, averaging about 100 sponsored posts per month. June recorded the highest volume at 121 posts (21% above average), while August was the quietest at 79 posts.
Social platforms breakdown
In our dataset (which only includes Instagram, YouTube, and TikTok), this is how the volume of Aputure's sponsored influencer collaborations break down by social platform:
- Instagram: 764 posts (62.4%)
- YouTube: 364 posts (29.7%)
- TikTok: 96 posts (7.8%)
Aputure's influencer activity by platform
Share of sponsored content by social network
Content format by platform
Share of all sponsored posts.
Instagram influencer marketing is a clear focus for Aputure.
Here are 3 examples of Aputure's recent sponsored collaborations (one each for Instagram, TikTok, YouTube).
erypolat x Aputure
![Instagram post by @erypolat for Aputure. Caption reads: [...] geri göndermek istemedim bebekleri 🥲....](https://images.od.modash.io/0796193a81788582d46fed4397a031d01dcf2dbc)
Influencer bio
#filmmaking | #videography | #photography iş birlikleri için 📩 eraypolat@conexus.media @beta_creativestudio YouTube: Cousinz Productions
Collaboration metrics
Get a free trial to find more data on influencer audiences, performance, and collaborations.
currentspaces x Aputure
![TikTok post by @currentspaces for Aputure. Caption reads: [...] This thing SLAPS. And the best part?....](https://images.od.modash.io/81f3107f80370e03c89766355d7d92969766cbc5)
Influencer bio
⌖ Toronto | Quinte West Travel & Commercial Photographer
Collaboration metrics
Get a free trial to find more data on influencer audiences, performance, and collaborations.
CorridorCrew x Aputure
![YouTube post by @CorridorCrew for Aputure. Caption reads: [...] ► Creative Tools ► Puget Computers: Aputure....](https://images.od.modash.io/498c58d4c078f510b9ee8b5477379e0158864f44)
Influencer bio
Backflips and Frontflips simultaneously.
Collaboration metrics
Get a free trial to find more data on influencer audiences, performance, and collaborations.
If you break this down further by content type on Instagram, this is what it looks like:
- Reels: 70.8%
- Posts: 29.2%
💡 Related resource: How To Find Instagram Influencers.
Influencer audience size breakdown (by views)
For their top social platform (Instagram), here is a breakdown of the type of influencers Aputure are collaborating with, by audience size.
Note: this breakdown is based on each influencer's average views (not follower/subscriber count), because views typically correlate more closely with influencer pricing and impact.
Aputure's influencers average views (Instagram)
Based on each influencer's average views per post
With 37.4% of partnerships featuring creators averaging 10K-50K views, Aputure's strategy suggests cost-efficiency and engagement-focused partnerships. The 1K-5K views segment is also prominent at 29.3%, indicating investment across adjacent tiers.
Here is an example of a sponsored collaboration with a larger-audience creator on Instagram (635.7k avg views/post):
nica.fazio x Aputure
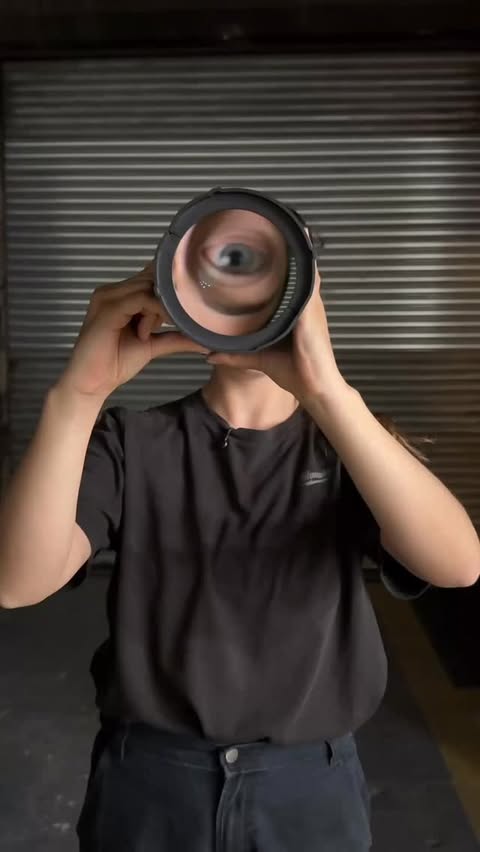
Influencer bio
grip & electric / photographer 🫂@girlsjustwannaloadtrucks photos @nicafaziophoto italy/spain - 📍NYC
Collaboration metrics
Get a free trial to find more data on influencer audiences, performance, and collaborations.
And here is another example with a smaller creator on Instagram (10.0k avg views/post):
tomxshaw x Aputure
![Instagram post by @tomxshaw for Aputure. Caption reads: [...] can truly unlocked its full potential⚡️....](https://images.od.modash.io/53275b50e6da13575d95c50a57107bfef4cf512b)
Influencer bio
📍CT/NY 🎥 Cinematographer ⚡️ @aputure.lighting Ambassador 🎬 Owner: @vantageproductions_ ⚔️ Stay The Course
Collaboration metrics
Get a free trial to find more data on influencer audiences, performance, and collaborations.
Aputure's repeat partnerships
Out of 509 unique influencers in our dataset, 33 of them (6%) posted content for Aputure in 3 or more separate calendar months. The most consistent partner is @CONECOFILM, who has collaborated across 13 months with 48 total posts.
Here are 3 examples of Aputure's repeat influencer partnerships, with links to the sponsored content.
ShortCircuit x Aputure
![YouTube post by @ShortCircuit for Aputure. Caption reads: [...] in part by Studio lighting by Aputure: Linus....](https://images.od.modash.io/079bdeea3b56a343eb8dafdfcf360053d40b974c)
![YouTube post by @ShortCircuit for Aputure. Caption reads: [...] in part by Studio lighting by Aputure: Linus....](https://images.od.modash.io/5cbbf73236b692a5288bb30240429b5c68a3764d)
![YouTube post by @ShortCircuit for Aputure. Caption reads: [...] in part by Studio lighting by Aputure: Linus....](https://images.od.modash.io/551a226a5706d94bdd96bb90f17fa8eade0c250d)
CorridorCrew x Aputure
![YouTube post by @CorridorCrew for Aputure. Caption reads: [...] Tools ► Puget Computers: Aputure Lights:....](https://images.od.modash.io/222356f45dd4bb90f4d1a15999b241a33f5352ff)
![YouTube post by @CorridorCrew for Aputure. Caption reads: [...] Tools ► Puget Computers: Aputure Lights:....](https://images.od.modash.io/ed8ab5c37c42c8428d2394f13febf4f98c2f5598)
de_con x Aputure
![Instagram post by @de_con for Aputure. Caption reads: @aputure.lighting infinibars, You did [...].](https://images.od.modash.io/1c8f38fa9f48772c7db9620ae7ff5f27b3199661)

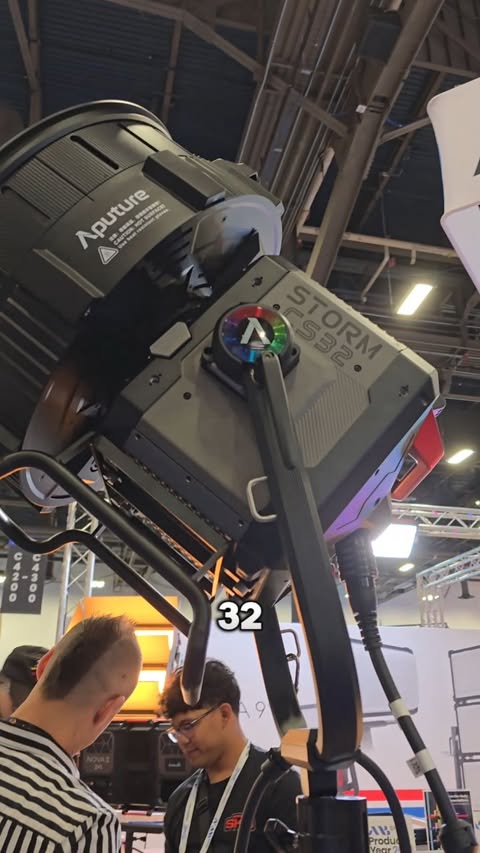
💡 Related resource: Long-Term Influencer Partnerships: Pros, Cons & How The Pros Manage Them.
Geographical breakdown
In our dataset, United States is where Aputure had the most influencer activity. 41.3% of their live influencer content in the last 12 months was posted by American influencers.
Based on the percentage of influencer content per market, other important markets include:
- India (16.4%)
- Brazil (7%)
- United Kingdom (4.5%)
Aputure's influencer activity by market
Here is another example of Aputure collaborating with an influencer in United States.
alden.peters x Aputure
![TikTok post by @alden.peters for Aputure. Caption reads: [...] with our small indie team, using only....](https://images.od.modash.io/a76e629132eb24467d2913a684a1a75c702ea9d4)
Aputure's influencer activity vs. related brands
Aputure, NEEWER, and Ulanzi all compete in creator lighting and production accessories for filmmakers and content creators. Their influencer campaigns often feature gear reviews, studio setups, and performance comparisons across price tiers.
Total influencer content
Aputure vs. related brands influencer activity
Total sponsored posts tracked (last 12 months)
Ulanzi leads with 4k sponsored posts, notably outpacing NEEWER (3.3k posts) and Aputure (1.2k posts). Across all three brands, the average volume is 2.8k posts, indicating mature, scaled influencer programs. NEEWER and Ulanzi have roughly three times as many total posts as Aputure.
By social platform
Aputure vs. related brands influencer activity (by social platform)
Sponsored posts by platform
Among these brands, Ulanzi leads on Instagram and TikTok and NEEWER leads on YouTube. The gap is most notable on Instagram, with Ulanzi at 1.1k, Aputure at 764, NEEWER at 581 posts. On TikTok, NEEWER and Ulanzi have far more posts than Aputure.
By geographical market
Aputure vs. related brands influencer activity (by country)
Estimated sponsored posts in Aputure's top markets
NEEWER has the highest estimated sponsored-post volume in United States (991 posts, 30.1%), India (313 posts, 9.5%), United Kingdom (217 posts, 6.6%), while Ulanzi has the highest estimated sponsored-post volume in Japan (368 posts, 9.3%), Brazil (305 posts, 7.7%). Looking at United States specifically, the split is NEEWER at 991 posts (30.1%), Ulanzi at 769 posts (19.4%), Aputure at 506 posts (41.3%).
Read more influencer strategy breakdowns
Looking for more like this? Here are 5 similar influencer marketing strategy breakdowns for other brands:
- NEEWER's Influencer Marketing Strategy
- Ulanzi's Influencer Marketing Strategy
- Bombas's Influencer Marketing Strategy
- ELIE SAAB's Influencer Marketing Strategy
- NABLA Cosmetics's Influencer Marketing Strategy
Or, if you want to access data like this for your own software or processes, take a look at Modash's API products:
Frequently asked questions
Scaling your influencer program?
When you outgrow your mishmash of spreadsheets & free tools, try Modash. Find & email influencers, track campaigns, ship products & more - all in one place.