Sports Research Influencer Marketing Strategy
(2026 Data & Insights)
We analyzed 4.1k pieces of influencer content sponsored by Sports Research over the last 12 months.
This report breaks down where & how Sports Research invests in influencer marketing, which social platforms they prioritize, top geographical markets, and more.
The data in this report comes from Modash's Brand Collaborations API.
P.S. for a simple list of influencers who have collaborated with Sports Research, see here: Sports Research influencers.
Influencer activity throughout the year
Sports Research's influencer campaigns are active year-round with notable month-to-month fluctuation. The chart below shows month-by-month data for total sponsored posts tracked.
Sports Research's influencer activity by month
Number of sponsored posts
Sports Research's sponsored post volume peaks in January with 535 posts, 60% higher than the monthly average of 335. October recorded the lowest activity at 210 posts, 37% below average.
Social platforms breakdown
In our dataset (which only includes Instagram, YouTube, and TikTok), this is how the volume of Sports Research's sponsored influencer collaborations break down by social platform:
- TikTok: 3.4k posts (84.4%)
- Instagram: 627 posts (15.5%)
- YouTube: 7 posts (0.2%)
Sports Research's influencer activity by platform
Share of sponsored content by social network
TikTok influencer marketing is a clear focus for Sports Research.
Here are 2 examples of Sports Research's recent sponsored collaborations (one each for Instagram, TikTok).
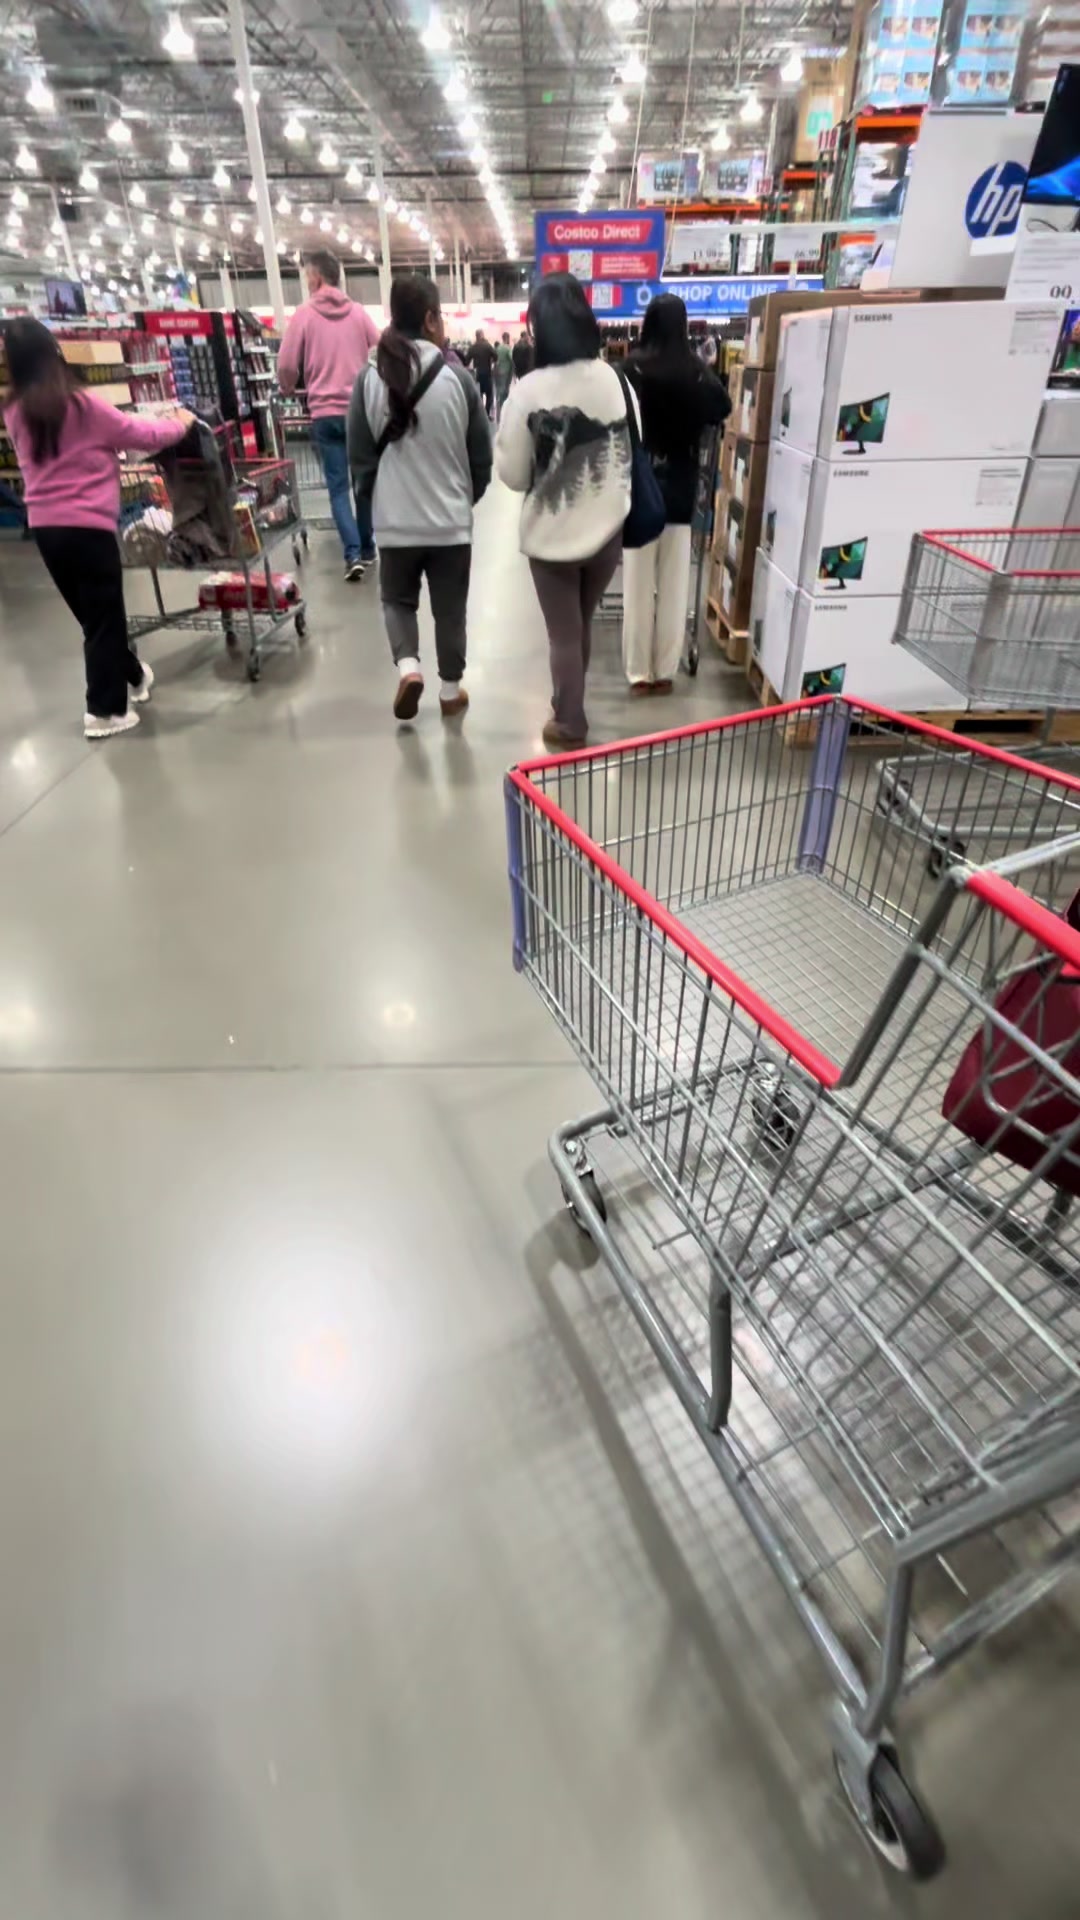
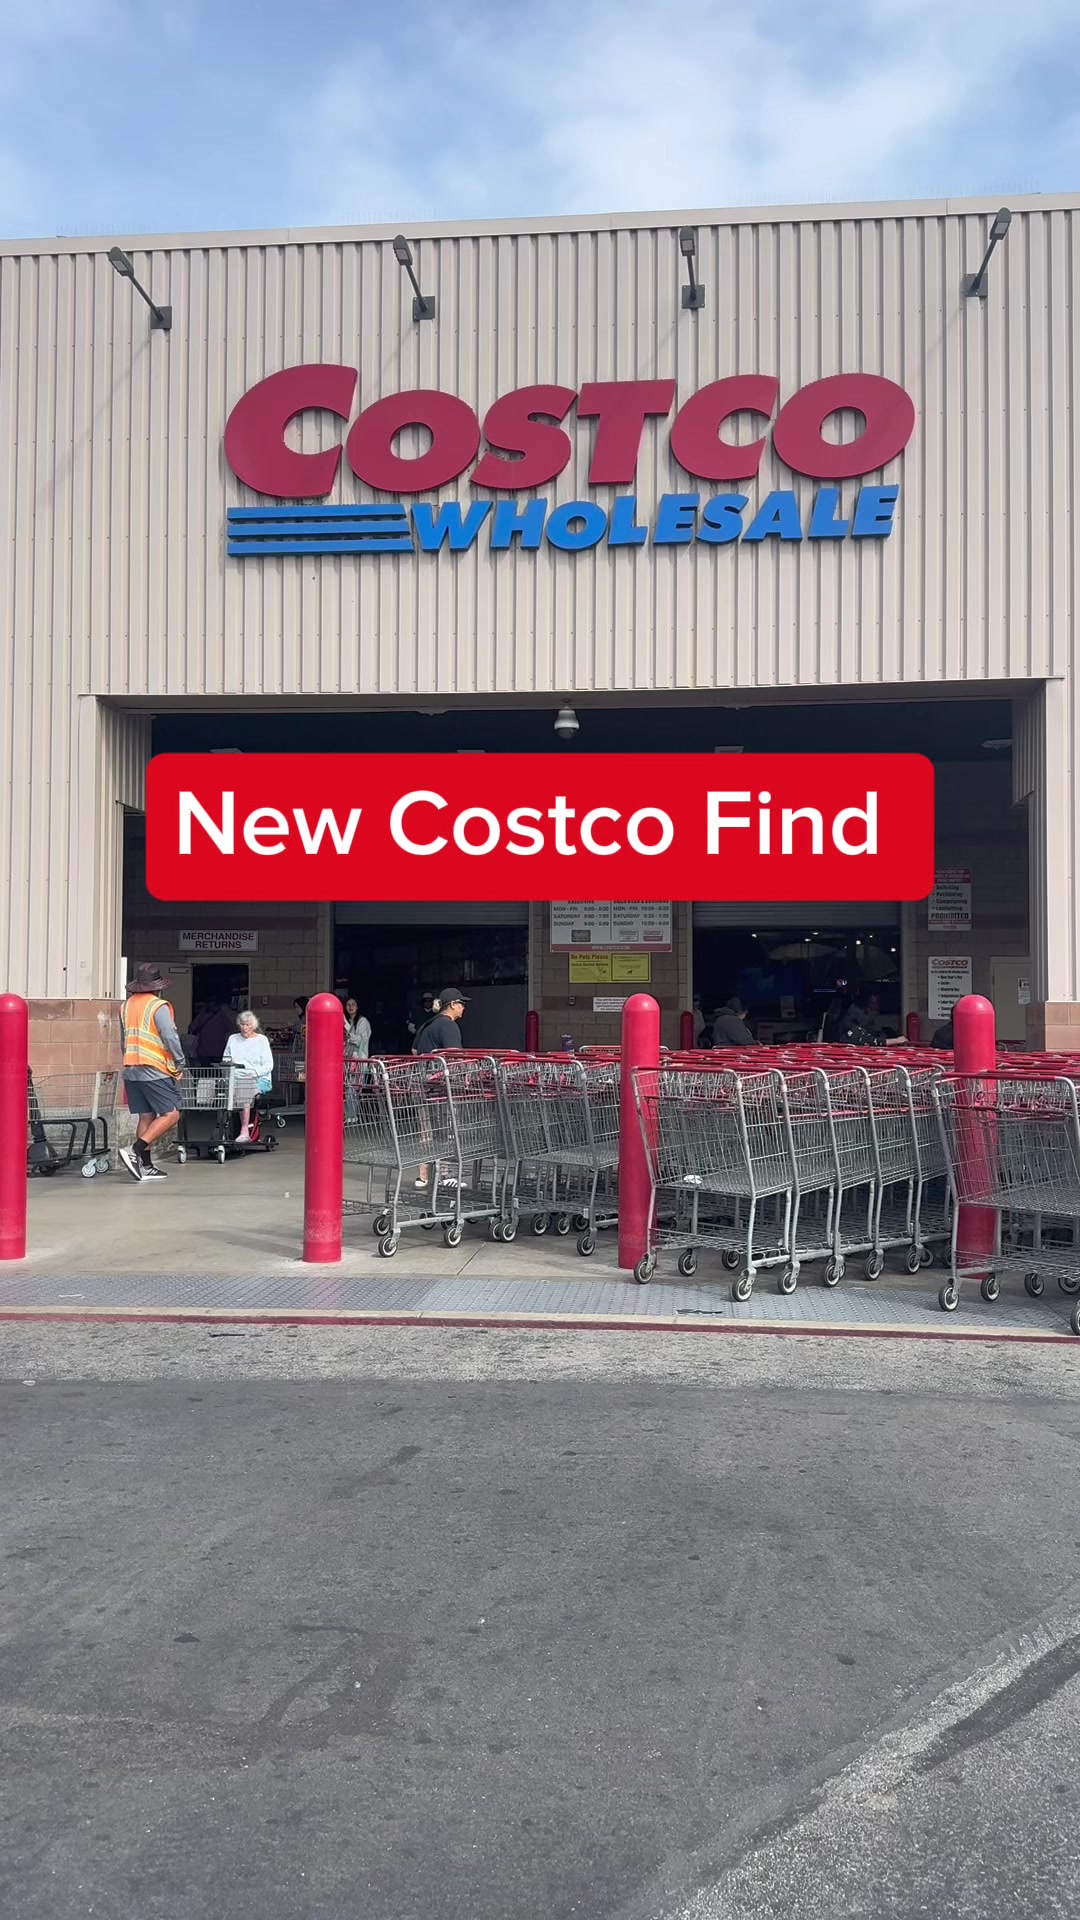
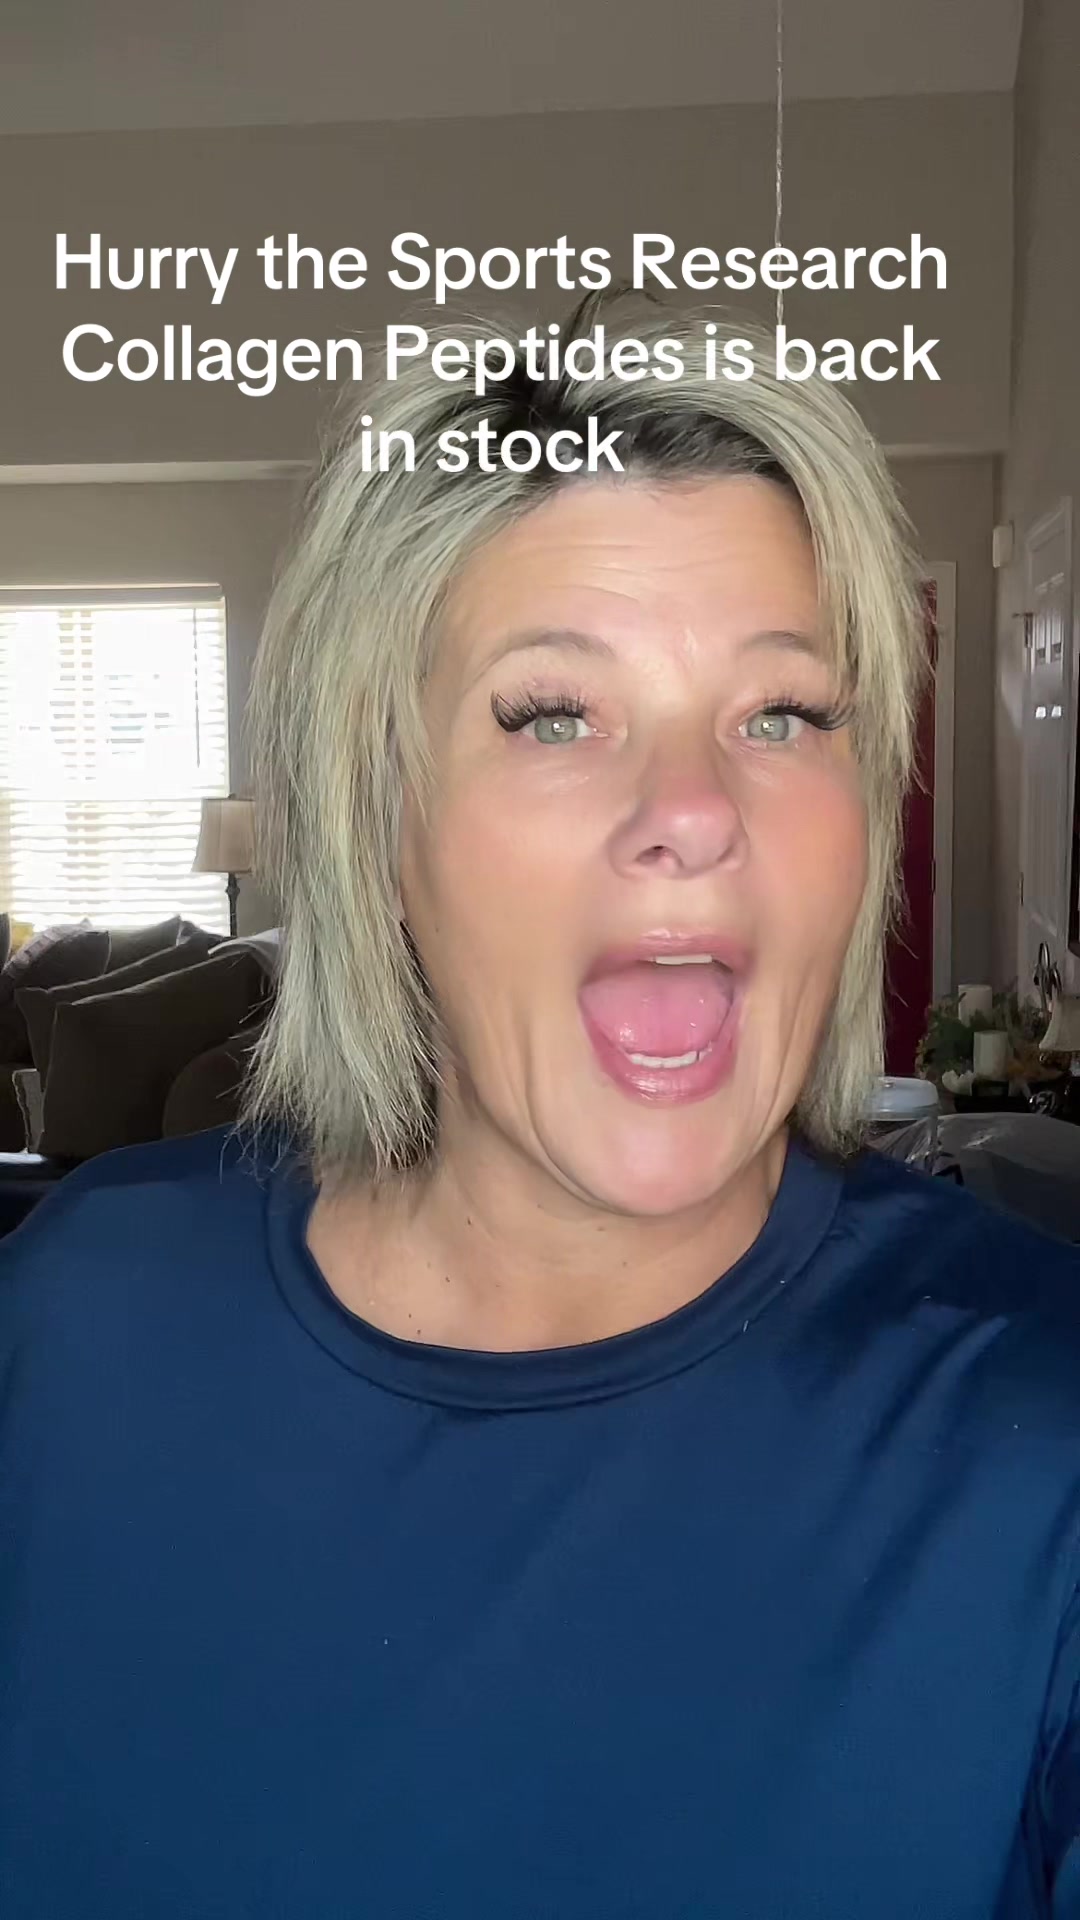
costcobuys x Sports Research
![Instagram post by @costcobuys for Sports Research. Caption reads: [...] Krill Oil 1000mg is now at Costco!....](https://images.od.modash.io/eec97aac21fb6b37cc351c7f72803167ea376d1f)
Influencer bio
🛒 Follow me for hot Costco finds! 📥 CostcoBuysInfo@gmail.com for collabs! 🚫 Not affiliated with Costco 📍 MI 🇺🇸
Collaboration metrics
Get a free trial to find more data on influencer audiences, performance, and collaborations.
ellanest x Sports Research
Influencer bio
Sharing my favorite ttshop finds 🛍️ 💖
Collaboration metrics
Get a free trial to find more data on influencer audiences, performance, and collaborations.
If you break this down further by content type on TikTok, this is what it looks like:
- Videos: 95.3%
- Carousels: 4.7%
💡 Related resource: How To Find TikTok Influencers.
Influencer audience size breakdown (by views)
For their top social platform (TikTok), here is a breakdown of the type of influencers Sports Research are collaborating with, by audience size.
Note: this breakdown is based on each influencer's average views (not follower/subscriber count), because views typically correlate more closely with influencer pricing and impact.
Sports Research's influencers average views (TikTok)
Based on each influencer's average views per post
With 81.7% of partnerships featuring creators averaging <1K views, Sports Research's strategy suggests niche targeting and authenticity, likely leveraging collaboration models like gifting and affiliates to work with smaller creators.
Here is an example of a sponsored collaboration with a larger-audience creator on TikTok (1.2M avg views/post):
costcoexperts x Sports Research
Influencer bio
⭐️Finding the best products & deals at Costco! IG: costco_experts 💌 costcoexperts@gmail.com Not affiliated with Costco
Collaboration metrics
Get a free trial to find more data on influencer audiences, performance, and collaborations.
And here is another example with a smaller creator on TikTok (8.7k avg views/post):
fernandaromero007 x Sports Research
![TikTok post by @fernandaromero007 for Sports Research. Caption reads: [...] Magtein Magnesium L-Threonate by @Sports....](https://images.od.modash.io/431a183d823fd7135694730b3bdcb84c1d2ca3bf)
Influencer bio
Follow my IG @fernandaromeroo Actress, mom & real life in between Beauty tips, chaos, growth, and everyday moments! Get this laser for less!👇🏽
Collaboration metrics
Get a free trial to find more data on influencer audiences, performance, and collaborations.
Sports Research's repeat partnerships
Out of 1.8k unique influencers in our dataset, 186 of them (10%) posted content for Sports Research in 3 or more separate calendar months. The most consistent partner is @babzy531, who has collaborated across 11 months with 32 total posts.
Here are 3 examples of Sports Research's repeat influencer partnerships, with links to the sponsored content.
babzy531 x Sports Research
![TikTok post by @babzy531 for Sports Research. Caption reads: [...] #tipsforgirls #skin #hair @Sports Research.](https://images.od.modash.io/6d409c254fbdcbae8d395733f16e123969860d97)
![TikTok post by @babzy531 for Sports Research. Caption reads: [...] and experience with the Sports Research....](https://images.od.modash.io/59a4d8baabbf36768348f4fb3f781c587bc4492c)
meiby_ardon x Sports Research
![TikTok post by @meiby_ardon for Sports Research. Caption reads: [...] y con brillo? La biotina Sports Research es....](https://images.od.modash.io/d7387adba10f4faf672270a4a5365eef86e183af)
![TikTok post by @meiby_ardon for Sports Research. Caption reads: [...] #tiktokshop #latinas @Sports Research.](https://images.od.modash.io/c8f0eed2eae53e5fa6b921093a7f144168c36d9b)
![TikTok post by @meiby_ardon for Sports Research. Caption reads: [...] vida ✨ Con la biotina de Sports Research....](https://images.od.modash.io/31cca6647a85eb31315839256588c1e0de7cff80)
patty_streff_fitness x Sports Research
![Instagram post by @patty_streff_fitness for Sports Research. Caption reads: [...] health all winter long. @sportsresearch....](https://images.od.modash.io/4df5c6ccb0c1fc52e1b79316e40079b5d53dffc5)
![Instagram post by @patty_streff_fitness for Sports Research. Caption reads: [...] D3 + K2 gummies from Sports Research have....](https://images.od.modash.io/d9625a3d9cb7e868383a07a2c657ba3660c4815b)
![Instagram post by @patty_streff_fitness for Sports Research. Caption reads: [...] I recently picked up Sports Research D3 + K2....](https://images.od.modash.io/4f320391c9741822e864e3b4b3ca59645268daf6)
💡 Related resource: Long-Term Influencer Partnerships: Pros, Cons & How The Pros Manage Them.
Geographical breakdown
In our dataset, United States is where Sports Research had the most influencer activity. 69.2% of their live influencer content in the last 12 months was posted by American influencers.
Based on the percentage of influencer content per market, other important markets include:
- Brazil (7%)
- India (4%)
- Canada (2.8%)
Sports Research's influencer activity by market
Here is another example of Sports Research collaborating with an influencer in United States.
healthwithhunter x Sports Research
![TikTok post by @healthwithhunter for Sports Research. Caption reads: [...] I was so excited to walk in and see @Sports....](https://images.od.modash.io/89770e776fb49fa1857772743bc7f0e73267edb3)
Sports Research's influencer activity vs. related brands
Sports Research competes in mainstream wellness supplements alongside OLLY and Goli, which also have strong brand recognition and social proof in daily routines. They share similar influencer channels focused on health, convenience, and consistent use.
Total influencer content
Sports Research vs. related brands influencer activity
Total sponsored posts tracked (last 12 months)
Goli leads with 40.3k sponsored posts, significantly outpacing Sports Research (4.1k posts) and OLLY (2.7k posts). Across all three brands, the average volume is 15.7k posts, indicating mature, scaled influencer programs. Goli has substantially more total posts than Sports Research and OLLY.
By social platform
Sports Research vs. related brands influencer activity (by social platform)
Sponsored posts by platform
Among these brands, OLLY leads on Instagram and Goli leads on TikTok and YouTube. The gap is most notable on TikTok, with Goli at 39.4k, Sports Research at 3.4k, OLLY at 1.8k posts. Sports Research's activity is particularly concentrated on TikTok. Goli has substantially more TikTok posts than Sports Research and OLLY.
By geographical market
Sports Research vs. related brands influencer activity (by country)
Estimated sponsored posts in Sports Research's top markets
Goli has the highest estimated sponsored-post volume in United States (27k posts, 67.3%), Brazil (1.9k posts, 4.8%), Canada (1.8k posts, 4.4%), suggesting a North America focus, while Sports Research leads in India with 162 posts (4%), while OLLY leads in United Kingdom with 109 posts (4.1%). Looking at United States specifically, the split is Goli at 27k posts (67.3%), Sports Research at 2.8k posts (69.2%), OLLY at 2k posts (75.9%).
Read more influencer strategy breakdowns
Looking for more like this? Here are 5 similar influencer marketing strategy breakdowns for other brands:
- OLLY's Influencer Marketing Strategy
- Goli's Influencer Marketing Strategy
- Christy Ng's Influencer Marketing Strategy
- Typology's Influencer Marketing Strategy
- The Lip Bar's Influencer Marketing Strategy
Or, if you want to access data like this for your own software or processes, take a look at Modash's API products:
Frequently asked questions
Scaling your influencer program?
When you outgrow your mishmash of spreadsheets & free tools, try Modash. Find & email influencers, track campaigns, ship products & more - all in one place.