Alani Nutrition Influencer Marketing Strategy
(2026 Data & Insights)
We analyzed 20.8k pieces of influencer content sponsored by Alani Nutrition over the last 12 months.
This report breaks down where & how Alani Nutrition invests in influencer marketing, which social platforms they prioritize, top geographical markets, and more.
The data in this report comes from Modash's Brand Collaborations API.
P.S. for a simple list of influencers who have collaborated with Alani Nutrition, see here: Alani Nutrition influencers.
Influencer activity throughout the year
Alani Nutrition's influencer campaigns are active year-round with notable month-to-month fluctuation. The chart below shows month-by-month data for total sponsored posts tracked.
Alani Nutrition's influencer activity by month
Number of sponsored posts
Alani Nutrition's sponsored post volume peaks in January with 3k posts, 75% higher than the monthly average of 1.7k. June recorded the lowest activity at 686 posts, 60% below average.
Social platforms breakdown
In our dataset (which only includes Instagram, YouTube, and TikTok), this is how the volume of Alani Nutrition's sponsored influencer collaborations break down by social platform:
- TikTok: 20.7k posts (99.5%)
- YouTube: 102 posts (0.5%)
Alani Nutrition's influencer activity by platform
Share of sponsored content by social network
TikTok influencer marketing is a clear focus for Alani Nutrition.
Here are 2 examples of Alani Nutrition's recent sponsored collaborations (one each for TikTok, YouTube).
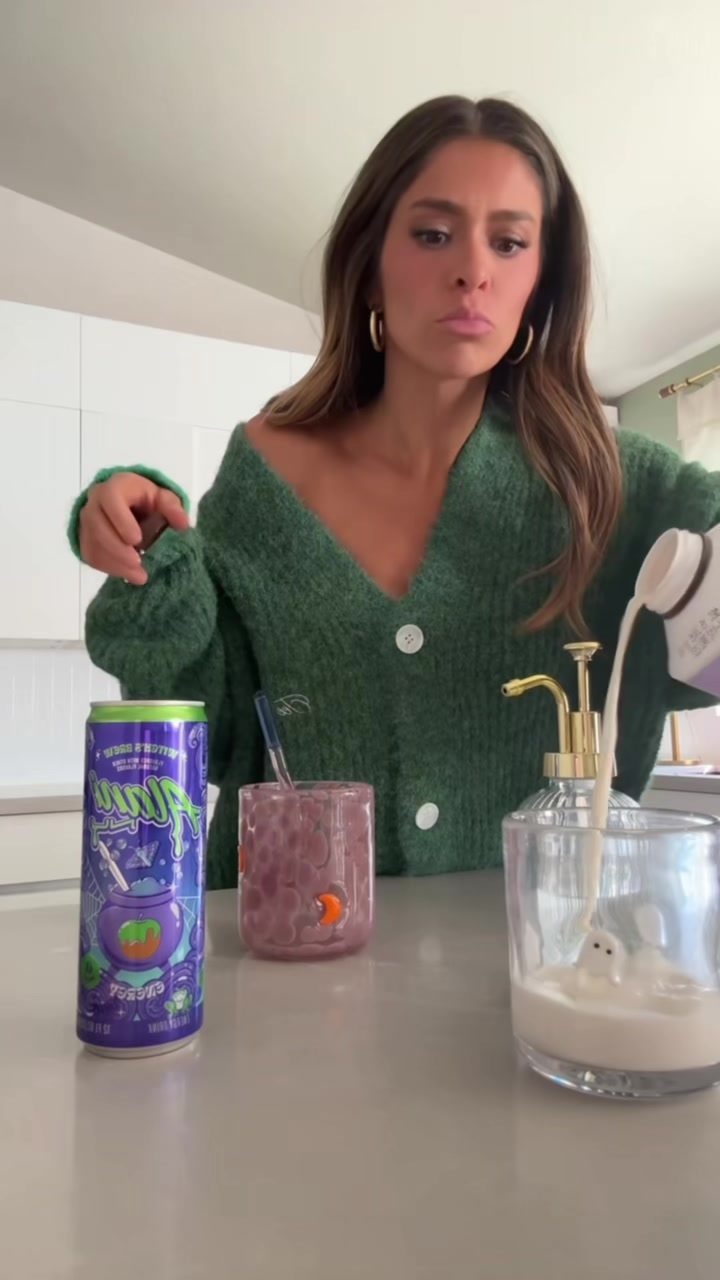
karina_a.gomez x Alani Nutrition
![TikTok post by @karina_a.gomez for Alani Nutrition. Caption reads: [...] and that chicken took forever 😭 @Alani....](https://images.od.modash.io/5cfd1dcb5ae5e3e173c8be9890d8272d1d84cf79)
Influencer bio
Twin Mommy 🎀 📧: karina@undercurrent.net IG: karina_a.gomez
Collaboration metrics
Get a free trial to find more data on influencer audiences, performance, and collaborations.
ClaudiaMarieWalsh x Alani Nutrition
Influencer bio
business email: claudia@honeyandivorytalent.com
Collaboration metrics
Get a free trial to find more data on influencer audiences, performance, and collaborations.
If you break this down further by content type on TikTok, this is what it looks like:
- Videos: 93.9%
- Carousels: 6.1%
💡 Related resource: How To Find TikTok Influencers.
Influencer audience size breakdown (by views)
For their top social platform (TikTok), here is a breakdown of the type of influencers Alani Nutrition are collaborating with, by audience size.
Note: this breakdown is based on each influencer's average views (not follower/subscriber count), because views typically correlate more closely with influencer pricing and impact.
Alani Nutrition's influencers average views (TikTok)
Based on each influencer's average views per post
With 40.1% of partnerships featuring creators averaging 1K-5K views, Alani Nutrition's strategy suggests niche targeting and authenticity, likely leveraging collaboration models like gifting and affiliates to work with smaller creators.
Here is an example of a sponsored collaboration with a larger-audience creator on TikTok (520.5k avg views/post):
wadebrynn x Alani Nutrition
Influencer bio
THIS IS MY ONLY ACCOUNT!!
Collaboration metrics
Get a free trial to find more data on influencer audiences, performance, and collaborations.
And here is another example with a smaller creator on TikTok (9.8k avg views/post):
laurenhunter.jpg x Alani Nutrition
Influencer bio
Probs at a concert! Nashville 🪩✨🥂 💌laurenhunter.info@gmail.com insta-->laurenhunter.jpg
Collaboration metrics
Get a free trial to find more data on influencer audiences, performance, and collaborations.
Alani Nutrition's repeat partnerships
Out of 8.4k unique influencers in our dataset, 754 of them (9%) posted content for Alani Nutrition in 3 or more separate calendar months. The most consistent partner is @laniekristin, who has collaborated across 12 months with 198 total posts.
Here are 3 examples of Alani Nutrition's repeat influencer partnerships, with links to the sponsored content.
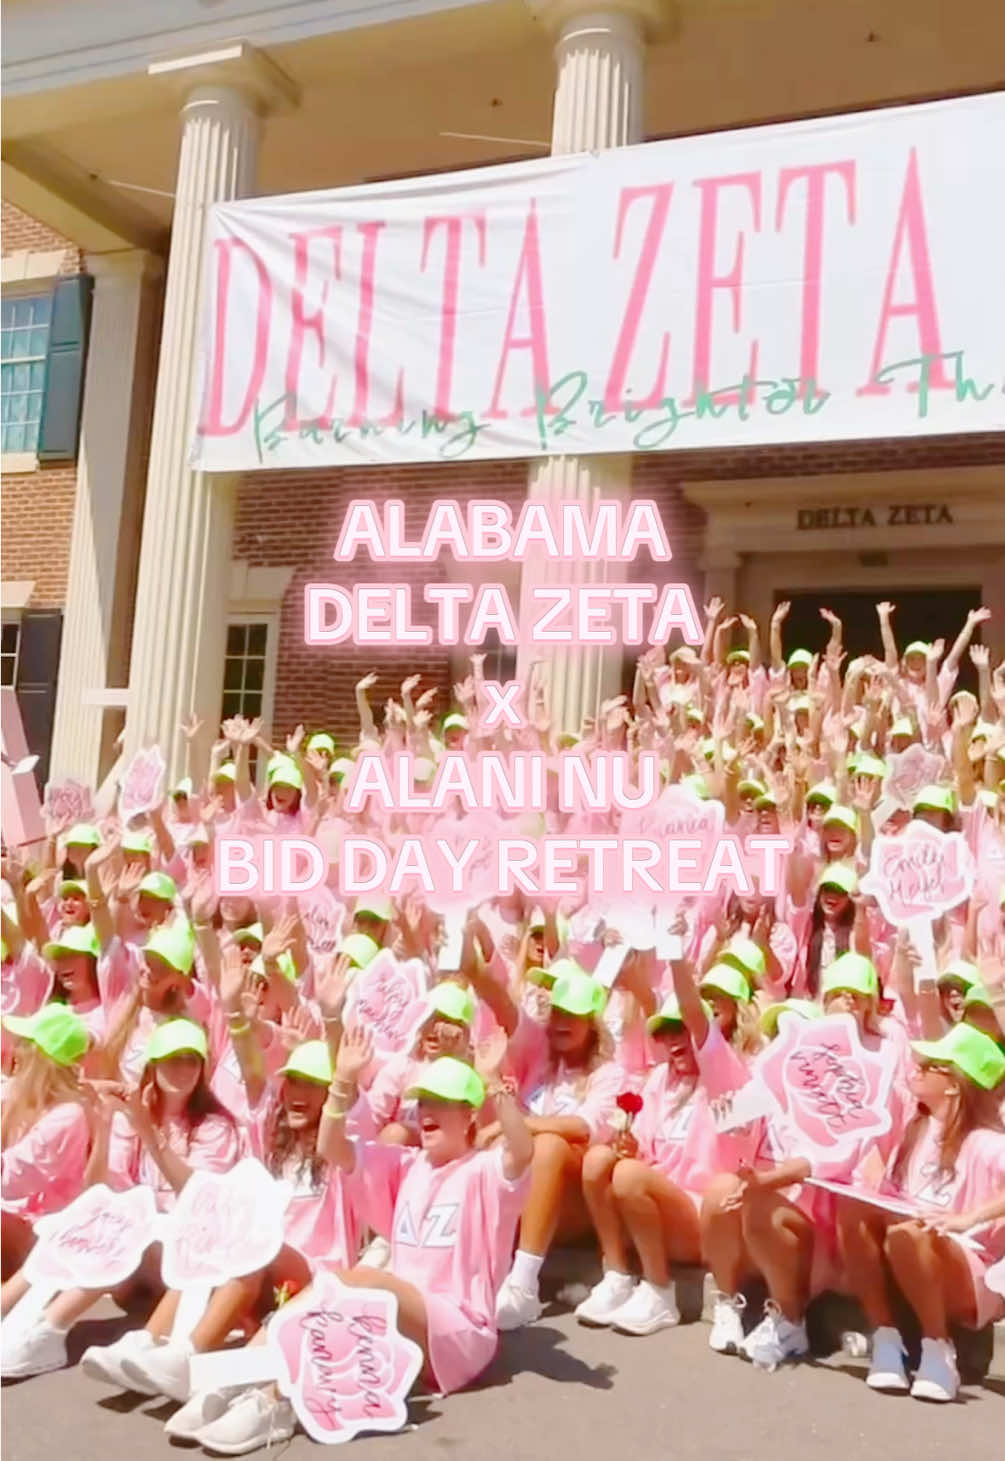
laniekristin x Alani Nutrition
![TikTok post by @laniekristin for Alani Nutrition. Caption reads: [...] of tennessee!!!💕✨🌈🧡 @Alani Nutrition....](https://images.od.modash.io/d11793a59a19cca28622e71fd8fde9ce328538cc)
![TikTok post by @laniekristin for Alani Nutrition. Caption reads: [...] my new fav thing ever!!!✨ @Alani Nutrition....](https://images.od.modash.io/ade971be42ff053f7f14ee3772d1ee15aae1cb7b)
![TikTok post by @laniekristin for Alani Nutrition. Caption reads: [...] @Alani Nu Ambassadors @Alani Nutrition.](https://images.od.modash.io/e2a2d3da1a6acf26bff49d37f8e5cd0428f48b85)
followkristenfriend x Alani Nutrition
![TikTok post by @followkristenfriend for Alani Nutrition. Caption reads: [...] @Leah Lockard @Alani Nutrition @Crocs....](https://images.od.modash.io/5e35f505cf2082c6859c9995955ea477cbf6c514)
![TikTok post by @followkristenfriend for Alani Nutrition. Caption reads: [...] #unpackwithme #cleantok @Alani Nutrition....](https://images.od.modash.io/51b62da34b59fdea5fc2b799eae8cfd8a3f5f932)
![TikTok post by @followkristenfriend for Alani Nutrition. Caption reads: [...] #tiktokteacher @Alani Nutrition....](https://images.od.modash.io/d4a29dfd1f96d4c8f8747484acc24aa264bca292)
karlynewberry x Alani Nutrition
![TikTok post by @karlynewberry for Alani Nutrition. Caption reads: [...] is permanent!! ☁️🍓💕 @Alani Nutrition....](https://images.od.modash.io/8164c3c762a86f7955f37d4a97c6de6c2048e201)
💡 Related resource: Long-Term Influencer Partnerships: Pros, Cons & How The Pros Manage Them.
Geographical breakdown
In our dataset, United States is where Alani Nutrition had the most influencer activity. 78.9% of their live influencer content in the last 12 months was posted by American influencers.
Based on the percentage of influencer content per market, other important markets include:
- Canada (7.7%)
- United Kingdom (6.6%)
- Australia (2.9%)
Alani Nutrition's influencer activity by market
Here is another example of Alani Nutrition collaborating with an influencer in United States.
taylorfrankiepaul x Alani Nutrition
Alani Nutrition's influencer activity vs. related brands
Alani Nutrition competes with Bloom Nutrition and Women’s Best in the fitness-leaning supplements space, targeting similar wellness and gym communities. All three are known for performance and lifestyle positioning amplified through creator partnerships and affiliate-style promotions.
Total influencer content
Alani Nutrition vs. related brands influencer activity
Total sponsored posts tracked (last 12 months)
Bloom Nutrition leads with 37.6k sponsored posts, significantly outpacing Alani Nutrition (20.8k posts) and Women's Best (12.9k posts). Across all three brands, the average volume is 23.8k posts, indicating mature, scaled influencer programs.
By social platform
Alani Nutrition vs. related brands influencer activity (by social platform)
Sponsored posts by platform
Among these brands, Women's Best leads on Instagram and YouTube and Bloom Nutrition leads on TikTok. The gap is most notable on TikTok, with Bloom Nutrition at 37.5k, Alani Nutrition at 20.7k, Women's Best at 2.8k posts. Alani Nutrition's activity is particularly concentrated on TikTok. Women's Best has far more Instagram posts than Alani Nutrition and Bloom Nutrition.
By geographical market
Alani Nutrition vs. related brands influencer activity (by country)
Estimated sponsored posts in Alani Nutrition's top markets
Bloom Nutrition has the highest estimated sponsored-post volume in United States (29k posts, 77.1%), Canada (2.6k posts, 7%), United Kingdom (1.8k posts, 4.8%), suggesting a North America focus, while Women's Best leads in France with 720 posts (5.6%). Looking at United States specifically, the split is Bloom Nutrition at 29k posts (77.1%), Alani Nutrition at 16k posts (78.9%), Women's Best at 6.2k posts (47.8%).
Read more influencer strategy breakdowns
Looking for more like this? Here are 5 similar influencer marketing strategy breakdowns for other brands:
- Bloom Nutrition's Influencer Marketing Strategy
- Women's Best's Influencer Marketing Strategy
- Nike's Influencer Marketing Strategy
- Ugreen's Influencer Marketing Strategy
- Native Pet's Influencer Marketing Strategy
Or, if you want to access data like this for your own software or processes, take a look at Modash's API products:
Frequently asked questions
Scaling your influencer program?
When you outgrow your mishmash of spreadsheets & free tools, try Modash. Find & email influencers, track campaigns, ship products & more - all in one place.