Ugreen Influencer Marketing Strategy
(2026 Data & Insights)
We analyzed 2.6k pieces of influencer content sponsored by Ugreen over the last 12 months.
This report breaks down where & how Ugreen invests in influencer marketing, which social platforms they prioritize, top geographical markets, and more.
The data in this report comes from Modash's Brand Collaborations API.
P.S. for a simple list of influencers who have collaborated with Ugreen, see here: Ugreen influencers.
Influencer activity throughout the year
Ugreen's influencer campaigns are active year-round with notable month-to-month fluctuation. The chart below shows month-by-month data for total sponsored posts tracked.
Ugreen's influencer activity by month
Number of sponsored posts
Ugreen's sponsored post volume appears to trend upward over the 12-month period, rising from 135 posts in January to 197 in December. The peak month, June, reached 374 posts, 76% higher than the monthly average of 213.
Social platforms breakdown
In our dataset (which only includes Instagram, YouTube, and TikTok), this is how the volume of Ugreen's sponsored influencer collaborations break down by social platform:
- Instagram: 1.2k posts (46.8%)
- TikTok: 932 posts (35.2%)
- YouTube: 475 posts (18%)
Ugreen's influencer activity by platform
Share of sponsored content by social network
Content format by platform
Share of all sponsored posts.
Instagram influencer marketing is a clear focus for Ugreen.
Here are 3 examples of Ugreen's recent sponsored collaborations (one each for Instagram, TikTok, YouTube).
iqbaal.e x Ugreen
![Instagram post by @iqbaal.e for Ugreen. Caption reads: [...] Bersama Iqbaal Ramadhan @iqbaal.e dan....](https://images.od.modash.io/eceaaacda90681956c40a6dc9b5e229cfbf5b80a)
Influencer bio
@baale @idr.manajemen 💥OPERASI PESTA PORA💥 2026.
Collaboration metrics
Get a free trial to find more data on influencer audiences, performance, and collaborations.
jc_cozyofficeaesthetic x Ugreen
![TikTok post by @jc_cozyofficeaesthetic for Ugreen. Caption reads: [...] perfectly with my pink set up 🥹💗....](https://images.od.modash.io/d120ebaea22843d7089f16f0bdffb9c6dda5f95a)
Influencer bio
office aesthetic ✨ home office finds ✨keyboards my favorite find finds below ⤵️
Collaboration metrics
Get a free trial to find more data on influencer audiences, performance, and collaborations.
Bricolagecestcool x Ugreen
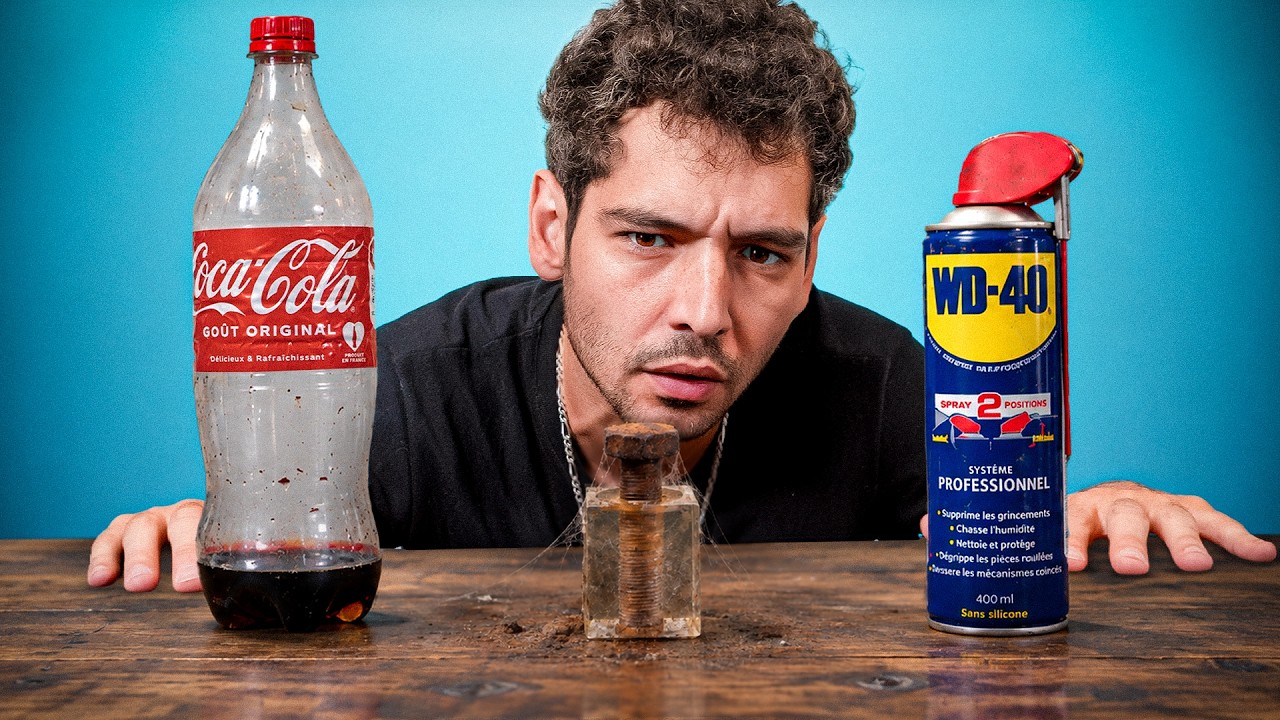
Influencer bio
Ingénieur Bricoleur 🍷 Ici pour vous montrer des projets cools et essayer de vous transmettre des connaissances ! L'ingénierie, c'est juste du bricolage avec un peu de méthode👌🏼
Collaboration metrics
Get a free trial to find more data on influencer audiences, performance, and collaborations.
If you break this down further by content type on Instagram, this is what it looks like:
- Reels: 89%
- Posts: 11%
💡 Related resource: How To Find Instagram Influencers.
Influencer audience size breakdown (by views)
For their top social platform (Instagram), here is a breakdown of the type of influencers Ugreen are collaborating with, by audience size.
Note: this breakdown is based on each influencer's average views (not follower/subscriber count), because views typically correlate more closely with influencer pricing and impact.
Ugreen's influencers average views (Instagram)
Based on each influencer's average views per post
With 37.8% of partnerships featuring creators averaging 10K-50K views, Ugreen's strategy suggests cost-efficiency and engagement-focused partnerships.
Here is an example of a sponsored collaboration with a larger-audience creator on Instagram (432.3k avg views/post):
alialrz1 x Ugreen
![Instagram post by @alialrz1 for Ugreen. Caption reads: [...] charging. Clean design. No compromises.....](https://images.od.modash.io/671ad7cbd1c4395636de23a199bbb7d9fbf75afe)
Influencer bio
Personal Brand Content in Dubai 🎥 For Founders, Creators & High-level Clients DM “BRAND” to build your Presence ✉️ Campaigns: info@alialrz.com
Collaboration metrics
Get a free trial to find more data on influencer audiences, performance, and collaborations.
And here is another example with a smaller creator on Instagram (9.8k avg views/post):
thegrandtest x Ugreen
![Instagram post by @thegrandtest for Ugreen. Caption reads: [...] testé le dock le plus complet de 2026....](https://images.od.modash.io/41c14834b8d3d564bf13597cd3999e5c05e347e5)
Influencer bio
On teste des produits tech et on partage nos bons plans, et astuces📱💻🛴🎧 327k sur YouTube Suivez-nous ici ⬇️
Collaboration metrics
Get a free trial to find more data on influencer audiences, performance, and collaborations.
Ugreen's repeat partnerships
Out of 1.8K unique influencers in our dataset, 73 of them (4%) posted content for Ugreen in 3 or more separate calendar months. The most consistent partner is @suguru.tool, who has collaborated across 6 months with 7 total posts.
Here are 3 examples of Ugreen's repeat influencer partnerships, with links to the sponsored content.
suguru.tool x Ugreen
![Instagram post by @suguru.tool for Ugreen. Caption reads: [...] 提供:UGREEN JAPAN [...].](https://images.od.modash.io/2325ff9bfb5e0f700999b15f42536082913c89d4)
![Instagram post by @suguru.tool for Ugreen. Caption reads: 卵よりも小さい65W充電器があのUGREENから登場!「UGREEN Airシリーズ」 [...].](https://images.od.modash.io/7aeaa151db0c8f36ee4570cdd7b33a02bec326c5)
![Instagram post by @suguru.tool for Ugreen. Caption reads: 2025年、UGREEN製品の中 @ugreen_japan [...].](https://images.od.modash.io/05279cf1225a20565674872d02ed678f4945e7ce)
jc_cozyofficeaesthetic x Ugreen
![TikTok post by @jc_cozyofficeaesthetic for Ugreen. Caption reads: @UGREEN.US nails it every. single. [...].](https://images.od.modash.io/fa72aa9d00c144fc85602fefb4a6c8d0b92a8da6)
![TikTok post by @jc_cozyofficeaesthetic for Ugreen. Caption reads: [...] a fraction of the price 💕✨ @UGREEN.US....](https://images.od.modash.io/05bccc7530ce04abd4ce8c3412575bde1f634412)
sciencegamingtv x Ugreen

![Instagram post by @sciencegamingtv for Ugreen. Caption reads: [...] Pro et HomeAgent HA100 par @ugreenfr 🏠....](https://images.od.modash.io/3228f35c006886192d5b1de1fa3be81696e8de22)
![Instagram post by @sciencegamingtv for Ugreen. Caption reads: [...] 😱 Découvre les trackers @ugreenfr dès 15€....](https://images.od.modash.io/e5837ca0e100f8ca18affc8a89574eba32868342)
💡 Related resource: Long-Term Influencer Partnerships: Pros, Cons & How The Pros Manage Them.
Geographical breakdown
In our dataset, United States is where Ugreen had the most influencer activity. 14.5% of their live influencer content in the last 12 months was posted by American influencers.
Based on the percentage of influencer content per market, other important markets include:
- Japan (12.7%)
- Germany (7.6%)
- Brazil (6.9%)
Ugreen's influencer activity by market
Here is another example of Ugreen collaborating with an influencer in United States.
skyboimc x Ugreen
![YouTube post by @skyboimc for Ugreen. Caption reads: UGREEN x Honkai: Star Rail Series (Up to 30% [...].](https://images.od.modash.io/8dc1b007341326c7bf2befde4372b763f3f3e9d2)
Ugreen's influencer activity vs. related brands
INIU and TORRAS are close competitors to Ugreen in consumer electronics accessories like chargers, power banks, cables, and phone cases, often competing across the same ecommerce channels. Their similar product positioning and price tiers make them realistic benchmarks for influencer marketing strategy.
Total influencer content
Ugreen vs. related brands influencer activity
Total sponsored posts tracked (last 12 months)
TORRAS leads with 3.5K sponsored posts, significantly outpacing Ugreen (2.6K posts) and INIU (1.1K posts). Across all three brands, the average volume is 2.4K posts, indicating mature, scaled influencer programs. TORRAS has several times more total posts than INIU, while Ugreen sits between them.
By social platform
Ugreen vs. related brands influencer activity (by social platform)
Sponsored posts by platform
Ugreen leads on TikTok and YouTube, while TORRAS leads on Instagram. The gap is most notable on Instagram, with TORRAS at 2.7K, Ugreen at 1.2K, INIU at 547 posts. TORRAS's activity is particularly concentrated on Instagram. On Instagram, TORRAS has multiple times more posts than both Ugreen and INIU.
By geographical market
Ugreen vs. related brands influencer activity (by country)
Estimated sponsored posts in Ugreen's top markets
TORRAS has the highest estimated sponsored-post volume in United States (962 posts, 27.4%), Japan (576 posts, 16.4%), India (365 posts, 10.4%), suggesting a Asia focus, while Ugreen leads in Germany with 201 posts (7.6%), while INIU leads in Turkey with 116 posts (10.8%). Looking at United States specifically, the split is TORRAS at 962 posts (27.4%), Ugreen at 383 posts (14.5%), INIU at 318 posts (29.7%). Ugreen's strength in Germany may indicate a home-market focus, while TORRAS shows broader regional investment.
Read more influencer strategy breakdowns
Looking for more like this? Here are 5 similar influencer marketing strategy breakdowns for other brands:
- TORRAS's Influencer Marketing Strategy
- PrettyGarden's Influencer Marketing Strategy
- KILLSTAR's Influencer Marketing Strategy
- Beekman 1802's Influencer Marketing Strategy
- Hidratei's Influencer Marketing Strategy
Or, if you want to access data like this for your own software or processes, take a look at Modash's API products:
Frequently asked questions
Scaling your influencer program?
When you outgrow your mishmash of spreadsheets & free tools, try Modash. Find & email influencers, track campaigns, ship products & more - all in one place.