drinknello Influencer Marketing Strategy
(2026 Data & Insights)
We analyzed 10.2k pieces of influencer content sponsored by drinknello over the last 12 months.
This report breaks down where & how drinknello invests in influencer marketing, which social platforms they prioritize, top geographical markets, and more.
The data in this report comes from Modash's Brand Collaborations API.
P.S. for a simple list of influencers who have collaborated with drinknello, see here: drinknello influencers.
Influencer activity throughout the year
drinknello's influencer campaigns are active year-round with notable month-to-month fluctuation. The chart below shows month-by-month data for total sponsored posts tracked.
drinknello's influencer activity by month
Number of sponsored posts
drinknello's influencer output appears relatively consistent throughout the year, averaging about 846 sponsored posts per month. January recorded the highest volume at 1.3k posts (53% above average), while May was the quietest at 385 posts.
Social platforms breakdown
In our dataset (which only includes Instagram, YouTube, and TikTok), this is how the volume of drinknello's sponsored influencer collaborations break down by social platform:
- TikTok: 10.0k posts (97.6%)
- Instagram: 242 posts (2.4%)
- YouTube: 2 posts (0%)
drinknello's influencer activity by platform
Share of sponsored content by social network
TikTok influencer marketing is a clear focus for drinknello.
Here are 3 examples of drinknello's recent sponsored collaborations (one each for Instagram, TikTok, YouTube).
aspynovard x drinknello
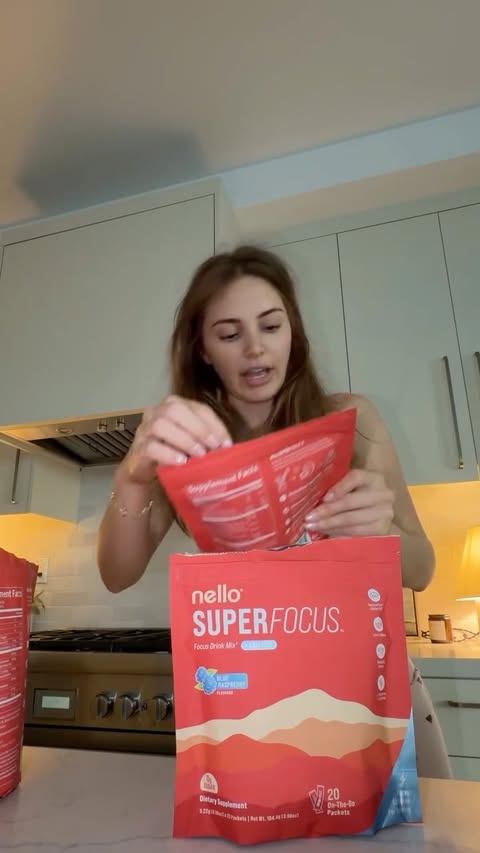
Influencer bio
youtube & tiktok: @aspynovard 🍒💌🍷🎧🧸🌈🍓🍰🤍💋
Collaboration metrics
Get a free trial to find more data on influencer audiences, performance, and collaborations.
romebaby x drinknello
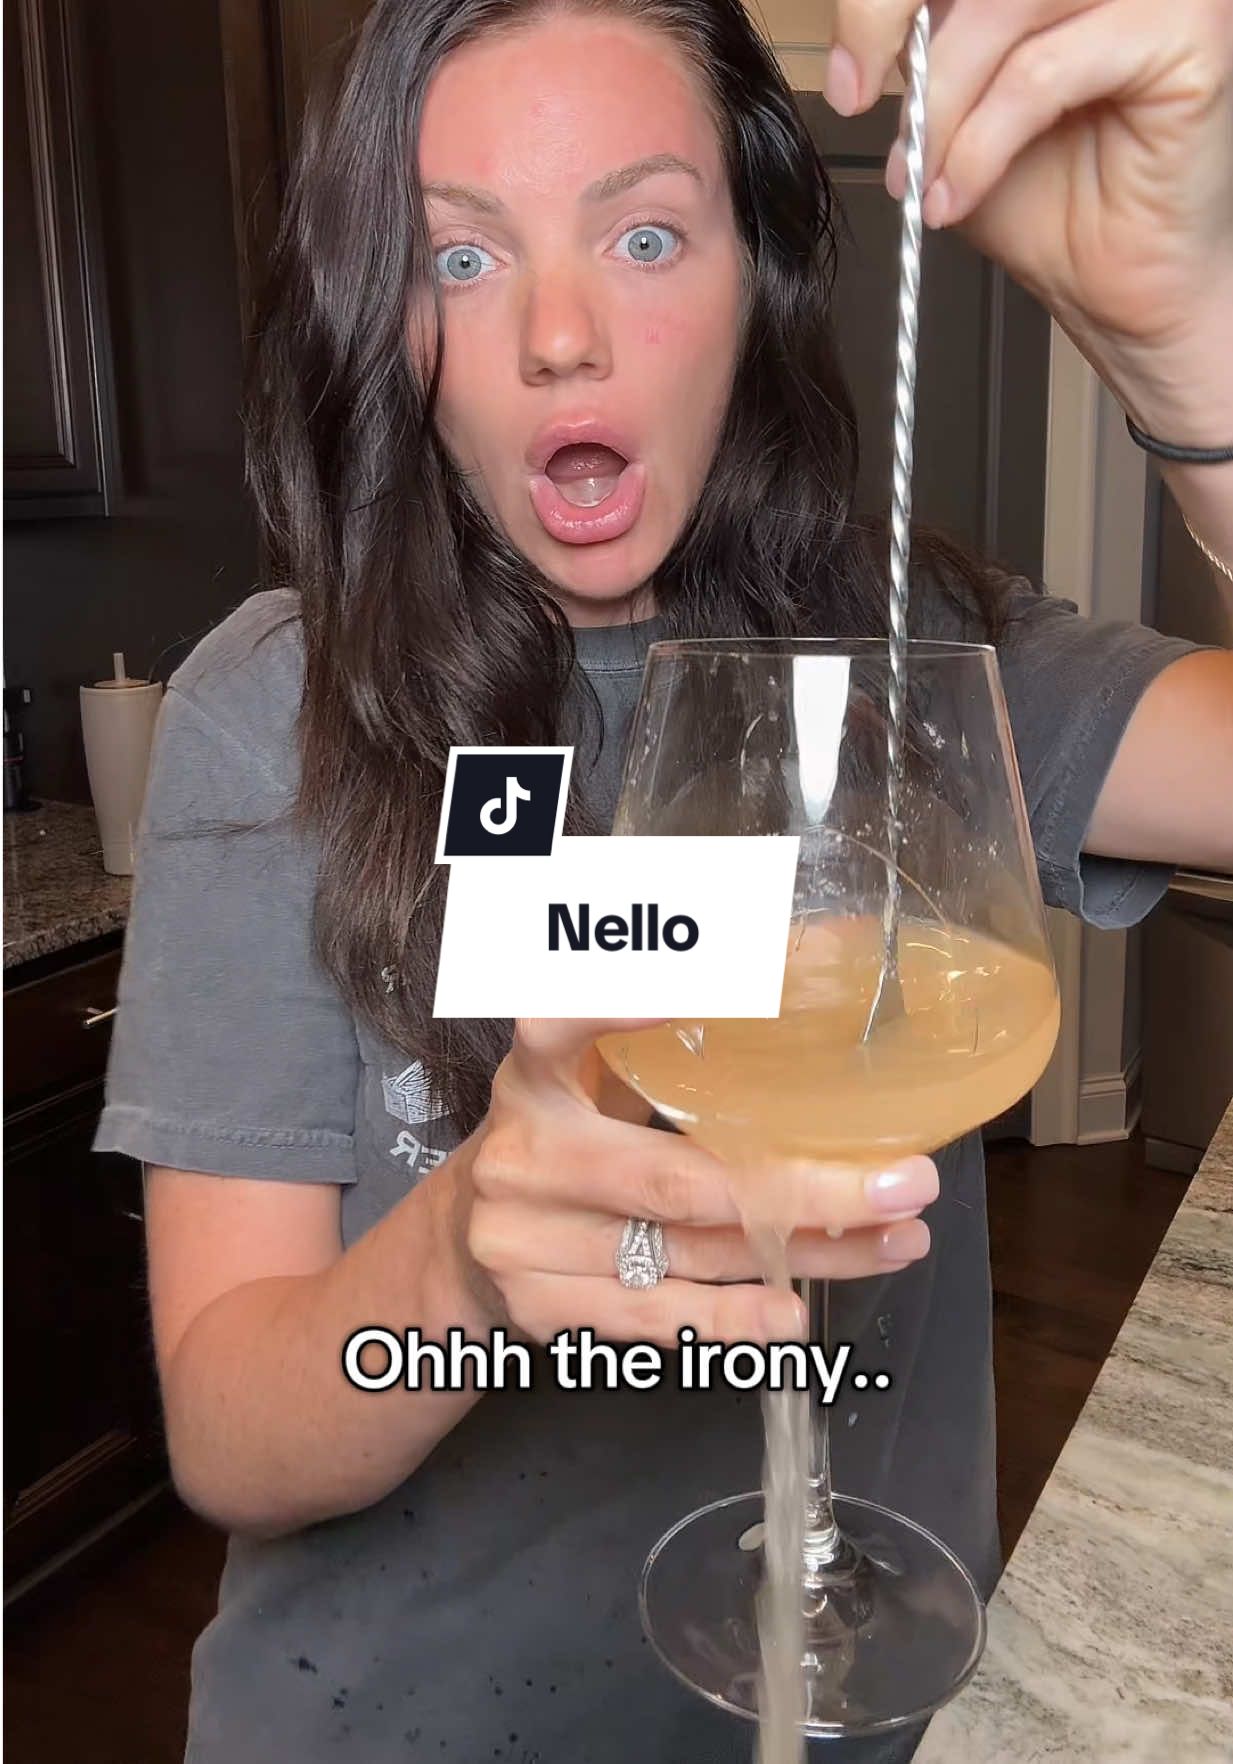
Influencer bio
Skincare + beauty + trending finds ✨ Your perfect routine, simplified🤍 📧 Romebaby20@yahoo.com
Collaboration metrics
Get a free trial to find more data on influencer audiences, performance, and collaborations.
GretchenGeraghty7 x drinknello
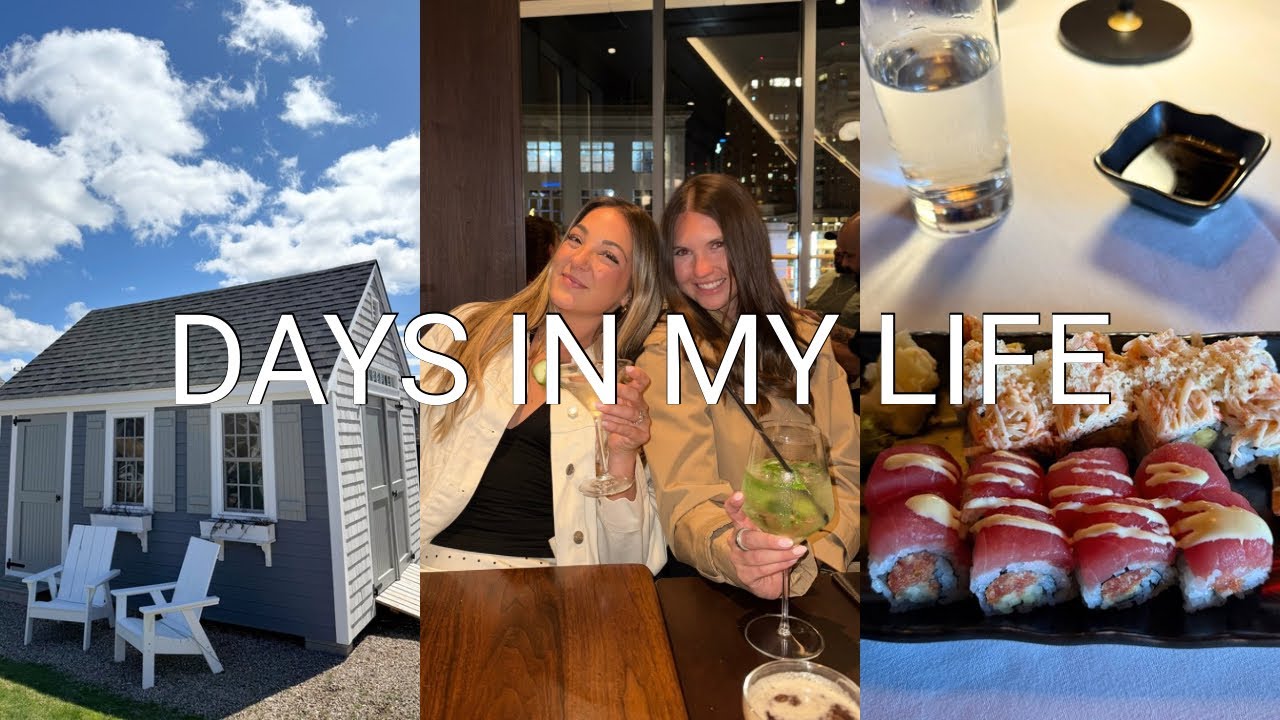
Influencer bio
Hi, I'm Gretchen and I make videos about fashion, beauty, lifestyle, fitness, and travel. Im 25 years old and have a lot of fun making my YouTube videos. I hope you enjoy & don't forget to subscribe :) **you can contact me at: contact@tablerockmanagement.com (business only please)
Collaboration metrics
Get a free trial to find more data on influencer audiences, performance, and collaborations.
If you break this down further by content type on TikTok, this is what it looks like:
- Videos: 94.6%
- Carousels: 5.4%
💡 Related resource: How To Find TikTok Influencers.
Influencer audience size breakdown (by views)
For their top social platform (TikTok), here is a breakdown of the type of influencers drinknello are collaborating with, by audience size.
Note: this breakdown is based on each influencer's average views (not follower/subscriber count), because views typically correlate more closely with influencer pricing and impact.
drinknello's influencers average views (TikTok)
Based on each influencer's average views per post
With 78.7% of partnerships featuring creators averaging <1K views, drinknello's strategy suggests niche targeting and authenticity, likely leveraging collaboration models like gifting and affiliates to work with smaller creators.
Here is an example of a sponsored collaboration with a larger-audience creator on TikTok (398.0k avg views/post):
shopwithgraciegirl x drinknello
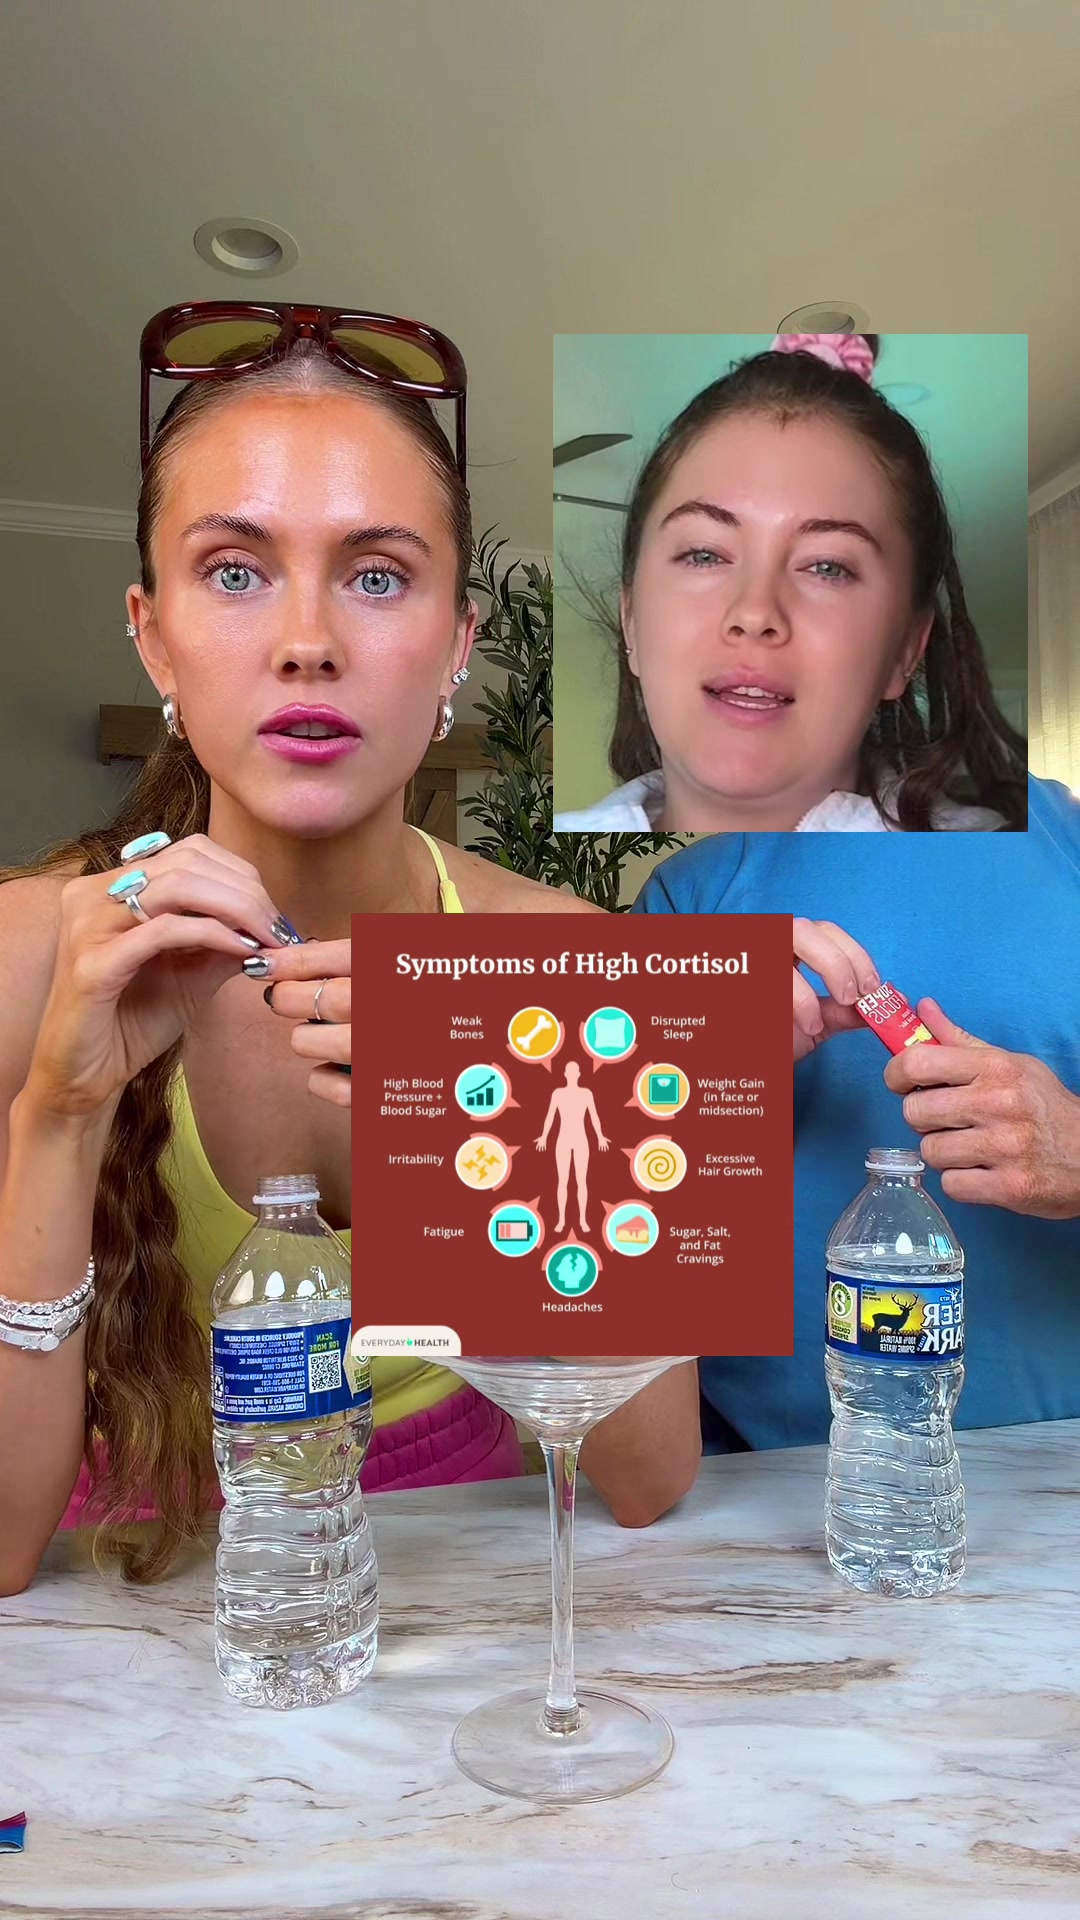
Influencer bio
All my fav TikTok Shop finds 🏝️🌞🧜🏼♀️🌺✨ Health/wellness/Beauty Thegraciecollins@gmail.com
Collaboration metrics
Get a free trial to find more data on influencer audiences, performance, and collaborations.
And here is another example with a smaller creator on TikTok (8.1k avg views/post):
karlaceliss x drinknello
Influencer bio
Aquí puro TikTok Shop 🇺🇸🛒🛍️ ✨ Beauty • Home ✨ 📧 info@karlacelis.com Cuenta personal 👉🏼 @Karla Celis 👈🏼
Collaboration metrics
Get a free trial to find more data on influencer audiences, performance, and collaborations.
drinknello's repeat partnerships
Out of 3.3k unique influencers in our dataset, 364 of them (11%) posted content for drinknello in 3 or more separate calendar months. The most consistent partner is @messyparenting, who has collaborated across 11 months with 67 total posts.
Here are 3 examples of drinknello's repeat influencer partnerships, with links to the sponsored content.
messyparenting x drinknello
pegbama x drinknello
joliolioliver x drinknello
💡 Related resource: Long-Term Influencer Partnerships: Pros, Cons & How The Pros Manage Them.
Geographical breakdown
In our dataset, United States is where drinknello had the most influencer activity. 82.2% of their live influencer content in the last 12 months was posted by American influencers.
Based on the percentage of influencer content per market, other important markets include:
- Canada (3.3%)
- Brazil (3.2%)
- Colombia (2.5%)
drinknello's influencer activity by market
Here is another example of drinknello collaborating with an influencer in United States.
abbyjdfit x drinknello
drinknello's influencer activity vs. related brands
drinknello sits in the better-for-you beverage space, closely aligned with OLIPOP and Poppi, which compete for the same health-leaning soda alternative audience through TikTok taste tests and lifestyle creators.
Total influencer content
drinknello vs. related brands influencer activity
Total sponsored posts tracked (last 12 months)
drinknello leads with 10.2k sponsored posts, marginally ahead of Poppi (9.5k posts) and OLIPOP (5.9k posts). Across all three brands, the average volume is 8.6k posts, indicating mature, scaled influencer programs.
By social platform
drinknello vs. related brands influencer activity (by social platform)
Sponsored posts by platform
drinknello leads on TikTok, while Poppi has the most activity on Instagram and OLIPOP has the most activity on YouTube. The gap is most notable on TikTok, with drinknello at 10k, Poppi at 6.7k, OLIPOP at 2.7k posts. drinknello's activity is particularly concentrated on TikTok. On TikTok, drinknello has more posts than OLIPOP and Poppi, while on Instagram and YouTube, drinknello has far fewer posts than both brands.
By geographical market
drinknello vs. related brands influencer activity (by country)
Estimated sponsored posts in drinknello's top markets
drinknello has the highest estimated sponsored-post volume in United States (8.4k posts, 82.2%), Brazil (327 posts, 3.2%), while Poppi has the highest estimated sponsored-post volume in Canada (630 posts, 6.6%), United Kingdom (420 posts, 4.4%). Looking at United States specifically, the split is drinknello at 8.4k posts (82.2%), Poppi at 7.4k posts (77.4%), OLIPOP at 4.8k posts (81.9%). drinknello's strength in United States may indicate a home-market focus, while Poppi shows broader regional investment.
Read more influencer strategy breakdowns
Looking for more like this? Here are 5 similar influencer marketing strategy breakdowns for other brands:
- OLIPOP's Influencer Marketing Strategy
- Poppi's Influencer Marketing Strategy
- HSIA Lingerie's Influencer Marketing Strategy
- T3 Micro's Influencer Marketing Strategy
- SodaStream's Influencer Marketing Strategy
Or, if you want to access data like this for your own software or processes, take a look at Modash's API products:
Frequently asked questions
Scaling your influencer program?
When you outgrow your mishmash of spreadsheets & free tools, try Modash. Find & email influencers, track campaigns, ship products & more - all in one place.