DrinkPrime Influencer Marketing Strategy
(2026 Data & Insights)
We analyzed 3.4k pieces of influencer content sponsored by DrinkPrime over the last 12 months.
This report breaks down where & how DrinkPrime invests in influencer marketing, which social platforms they prioritize, top geographical markets, and more.
The data in this report comes from Modash's Brand Collaborations API.
P.S. for a simple list of influencers who have collaborated with DrinkPrime, see here: DrinkPrime influencers.
Influencer activity throughout the year
DrinkPrime's influencer campaigns are active year-round with notable month-to-month fluctuation. The chart below shows month-by-month data for total sponsored posts tracked.
DrinkPrime's influencer activity by month
Number of sponsored posts
DrinkPrime's sponsored post volume appears to trend upward over the 12-month period, rising from 291 posts in January to 308 in December. The peak month, October, reached 434 posts, 52% higher than the monthly average of 285.
Social platforms breakdown
In our dataset (which only includes Instagram, YouTube, and TikTok), this is how the volume of DrinkPrime's sponsored influencer collaborations break down by social platform:
- Instagram: 2.2k posts (62.9%)
- TikTok: 1.3k posts (36.9%)
- YouTube: 9 posts (0.3%)
DrinkPrime's influencer activity by platform
Share of sponsored content by social network
Instagram influencer marketing is a clear focus for DrinkPrime.
Here are 2 examples of DrinkPrime's recent sponsored collaborations (one each for Instagram, TikTok).
loganpaul x DrinkPrime
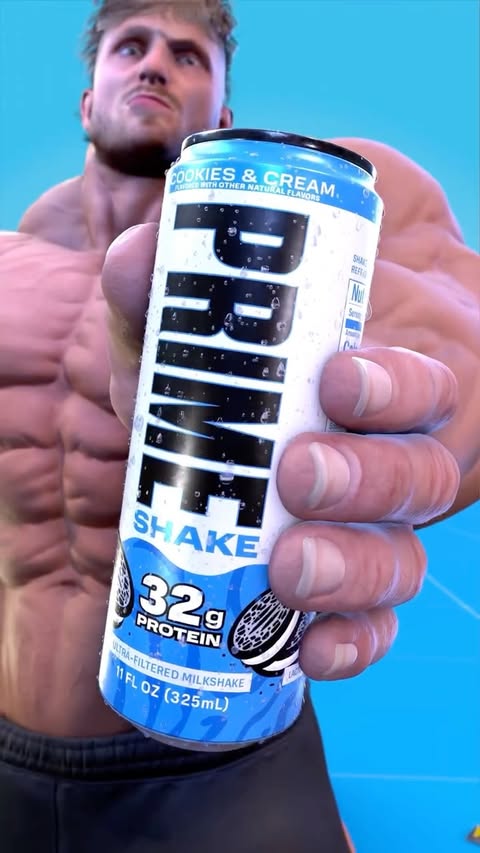
Influencer bio
artist — collector — wrestler founder @drinkprime @lunchly @ripit host @impaulsiveshow 👇Sign up to @Ripit for VIP early access
Collaboration metrics
Get a free trial to find more data on influencer audiences, performance, and collaborations.
mdmotivator x DrinkPrime
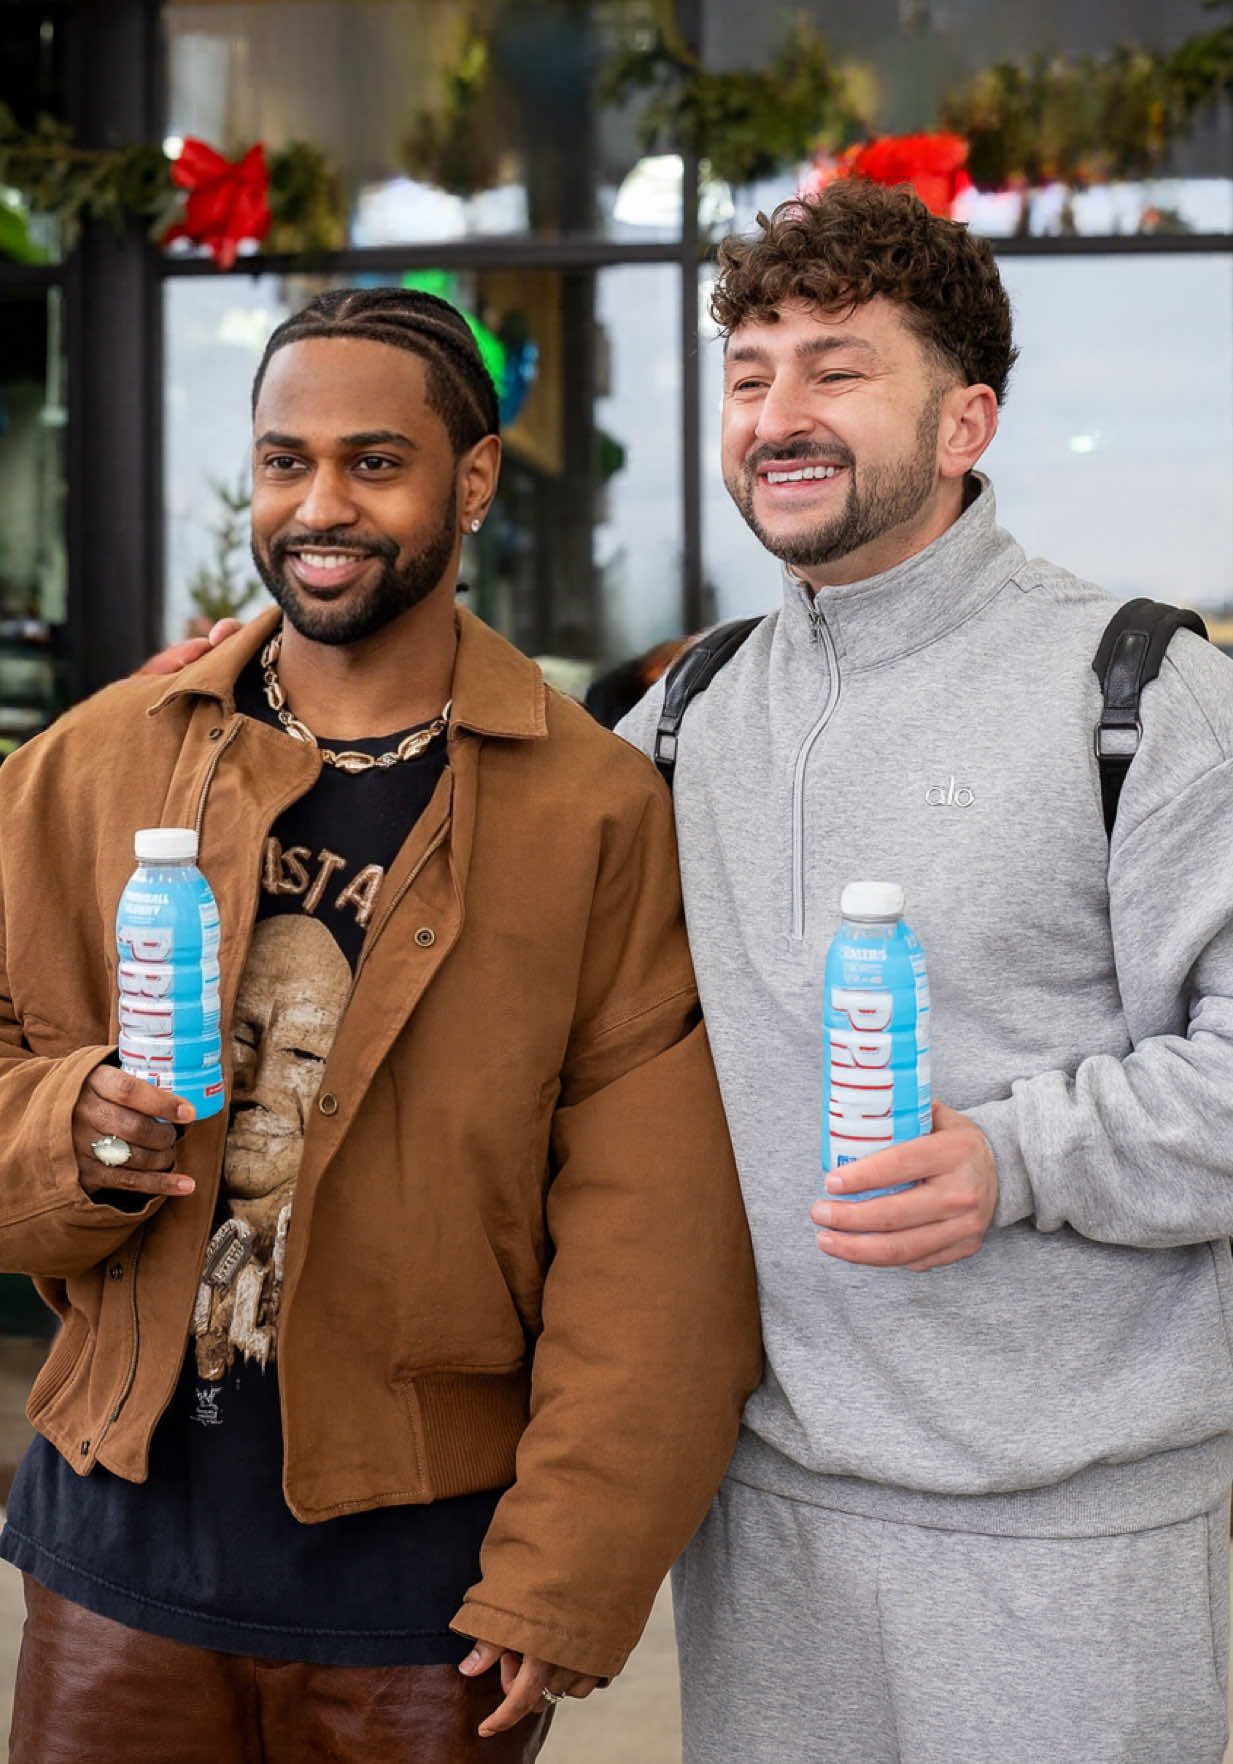
Influencer bio
📧 zachery@onefluent.com Kindness Is Cool ❤️
Collaboration metrics
Get a free trial to find more data on influencer audiences, performance, and collaborations.
If you break this down further by content type on Instagram, this is what it looks like:
- Reels: 65.5%
- Posts: 34.5%
💡 Related resource: How To Find Instagram Influencers.
Influencer audience size breakdown (by views)
For their top social platform (Instagram), here is a breakdown of the type of influencers DrinkPrime are collaborating with, by audience size.
Note: this breakdown is based on each influencer's average views (not follower/subscriber count), because views typically correlate more closely with influencer pricing and impact.
DrinkPrime's influencers average views (Instagram)
Based on each influencer's average views per post
With 31% of partnerships featuring creators averaging 10K-50K views, DrinkPrime's strategy suggests cost-efficiency and engagement-focused partnerships. The 1K-5K views segment is also prominent at 25.4%, indicating investment across adjacent tiers.
Here is an example of a sponsored collaboration with a larger-audience creator on Instagram (5.4M avg views/post):
ksi x DrinkPrime
![Instagram post by @ksi for DrinkPrime. Caption reads: [...] Exclusively at @circlekstores #DRINKPRIME....](https://images.od.modash.io/df261c7bac8ea0d06644dfecb0c9887f2144f240)
Influencer bio
Co-owner of @daggersfcofficial Founder of @drinkprime @lunchly @misfitsboxing @mfproboxing Manager of @primefc
Collaboration metrics
Get a free trial to find more data on influencer audiences, performance, and collaborations.
And here is another example with a smaller creator on Instagram (4.8k avg views/post):
lolagfdez x DrinkPrime
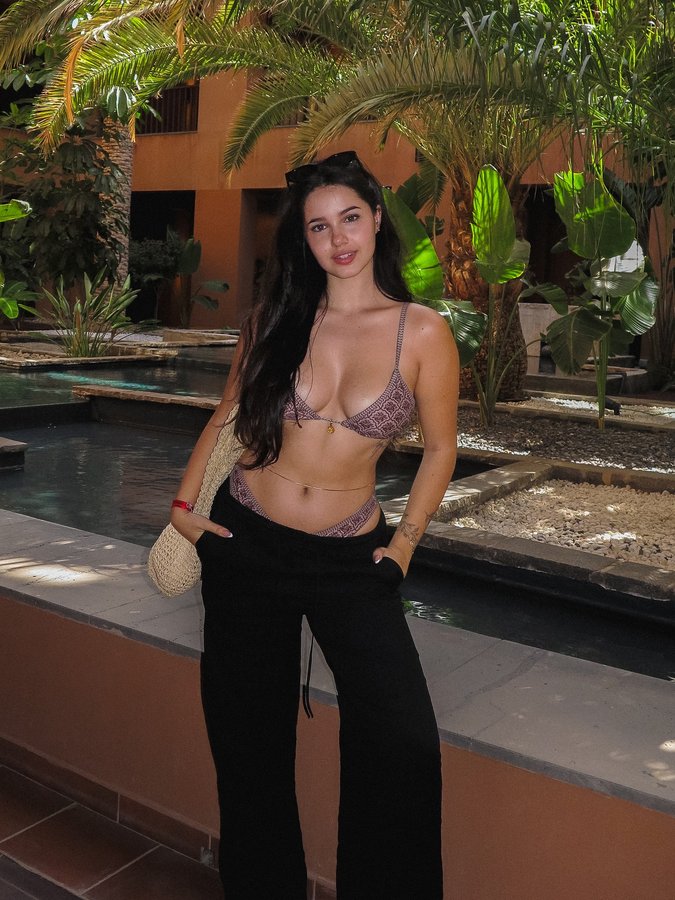
Influencer bio
Pharmacist & UGC creator Mornings in a lab coat and afternoons in full glam Tenerife,Spain Work: lola.gonzalezfdez@gmail.com
Collaboration metrics
Get a free trial to find more data on influencer audiences, performance, and collaborations.
DrinkPrime's repeat partnerships
Out of 1.6k unique influencers in our dataset, 66 of them (4%) posted content for DrinkPrime in 3 or more separate calendar months. The most consistent partner is @primenewsclips, who has collaborated across 11 months with 357 total posts. @primenewsclips alone accounts for 10% of all tracked sponsored content.
Here are 3 examples of DrinkPrime's repeat influencer partnerships, with links to the sponsored content.
primenewsclips x DrinkPrime
![TikTok post by @primenewsclips for DrinkPrime. Caption reads: [...] : @PRIME @IMPAULSIVE ) #drinkprime #Prime....](https://images.od.modash.io/92669f9ee7b0a0005eeafdf66bc3ab20e392aab6)
![TikTok post by @primenewsclips for DrinkPrime. Caption reads: [...] (Credit : @Sky Bri @PRIME ) #drinkprime....](https://images.od.modash.io/65c062797521f3921d4409b44bee1ff575509505)
![TikTok post by @primenewsclips for DrinkPrime. Caption reads: [...] @PRIME ) #loganpaul #vlog #drinkprime #wwe....](https://images.od.modash.io/c95708d23fb9f31093fde7ad293ef874a7687b92)
deniskozhukhovofficial x DrinkPrime
![Instagram post by @deniskozhukhovofficial for DrinkPrime. Caption reads: [...] parte de Unboxing Gifts de @drinkprime 💧🔝....](https://images.od.modash.io/855bd9cf348fe95ebcd0cddb7315eb3c904f402e)
![Instagram post by @deniskozhukhovofficial for DrinkPrime. Caption reads: [...] 🎄🎁 @puma @spain_rg @drinkprime . . . . . .....](https://images.od.modash.io/6e9fd3eaef47f4f8e956320c2ab6663a54642c78)
![Instagram post by @deniskozhukhovofficial for DrinkPrime. Caption reads: [...] del nuevo sabor de 🔵🔴 @drinkprime 🔝 . . .....](https://images.od.modash.io/d11069cecfa5b2edd1c408d2ea2d23ca2a5eb674)
loganprimeclips x DrinkPrime
![Instagram post by @loganprimeclips for DrinkPrime. Caption reads: [...] - - - ( CREDIT : @jakepaul @drinkprime )....](https://images.od.modash.io/d1a6fd0e347352e25db49565effafedcad1778e7)
![Instagram post by @loganprimeclips for DrinkPrime. Caption reads: [...] - - ( CREDITS : @loganpaul @drinkprime )....](https://images.od.modash.io/393552a95b207357320aef3e202c4bc69e656a30)
![Instagram post by @loganprimeclips for DrinkPrime. Caption reads: [...] 👀 - - - ( CREDIT : @drinkprime @loganpaul )....](https://images.od.modash.io/4f50452263dcc13bab0ecf2dd95b6c5dc2206767)
💡 Related resource: Long-Term Influencer Partnerships: Pros, Cons & How The Pros Manage Them.
Geographical breakdown
In our dataset, United States is where DrinkPrime had the most influencer activity. 53.9% of their live influencer content in the last 12 months was posted by American influencers.
Based on the percentage of influencer content per market, other important markets include:
- India (9.2%)
- United Kingdom (7.3%)
- Brazil (4.3%)
DrinkPrime's influencer activity by market
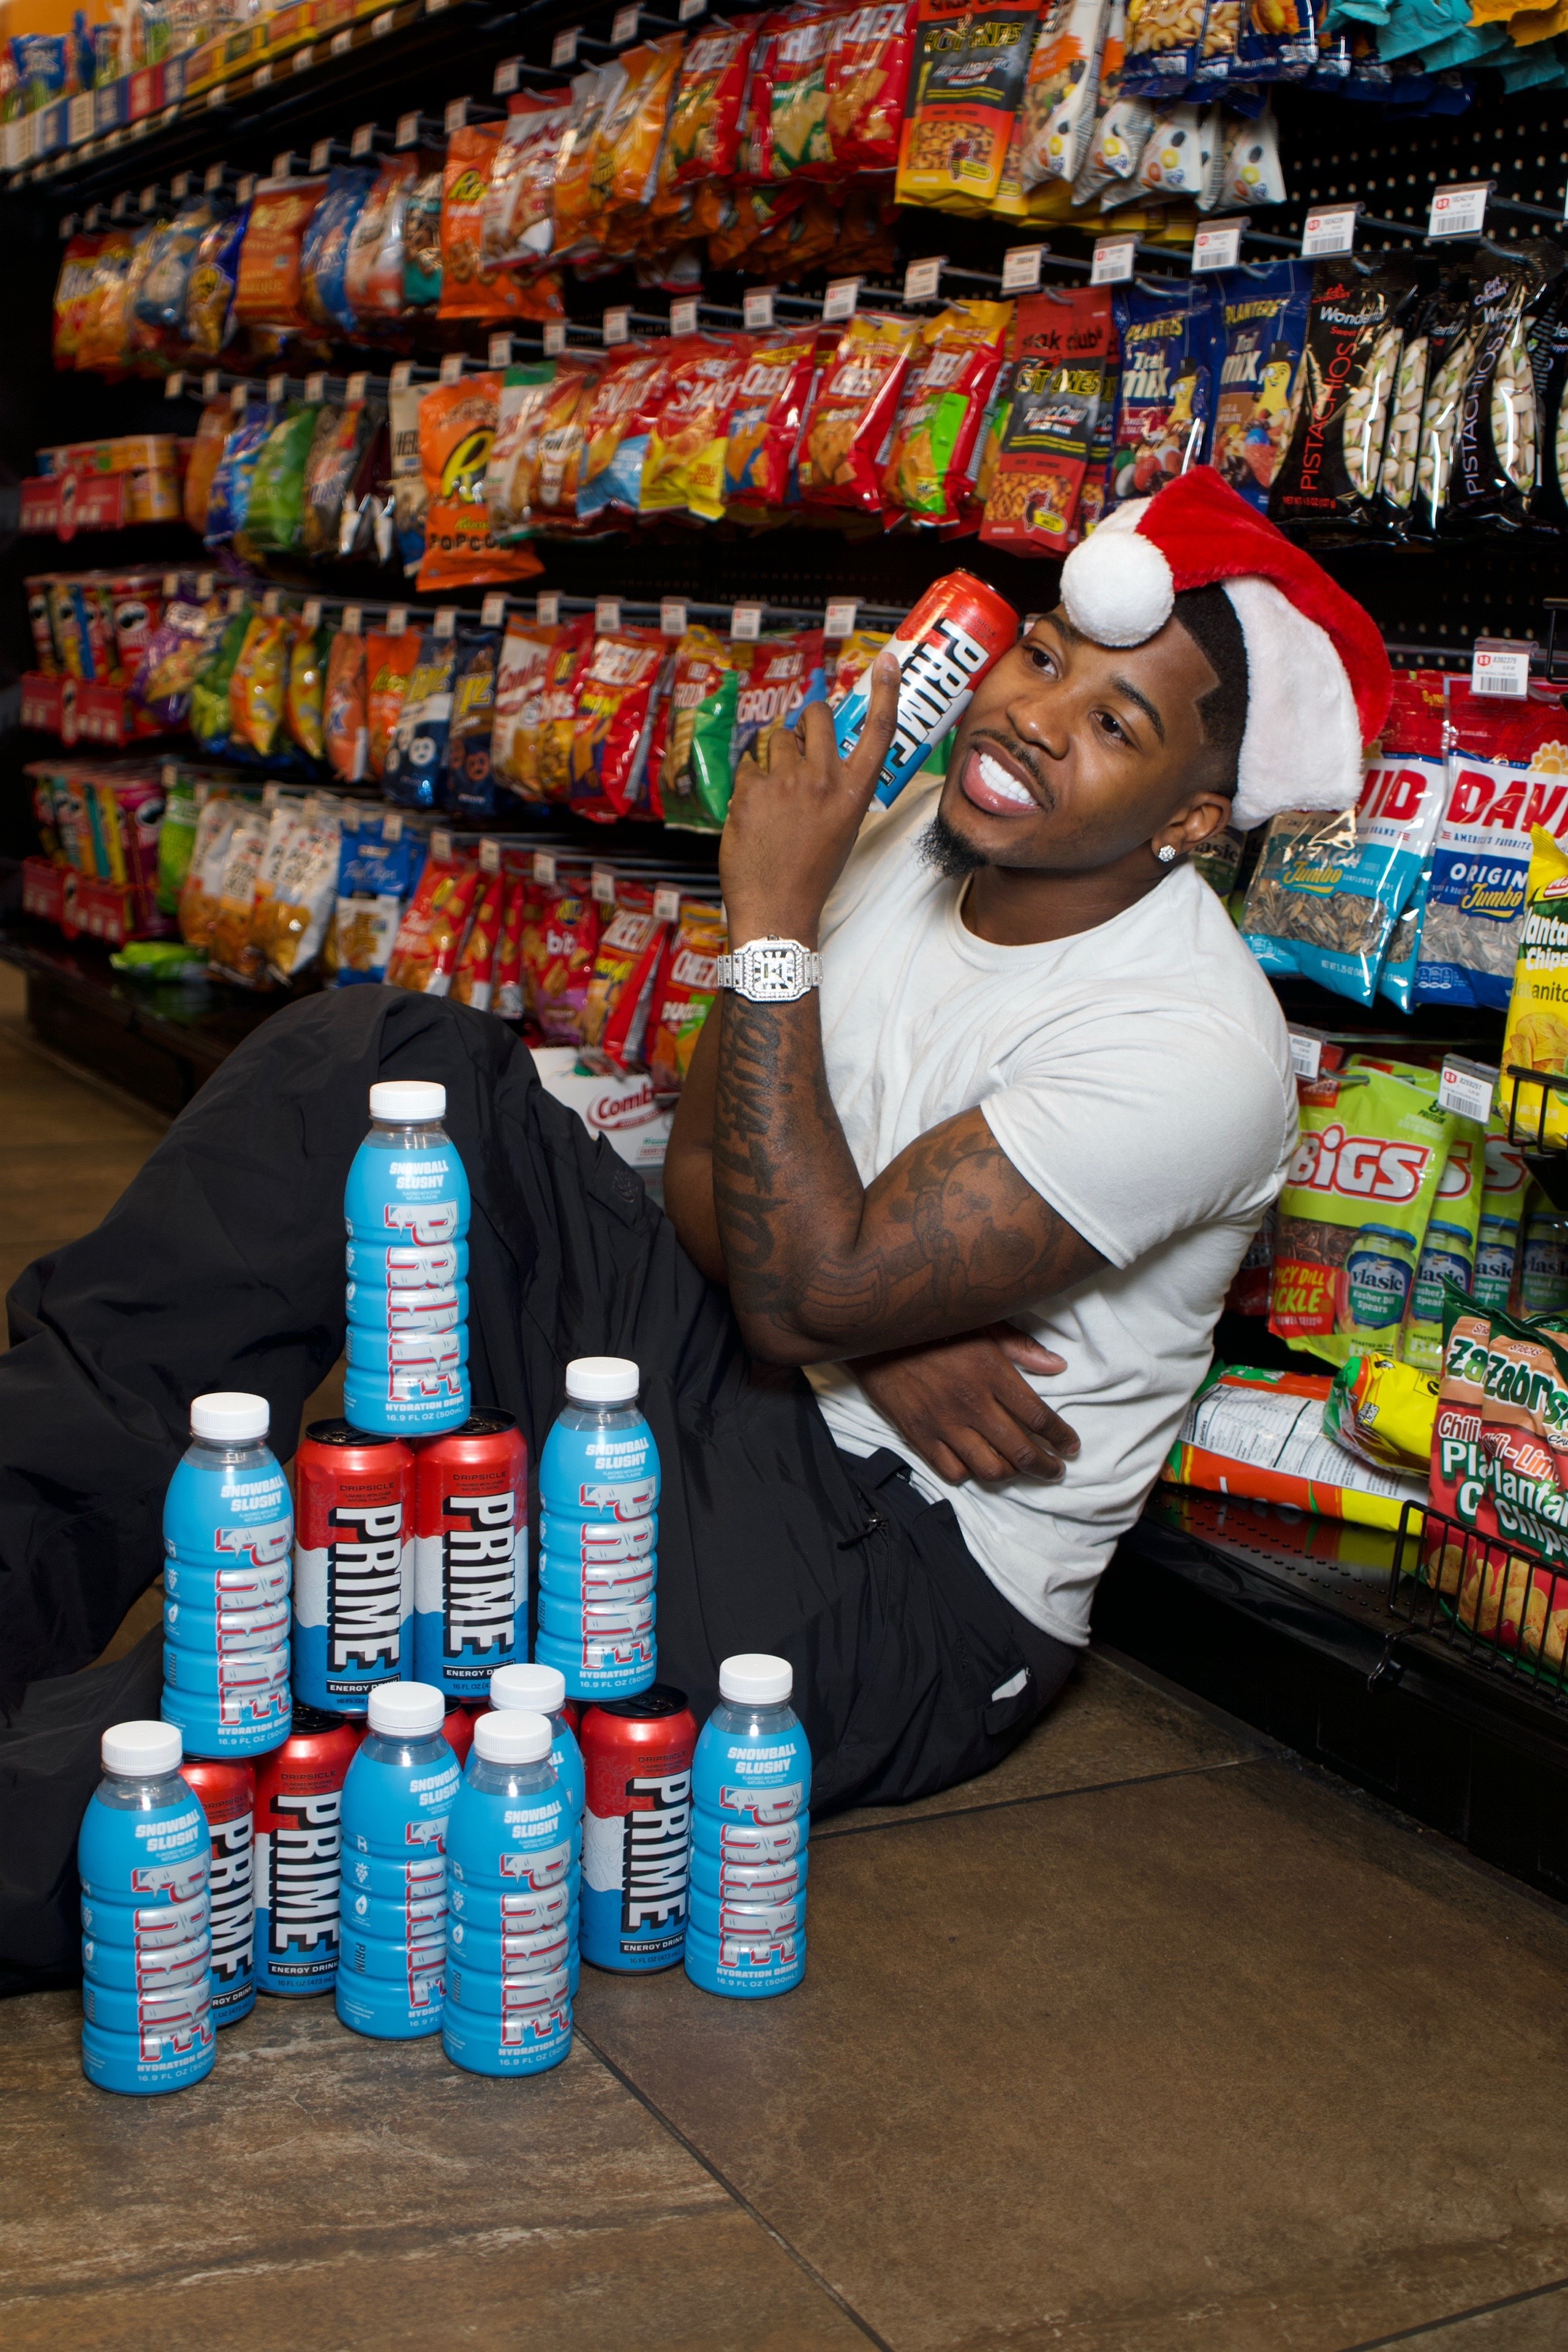
Here is another example of DrinkPrime collaborating with an influencer in United States.
officialarry1k x DrinkPrime
DrinkPrime's influencer activity vs. related brands
DrinkPrime competes for functional beverage attention alongside Poppi and Electrolit, with similar reliance on creator-driven taste tests, fitness/lifestyle integration, and convenience-led trial.
Total influencer content
DrinkPrime vs. related brands influencer activity
Total sponsored posts tracked (last 12 months)
Poppi leads with 9.5k sponsored posts, significantly outpacing DrinkPrime (3.4k posts) and Electrolit (2.4k posts). Across all three brands, the average volume is 5.1k posts, indicating mature, scaled influencer programs. Poppi has several times more total posts than DrinkPrime and Electrolit.
By social platform
DrinkPrime vs. related brands influencer activity (by social platform)
Sponsored posts by platform
Among these brands, Poppi leads on Instagram, TikTok, and YouTube. The gap is most notable on TikTok, with Poppi at 6.7k, DrinkPrime at 1.3k, Electrolit at 0 posts. Poppi's activity is particularly concentrated on TikTok. TikTok posts are heavily concentrated with Poppi and DrinkPrime, while Electrolit has none.
By geographical market
DrinkPrime vs. related brands influencer activity (by country)
Estimated sponsored posts in DrinkPrime's top markets
Poppi has the highest estimated sponsored-post volume in United States (7.4k posts, 77.4%), Canada (630 posts, 6.6%), United Kingdom (420 posts, 4.4%), suggesting a North America focus, while Electrolit has the highest estimated sponsored-post volume in Mexico (538 posts, 22.7%), Chile (237 posts, 10%), while DrinkPrime leads in India with 315 posts (9.2%). Looking at United States specifically, the split is Poppi at 7.4k posts (77.4%), DrinkPrime at 1.8k posts (53.9%), Electrolit at 931 posts (39.3%).
Read more influencer strategy breakdowns
Looking for more like this? Here are 5 similar influencer marketing strategy breakdowns for other brands:
- Poppi's Influencer Marketing Strategy
- Electrolit's Influencer Marketing Strategy
- Skintific's Influencer Marketing Strategy
- Yeoreo's Influencer Marketing Strategy
- Treehut's Influencer Marketing Strategy
Or, if you want to access data like this for your own software or processes, take a look at Modash's API products:
Frequently asked questions
Scaling your influencer program?
When you outgrow your mishmash of spreadsheets & free tools, try Modash. Find & email influencers, track campaigns, ship products & more - all in one place.