SodaStream Influencer Marketing Strategy
(2026 Data & Insights)
We analyzed 1.3k pieces of influencer content sponsored by SodaStream over the last 12 months.
This report breaks down where & how SodaStream invests in influencer marketing, which social platforms they prioritize, top geographical markets, and more.
The data in this report comes from Modash's Brand Collaborations API.
P.S. for a simple list of influencers who have collaborated with SodaStream, see here: SodaStream influencers.
Influencer activity throughout the year
SodaStream's influencer campaigns are active year-round with notable month-to-month fluctuation. The chart below shows month-by-month data for total sponsored posts tracked.
SodaStream's influencer activity by month
Number of sponsored posts
SodaStream's influencer output appears relatively consistent throughout the year, averaging about 107 sponsored posts per month. July recorded the highest volume at 149 posts (39% above average), while February was the quietest at 63 posts.
Social platforms breakdown
In our dataset (which only includes Instagram, YouTube, and TikTok), this is how the volume of SodaStream's sponsored influencer collaborations break down by social platform:
- Instagram: 778 posts (60.1%)
- TikTok: 516 posts (39.9%)
SodaStream's influencer activity by platform
Share of sponsored content by social network
Instagram influencer marketing is a clear focus for SodaStream.
Here are 2 examples of SodaStream's recent sponsored collaborations (one each for Instagram, TikTok).
sss.sophiie x SodaStream
![Instagram post by @sss.sophiie for SodaStream. Caption reads: [...] popcorn ✅ Unlimited fizzy drinks ✅....](https://images.od.modash.io/6fe5a1826b6921ef58ee784214b1a124eeaa6e23)
Influencer bio
Sunday resets & Satisfying cleans 🫧🛋️🪴☁️ sophie@dashtalent.co.uk ⬇️LINKS⬇️
Collaboration metrics
Get a free trial to find more data on influencer audiences, performance, and collaborations.
bradengalloway x SodaStream
![TikTok post by @bradengalloway for SodaStream. Caption reads: [...] without sacrificing the fizz. @SodaStreamUSA....](https://images.od.modash.io/28d866cd05cc0f2b9b8cdc8c93174f877f46bd11)
Influencer bio
Family | Travel | Lifestyle | Fitness —————————- Partnerships: braden@night.co
Collaboration metrics
Get a free trial to find more data on influencer audiences, performance, and collaborations.
If you break this down further by content type on Instagram, this is what it looks like:
- Reels: 88.4%
- Posts: 11.6%
💡 Related resource: How To Find Instagram Influencers.
Influencer audience size breakdown (by views)
For their top social platform (Instagram), here is a breakdown of the type of influencers SodaStream are collaborating with, by audience size.
Note: this breakdown is based on each influencer's average views (not follower/subscriber count), because views typically correlate more closely with influencer pricing and impact.
SodaStream's influencers average views (Instagram)
Based on each influencer's average views per post
SodaStream's creator selection appears relatively diversified across size tiers, with no single segment dominating. This suggests a balanced approach to influencer partnerships, spreading investment across different audience sizes.
Here is an example of a sponsored collaboration with a larger-audience creator on Instagram (458.6k avg views/post, 178.6k followers):
sanfoodiego x SodaStream
![Instagram post by @sanfoodiego for SodaStream. Caption reads: [...] to make my favorite drinks with @sodastream....](https://images.od.modash.io/a2d66a77a96b0d56fd71af1f18186eec34cb3144)
Influencer bio
📍 san diego, socal 😋 asian food connoisseur 📩 sanfoodiego@gmail.com ⬇️ Groupon Deals!
Collaboration metrics
Get a free trial to find more data on influencer audiences, performance, and collaborations.
And here is another example with a smaller creator on Instagram (9.8k avg views/post, 3.5k followers):
fancyillustrator x SodaStream
Influencer bio
Illustrator & Creator 🪄 everyday life of illustrator ✍🏼 & content creator 👩💻✨ 💌 fancyillustrator@gmail.com|spolupráce, objednávky
Collaboration metrics
Get a free trial to find more data on influencer audiences, performance, and collaborations.
SodaStream's repeat partnerships
Out of 909 unique influencers in our dataset, 29 of them (3%) posted content for SodaStream in 3 or more separate calendar months. The most consistent partner is @zsigmond_angii, who has collaborated across 6 months with 6 total posts.
Here are 3 examples of SodaStream's repeat influencer partnerships, with links to the sponsored content.
zsigmond_angii x SodaStream
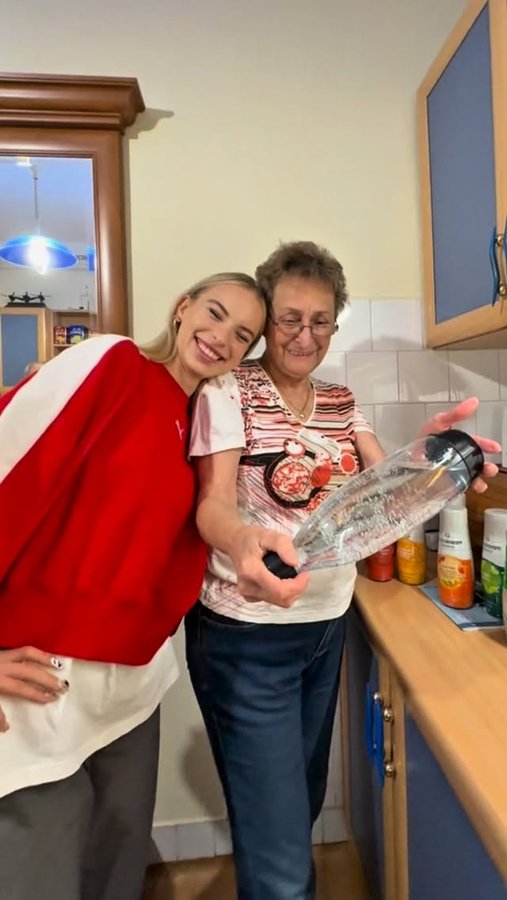
![Instagram post by @zsigmond_angii for SodaStream. Caption reads: [...] szénsavas üdítőt a SodaStreammel és az új....](https://images.od.modash.io/4c2f9711c7f279dc21843e1f3c59b143412c59d9)
![Instagram post by @zsigmond_angii for SodaStream. Caption reads: [...] 30-ig Black Friday🖤 akció a sodastream.hu-n....](https://images.od.modash.io/eed37997a87f1eae231b6cf1f1c97533d397f9b8)
zsaneszka x SodaStream
![Instagram post by @zsaneszka for SodaStream. Caption reads: [...] bárhová magammal vihetem #sodastream....](https://images.od.modash.io/7bb29d4901771f589d948914bc5615df537ce935)
![Instagram post by @zsaneszka for SodaStream. Caption reads: [...] sstzsanett10 kuponkóddal a....](https://images.od.modash.io/44d350165bd6c072621210bf5ebe402b41348b4e)
![Instagram post by @zsaneszka for SodaStream. Caption reads: [...] van a PET-palackokból? A @sodastream -mel....](https://images.od.modash.io/8a1dc860bbbb2afb8da80ac82d651eadc7af7d3c)
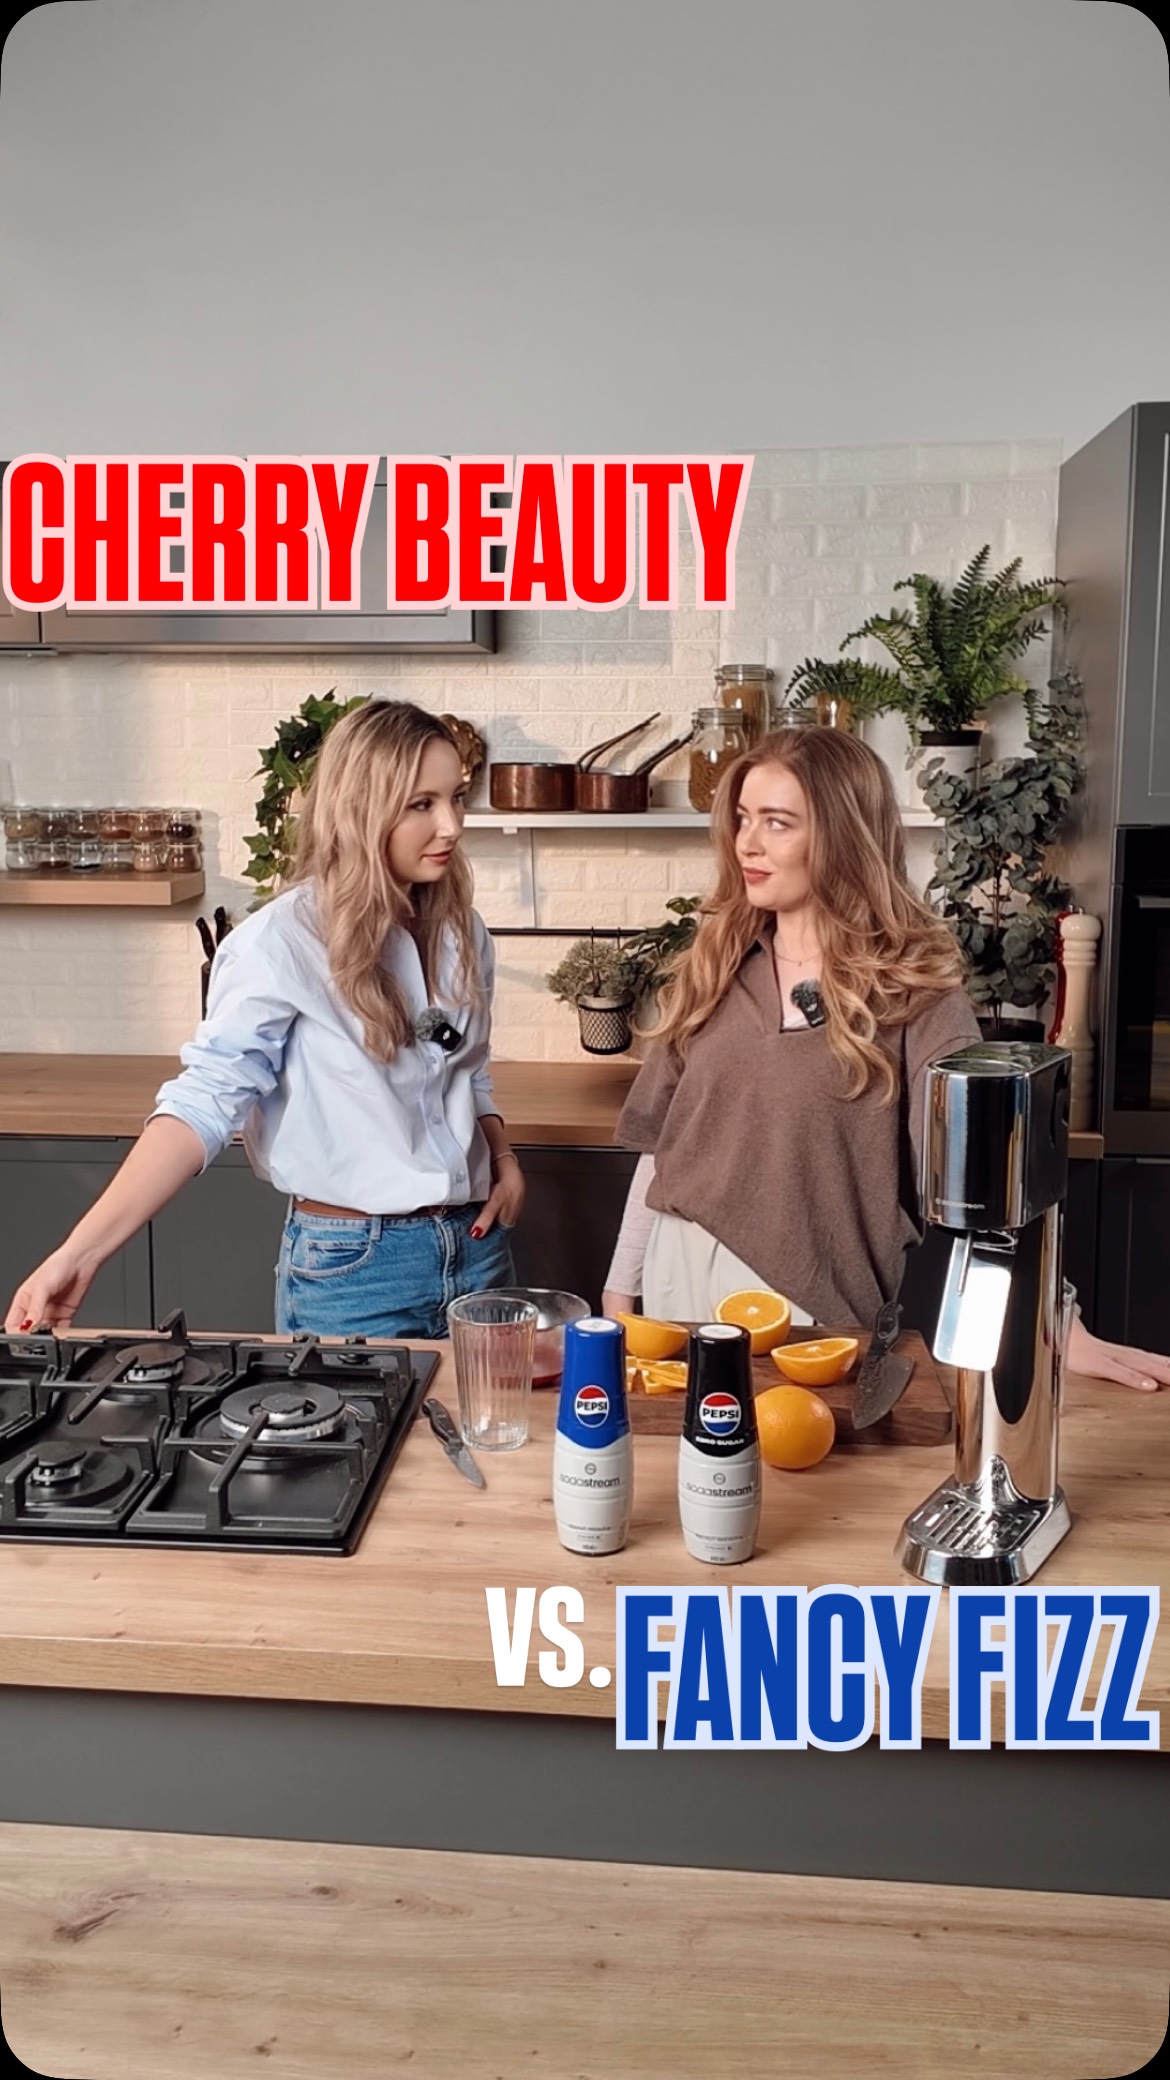
losttogether.hu x SodaStream
![TikTok post by @losttogether.hu for SodaStream. Caption reads: [...] melyik lett a finomabb😍 @SodaStream....](https://images.od.modash.io/147321d8ba5c9091744384b676b9fe50a62d9d09)
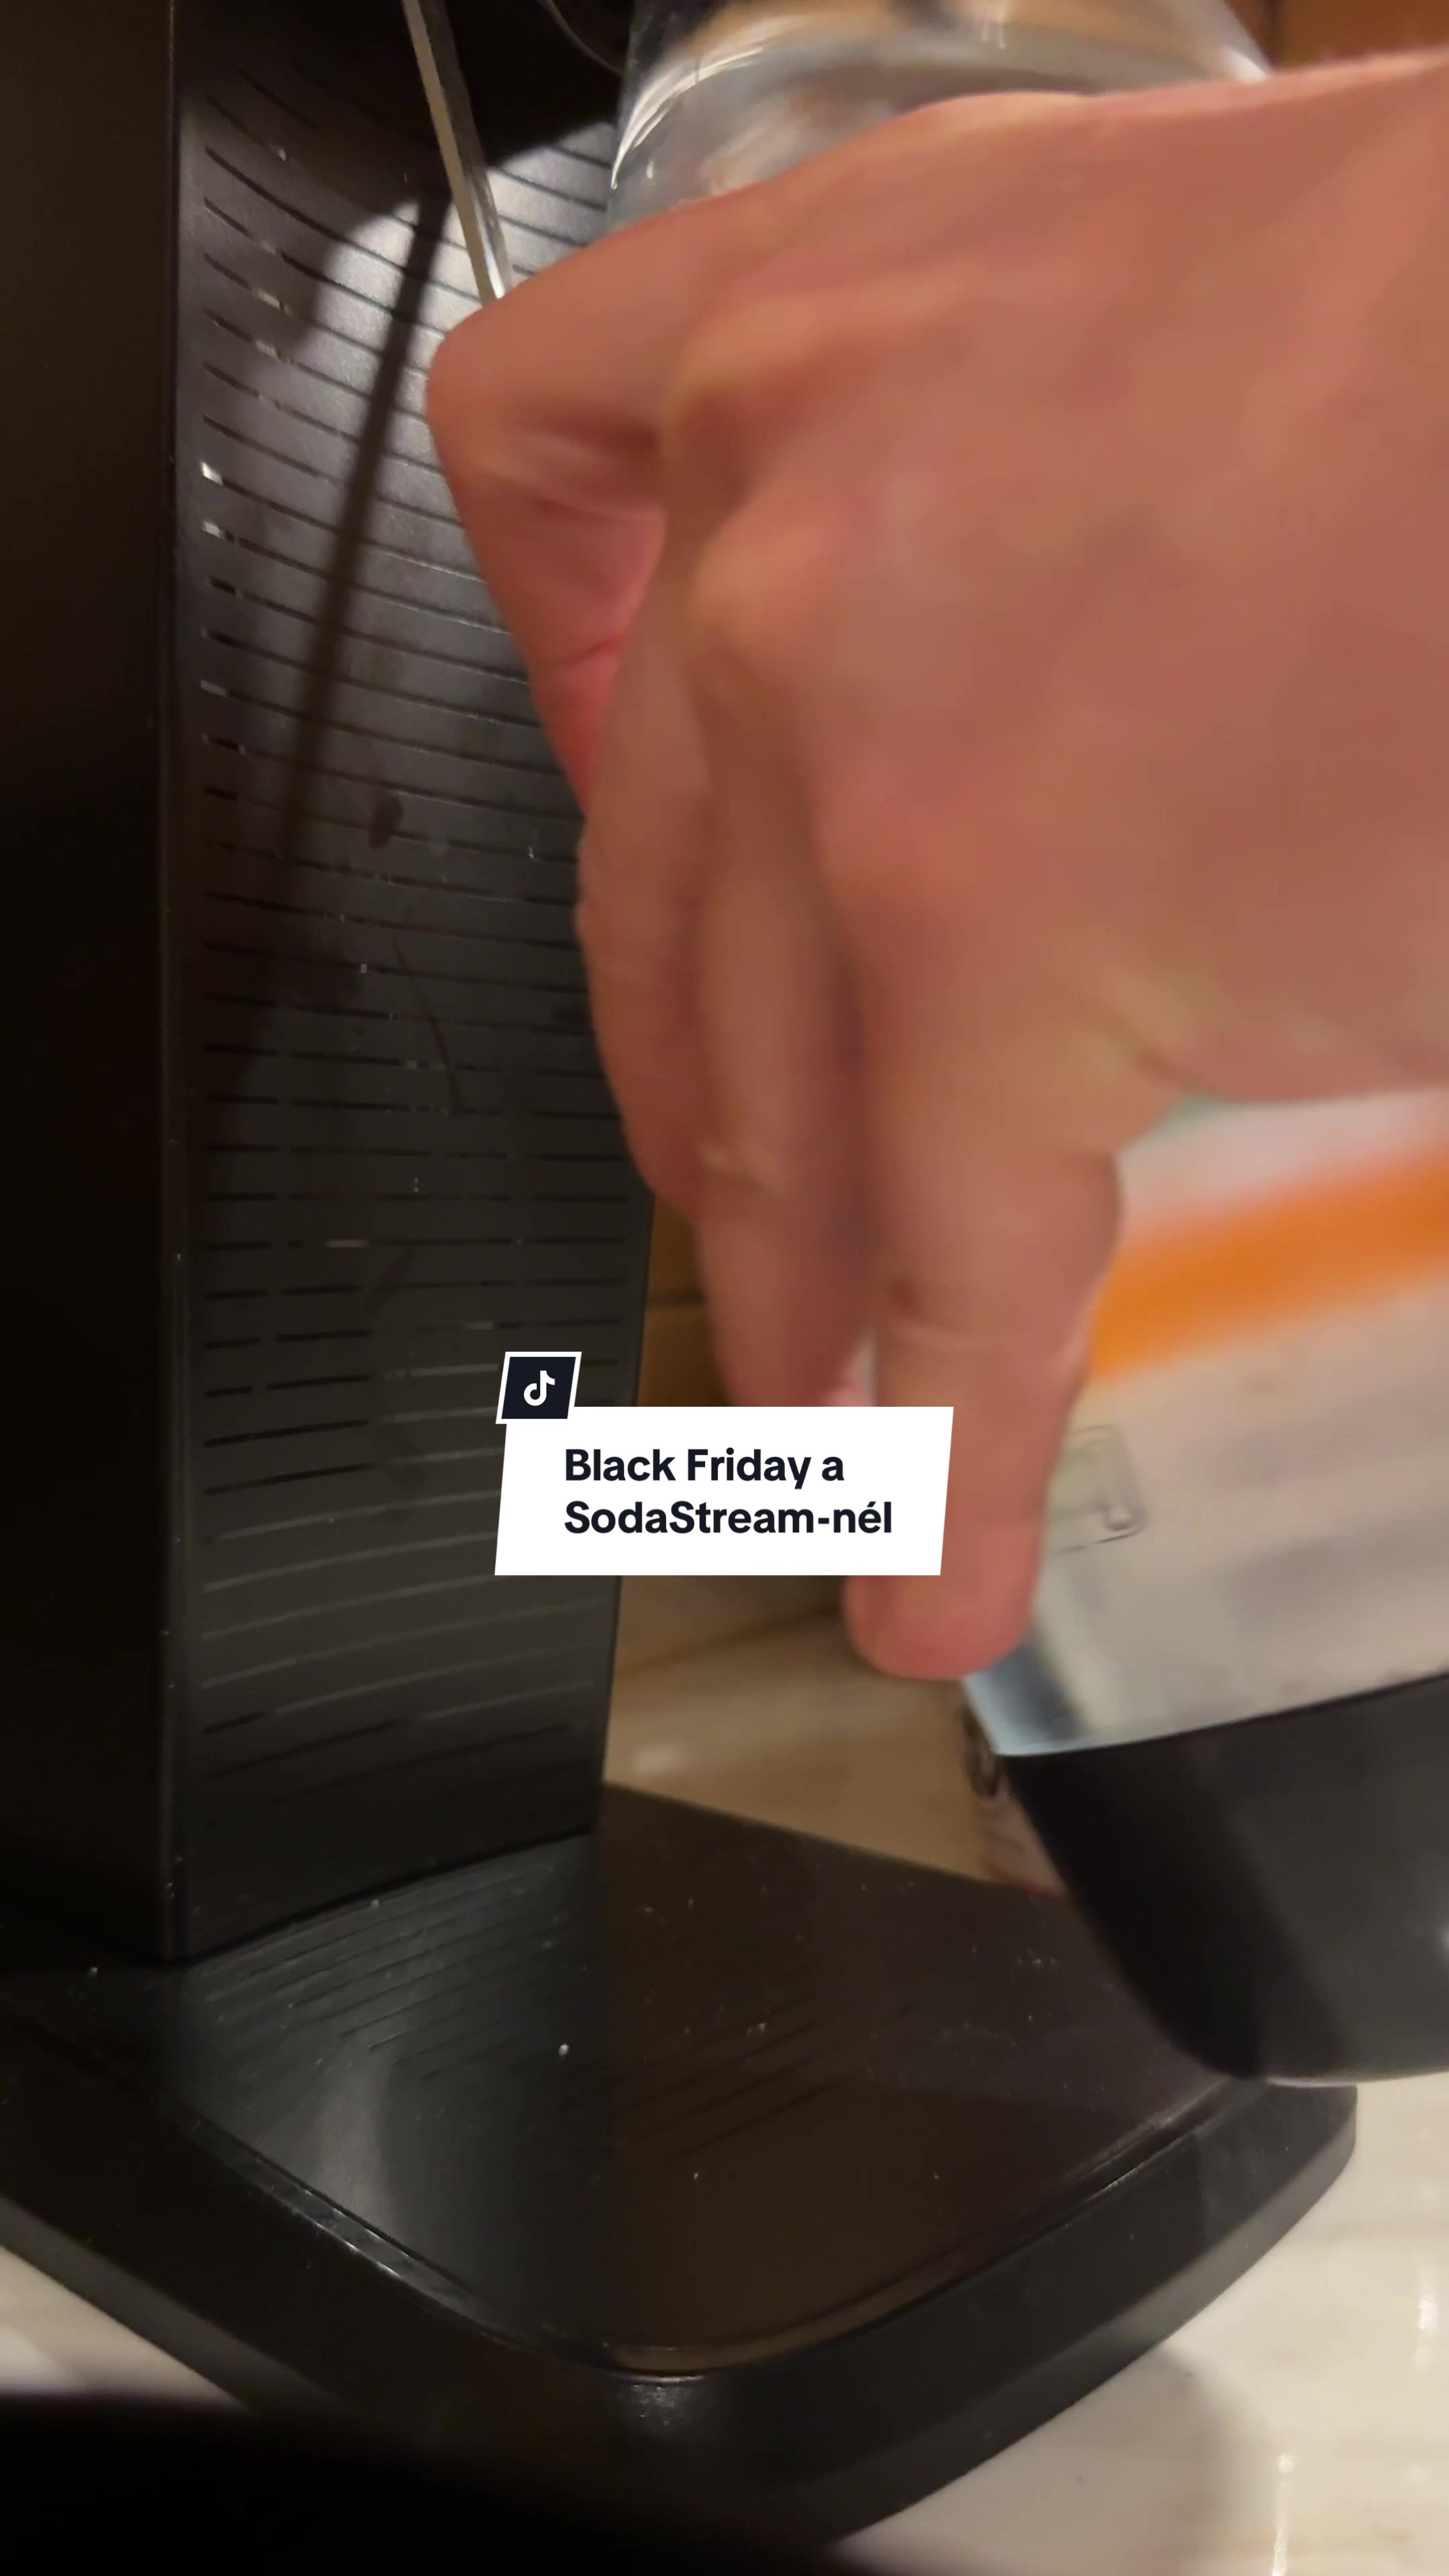
![TikTok post by @losttogether.hu for SodaStream. Caption reads: [...] a szeretteidnek? @SodaStream Magyarország....](https://images.od.modash.io/865b1573535eaf452286e9e208d5dec93a7d5600)
💡 Related resource: Long-Term Influencer Partnerships: Pros, Cons & How The Pros Manage Them.
Geographical breakdown
In our dataset, United States is where SodaStream had the most influencer activity. 16.9% of their live influencer content in the last 12 months was posted by American influencers.
Based on the percentage of influencer content per market, other important markets include:
- Poland (14.5%)
- United Kingdom (9.8%)
- France (6.4%)
SodaStream's influencer activity by market
Here is another example of SodaStream collaborating with an influencer in United States.
targetbabefinds x SodaStream
![TikTok post by @targetbabefinds for SodaStream. Caption reads: [...] sparkling drink ✨ I made this using my....](https://images.od.modash.io/67cd6a6371955b4f16536fb70440062501b2a578)
SodaStream's influencer activity vs. related brands
SodaStream competes for at-home beverage routines and hydration habits that are highly influenced by lifestyle creators. BruMate and Stanley 1913 target the same drinkware-and-beverage adjacent audience and dominate similar social proof moments.
Total influencer content
SodaStream vs. related brands influencer activity
Total sponsored posts tracked (last 12 months)
BruMate leads with 5.6k sponsored posts, significantly outpacing Stanley 1913 (3.8k posts) and SodaStream (1.3k posts). Across all three brands, the average volume is 3.6k posts, indicating mature, scaled influencer programs. BruMate has several times more total posts than SodaStream.
By social platform
SodaStream vs. related brands influencer activity (by social platform)
Sponsored posts by platform
Among these brands, Stanley 1913 leads on Instagram and YouTube and BruMate leads on TikTok. The gap is most notable on TikTok, with BruMate at 5k, Stanley 1913 at 1.8k, SodaStream at 516 posts. BruMate's activity is particularly concentrated on TikTok. On TikTok, BruMate has several times more posts than SodaStream.
By geographical market
SodaStream vs. related brands influencer activity (by country)
Estimated sponsored posts in SodaStream's top markets
BruMate has the highest estimated sponsored-post volume in United States (3.8k posts, 68.8%), Japan (846 posts, 15.2%), United Kingdom (173 posts, 3.1%), while Stanley 1913 has the highest estimated sponsored-post volume in Brazil (1.3k posts, 34.2%), Thailand (293 posts, 7.7%), while SodaStream leads in Poland with 188 posts (14.5%). Looking at United States specifically, the split is BruMate at 3.8k posts (68.8%), Stanley 1913 at 857 posts (22.5%), SodaStream at 219 posts (16.9%).
Read more influencer strategy breakdowns
Looking for more like this? Here are 5 similar influencer marketing strategy breakdowns for other brands:
- BruMate's Influencer Marketing Strategy
- Stanley 1913's Influencer Marketing Strategy
- Amnesty Italia's Influencer Marketing Strategy
- Club L London's Influencer Marketing Strategy
- CAKES Body's Influencer Marketing Strategy
Or, if you want to access data like this for your own software or processes, take a look at Modash's API products:
Frequently asked questions
Scaling your influencer program?
When you outgrow your mishmash of spreadsheets & free tools, try Modash. Find & email influencers, track campaigns, ship products & more - all in one place.