Electrolit Influencer Marketing Strategy
(2026 Data & Insights)
We analyzed 2.4k pieces of influencer content sponsored by Electrolit over the last 12 months.
This report breaks down where & how Electrolit invests in influencer marketing, which social platforms they prioritize, top geographical markets, and more.
The data in this report comes from Modash's Brand Collaborations API.
P.S. for a simple list of influencers who have collaborated with Electrolit, see here: Electrolit influencers.
Influencer activity throughout the year
Electrolit's influencer campaigns are active year-round with notable month-to-month fluctuation. The chart below shows month-by-month data for total sponsored posts tracked.
Electrolit's influencer activity by month
Number of sponsored posts
Electrolit's influencer output appears relatively consistent throughout the year, averaging about 197 sponsored posts per month. March recorded the highest volume at 261 posts (32% above average), while June was the quietest at 125 posts.
Social platforms breakdown
In our dataset (which only includes Instagram, YouTube, and TikTok), this is how the volume of Electrolit's sponsored influencer collaborations break down by social platform:
- Instagram: 2.4k posts (100%)
Electrolit's influencer activity by platform
Share of sponsored content by social network
Instagram influencer marketing is a clear focus for Electrolit.
Here are 1 examples of Electrolit's recent sponsored collaborations (one each for Instagram).
isaamedinaa x Electrolit
![Instagram post by @isaamedinaa for Electrolit. Caption reads: [...] tries to plan ahead for the festival....](https://images.od.modash.io/8fb3aae8293b9ca30012597196e5d724f84d18f1)
Influencer bio
just cracking myself UP podcast @imrighturwrongpodcast 🤸♀️ tell me where to tour link below
Collaboration metrics
Get a free trial to find more data on influencer audiences, performance, and collaborations.
If you break this down further by content type on Instagram, this is what it looks like:
- Posts: 54%
- Reels: 46%
💡 Related resource: How To Find Instagram Influencers.
Influencer audience size breakdown (by views)
For their top social platform (Instagram), here is a breakdown of the type of influencers Electrolit are collaborating with, by audience size.
Note: this breakdown is based on each influencer's average views (not follower/subscriber count), because views typically correlate more closely with influencer pricing and impact.
Electrolit's influencers average views (Instagram)
Based on each influencer's average views per post
Electrolit's creator selection appears relatively diversified across size tiers, with no single segment dominating. This suggests a balanced approach to influencer partnerships, spreading investment across different audience sizes.
Here is an example of a sponsored collaboration with a larger-audience creator on Instagram (1.1M avg views/post):
arynasabalenka x Electrolit
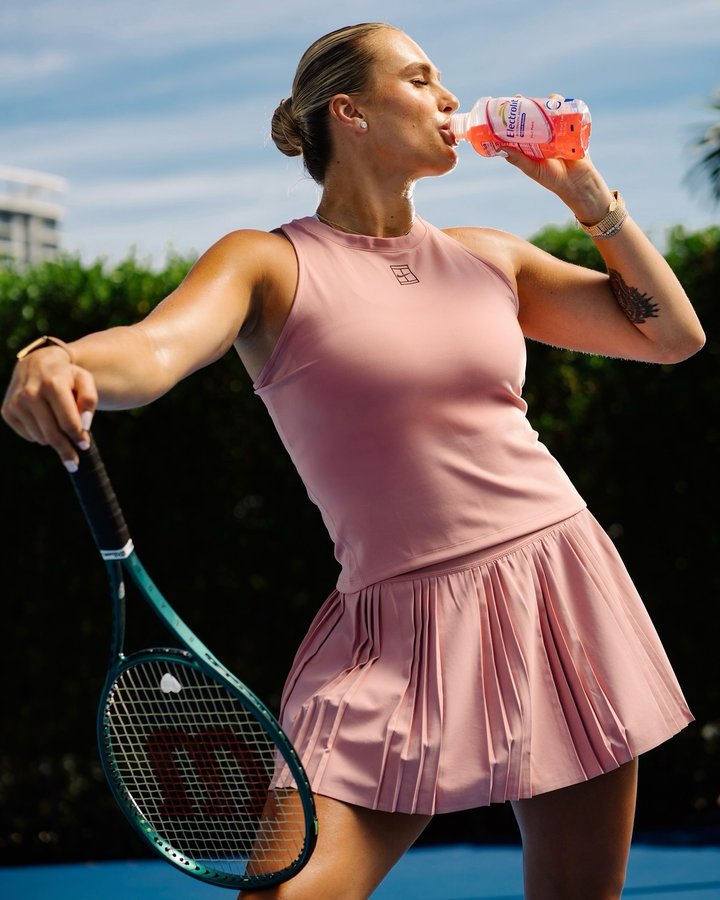
Influencer bio
On & off the court 🎾🐯 @thisisevolve
Collaboration metrics
Get a free trial to find more data on influencer audiences, performance, and collaborations.
And here is another example with a smaller creator on Instagram (7.1k avg views/post):
deportivopastooficial x Electrolit
![Instagram post by @deportivopastooficial for Electrolit. Caption reads: [...] en la cancha. ¡Vamos Pasto! 🔵🔴🟡....](https://images.od.modash.io/89a9d4899bc6cd343593d8df6a85cd8e821eee9a)
Influencer bio
🇹🇩 SOMOS LOS VOLCÁNICOS 🌋Femenino: @deportivopastofemenino 🌋Cantera: @lacanteravolcanica
Collaboration metrics
Get a free trial to find more data on influencer audiences, performance, and collaborations.
Electrolit's repeat partnerships
Out of 927 unique influencers in our dataset, 54 of them (6%) posted content for Electrolit in 3 or more separate calendar months. The most consistent partner is @venicerunclub, who has collaborated across 12 months with 64 total posts. @sarmientoloraoficial alone accounts for 7% of all tracked sponsored content.
Here are 3 examples of Electrolit's repeat influencer partnerships, with links to the sponsored content.
cruzazul x Electrolit
![Instagram post by @cruzazul for Electrolit. Caption reads: [...] galería. 📸 Presentada por....](https://images.od.modash.io/a614a2381bf9857c10cfa8894cd08e2a6a83e651)
![Instagram post by @cruzazul for Electrolit. Caption reads: [...] del partido. Presentada por....](https://images.od.modash.io/83a3b34adf93e0415d7b9491b5a2df93459cc0b5)
![Instagram post by @cruzazul for Electrolit. Caption reads: [...] la victoria. Presentada por @electrolit.....](https://images.od.modash.io/365553859b521a4442a688841d5639c003393918)
envigadofc x Electrolit
![Instagram post by @envigadofc for Electrolit. Caption reads: [...] con la fuerza que nos da....](https://images.od.modash.io/9579fa3a8cf91eecc74af0c3807af9405733062c)
![Instagram post by @envigadofc for Electrolit. Caption reads: [...] —el de la vida. 🌸 Con Electrolit recargamos....](https://images.od.modash.io/096f44077a49f448eda2dc3f49457a45a289734a)
cucutaoficial x Electrolit
![Instagram post by @cucutaoficial for Electrolit. Caption reads: [...] Ⓜ️🆚🏹 Presentada por: @electrolit.colombia....](https://images.od.modash.io/c1751753d430e91db852d6f835d6d7a895ae6b93)
![Instagram post by @cucutaoficial for Electrolit. Caption reads: [...] con cada partido de la liga. Electrolit....](https://images.od.modash.io/9f6fdfdc2306c2f395347be7639691394d212968)
![Instagram post by @cucutaoficial for Electrolit. Caption reads: [...] rendidor es presentado por....](https://images.od.modash.io/26ad578ecd001af7a16c82748f1c130acc30dc47)
💡 Related resource: Long-Term Influencer Partnerships: Pros, Cons & How The Pros Manage Them.
Geographical breakdown
In our dataset, United States is where Electrolit had the most influencer activity. 39.3% of their live influencer content in the last 12 months was posted by American influencers.
Based on the percentage of influencer content per market, other important markets include:
- Mexico (22.7%)
- Chile (10%)
- Colombia (7.9%)
Electrolit's influencer activity by market
Here is another example of Electrolit collaborating with an influencer in United States.
inez.slowpez x Electrolit
![Instagram post by @inez.slowpez for Electrolit. Caption reads: [...] 5k fun and all day hydration 🏃♂️w/....](https://images.od.modash.io/373284b56c2341af587de4fef31ae52a078c167d)
Electrolit's influencer activity vs. related brands
Electrolit competes with DrinkPrime and Vita Coco in hydration-focused beverages that are marketed around performance, recovery, and lifestyle use cases. Influencer content is a key battleground for all three, especially in fitness, sports, and everyday wellness routines.
Total influencer content
Electrolit vs. related brands influencer activity
Total sponsored posts tracked (last 12 months)
DrinkPrime leads with 3.6k sponsored posts, marginally ahead of Vita Coco (3.5k posts) and Electrolit (2.4k posts). Across all three brands, the average volume is 3.2k posts, indicating mature, scaled influencer programs.
By social platform
Electrolit vs. related brands influencer activity (by social platform)
Sponsored posts by platform
Electrolit leads on Instagram, while Vita Coco has the most activity on TikTok and YouTube. The gap is most notable on TikTok, with Vita Coco at 2.4k, DrinkPrime at 1.4k, Electrolit at 0 posts. Electrolit's activity is particularly concentrated on Instagram. Electrolit has no posts on TikTok or YouTube, while DrinkPrime and Vita Coco have substantial TikTok activity and at least some YouTube posts.
By geographical market
Electrolit vs. related brands influencer activity (by country)
Estimated sponsored posts in Electrolit's top markets
Vita Coco has the highest estimated sponsored-post volume in United States (2.1k posts, 60.8%), United Kingdom (470 posts, 13.4%), Brazil (109 posts, 3.1%), while Electrolit has the highest estimated sponsored-post volume in Mexico (538 posts, 22.7%), Chile (237 posts, 10%), while DrinkPrime leads in India with 337 posts (9.3%). Looking at United States specifically, the split is Vita Coco at 2.1k posts (60.8%), DrinkPrime at 1.9k posts (53.1%), Electrolit at 931 posts (39.3%).
Read more influencer strategy breakdowns
Looking for more like this? Here are 5 similar influencer marketing strategy breakdowns for other brands:
- DrinkPrime's Influencer Marketing Strategy
- Vita Coco's Influencer Marketing Strategy
- Love Wellness's Influencer Marketing Strategy
- GROWNSY's Influencer Marketing Strategy
- Harry Potter's Influencer Marketing Strategy
Or, if you want to access data like this for your own software or processes, take a look at Modash's API products:
Frequently asked questions
Scaling your influencer program?
When you outgrow your mishmash of spreadsheets & free tools, try Modash. Find & email influencers, track campaigns, ship products & more - all in one place.