Skintific Influencer Marketing Strategy
(2026 Data & Insights)
We analyzed 19.7k pieces of influencer content sponsored by Skintific over the last 12 months.
This report breaks down where & how Skintific invests in influencer marketing, which social platforms they prioritize, top geographical markets, and more.
The data in this report comes from Modash's Brand Collaborations API.
P.S. for a simple list of influencers who have collaborated with Skintific, see here: Skintific influencers.
Influencer activity throughout the year
Skintific's influencer campaigns are active year-round with notable month-to-month fluctuation. The chart below shows month-by-month data for total sponsored posts tracked.
Skintific's influencer activity by month
Number of sponsored posts
Skintific's influencer output appears relatively consistent throughout the year, averaging about 1.6k sponsored posts per month. April recorded the highest volume at 2.2k posts (32% above average), while July was the quietest at 1.1k posts.
Social platforms breakdown
In our dataset (which only includes Instagram, YouTube, and TikTok), this is how the volume of Skintific's sponsored influencer collaborations break down by social platform:
- Instagram: 14.7k posts (74.4%)
- TikTok: 5.0k posts (25.6%)
- YouTube: 2 posts (0%)
Skintific's influencer activity by platform
Share of sponsored content by social network
Instagram influencer marketing is a clear focus for Skintific.
Here are 2 examples of Skintific's recent sponsored collaborations (one each for Instagram, TikTok).
naura.ayu x Skintific
![Instagram post by @naura.ayu for Skintific. Caption reads: [...] everything. The newest skintint from....](https://images.od.modash.io/9c2ca03db36a9540e9403034a49a2e5e54f511bb)
Influencer bio
💌brands +62 811 8700222 (ana) 💌events +62 813 88396186 (rajib) @trinityoptima @dongengnauraayu
Collaboration metrics
Get a free trial to find more data on influencer audiences, performance, and collaborations.
bretmanrock x Skintific
![TikTok post by @bretmanrock for Skintific. Caption reads: [...] clean. We love a hardworking queen....](https://images.od.modash.io/0e27c2eb74172fcee658baffaa68f575bcad2297)
Influencer bio
legend 🧿 Host of @DaBaddest Radio 🐢
Collaboration metrics
Get a free trial to find more data on influencer audiences, performance, and collaborations.
If you break this down further by content type on Instagram, this is what it looks like:
- Reels: 92%
- Posts: 8%
💡 Related resource: How To Find Instagram Influencers.
Influencer audience size breakdown (by views)
For their top social platform (Instagram), here is a breakdown of the type of influencers Skintific are collaborating with, by audience size.
Note: this breakdown is based on each influencer's average views (not follower/subscriber count), because views typically correlate more closely with influencer pricing and impact.
Skintific's influencers average views (Instagram)
Based on each influencer's average views per post
Skintific's creator selection appears relatively diversified across size tiers, with no single segment dominating. This suggests a balanced approach to influencer partnerships, spreading investment across different audience sizes.
Here is an example of a sponsored collaboration with a larger-audience creator on Instagram (20.4M avg views/post):
gracebudsarin x Skintific
![Instagram post by @gracebudsarin for Skintific. Caption reads: [...] Skintific✨🩵 #skintific #skintificth.](https://images.od.modash.io/62221b7ca18430d2312363aad233469343049d8f)
Influencer bio
Budsarin Wonglelanont LINE OA : @grace.bsr (for work)
Collaboration metrics
Get a free trial to find more data on influencer audiences, performance, and collaborations.
And here is another example with a smaller creator on Instagram (10.0k avg views/post):
danielleian08 x Skintific
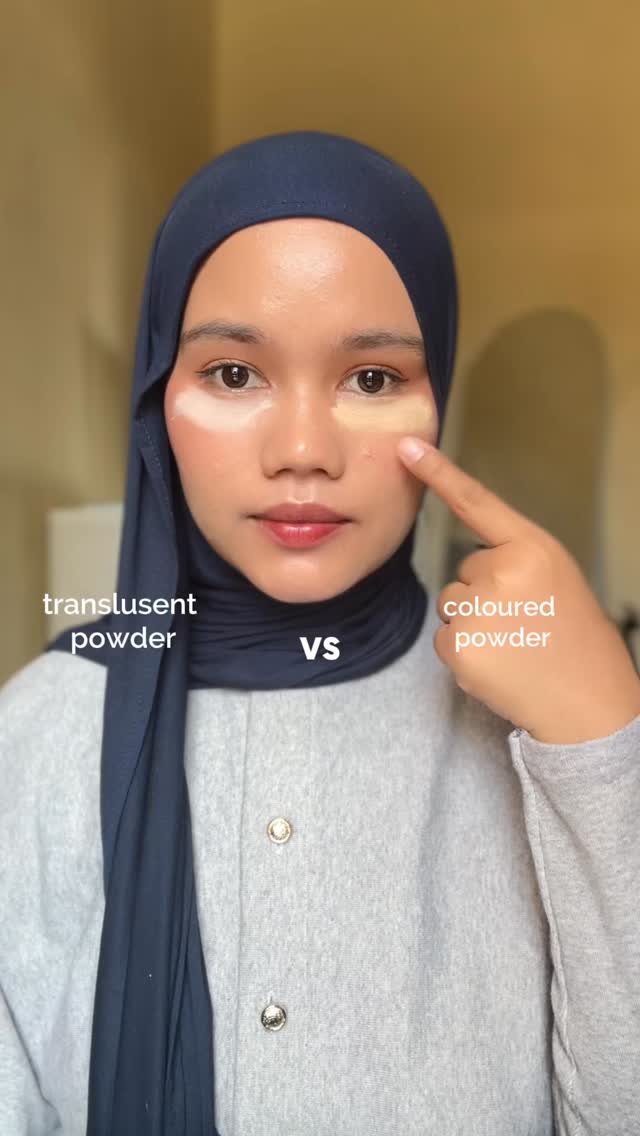
![Instagram post by @danielleian08 for Skintific. Caption reads: [...] for a perfect dewy makeup finish ✨....](https://images.od.modash.io/82890a0f06d94665e1e33204fee16c8d7c869e94)
Influencer bio
Stalk me on Tiktok too! 🥳 📩 inquiry.danielleian08@gmail.com '98 | MNL, 🇵🇭 DLS-CSB Saved by Grace through Faith ✞
Collaboration metrics
Get a free trial to find more data on influencer audiences, performance, and collaborations.
Skintific's repeat partnerships
Out of 6.8k unique influencers in our dataset, 913 of them (13%) posted content for Skintific in 3 or more separate calendar months. The most consistent partner is @febbyindraa, who has collaborated across 13 months with 43 total posts.
Here are 3 examples of Skintific's repeat influencer partnerships, with links to the sponsored content.
febbyindraa x Skintific
![Instagram post by @febbyindraa for Skintific. Caption reads: [...] pernah ku coba 🍊✨🫶🏻🫧 @skintificid....](https://images.od.modash.io/49591694a0b423a3cd338773d3eac8beb6fca44d)
![Instagram post by @febbyindraa for Skintific. Caption reads: [...] kudu banget coba lah best!! @skintificid....](https://images.od.modash.io/5f99b09066a2ae3cdc82dd9f395232a11becc925)
![Instagram post by @febbyindraa for Skintific. Caption reads: [...] kayak kulit korea✨🤏🏻🍑🤍 @skintificid.](https://images.od.modash.io/a41d02c7b268e5c5841e0265e0e15b64d66f51c9)
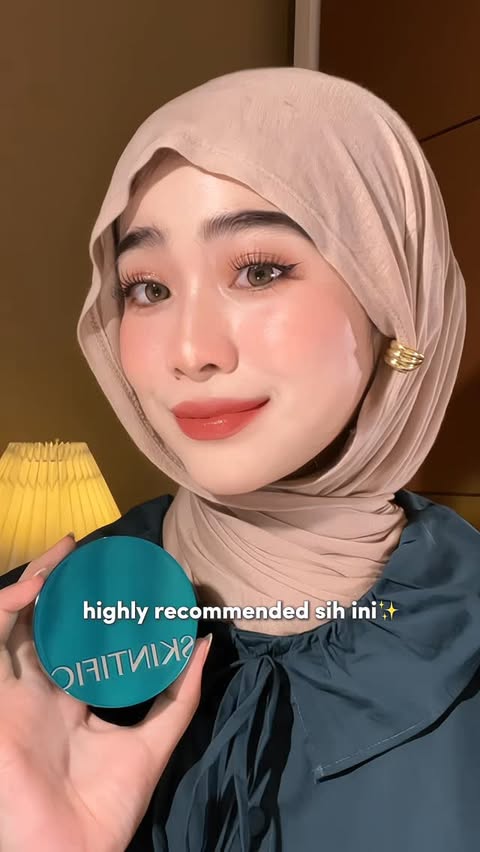
sonaana_ x Skintific
![Instagram post by @sonaana_ for Skintific. Caption reads: Skintific ngeluarin cushion lagi! Makin [...].](https://images.od.modash.io/712d4c0359e731778f213401e5055699a73e106d)
anggiapd_ x Skintific

![Instagram post by @anggiapd_ for Skintific. Caption reads: [...] kalian cukup pake moist @skintificid yang....](https://images.od.modash.io/c44b1b22fc70574f56c8ff3eec750657c21e703f)
💡 Related resource: Long-Term Influencer Partnerships: Pros, Cons & How The Pros Manage Them.
Geographical breakdown
In our dataset, Indonesia is where Skintific had the most influencer activity. 36.8% of their live influencer content in the last 12 months was posted by Indonesian influencers.
Based on the percentage of influencer content per market, other important markets include:
- Malaysia (19.9%)
- Thailand (19.1%)
- Philippines (9.2%)
Skintific's influencer activity by market
Here is another example of Skintific collaborating with an influencer in Indonesia.
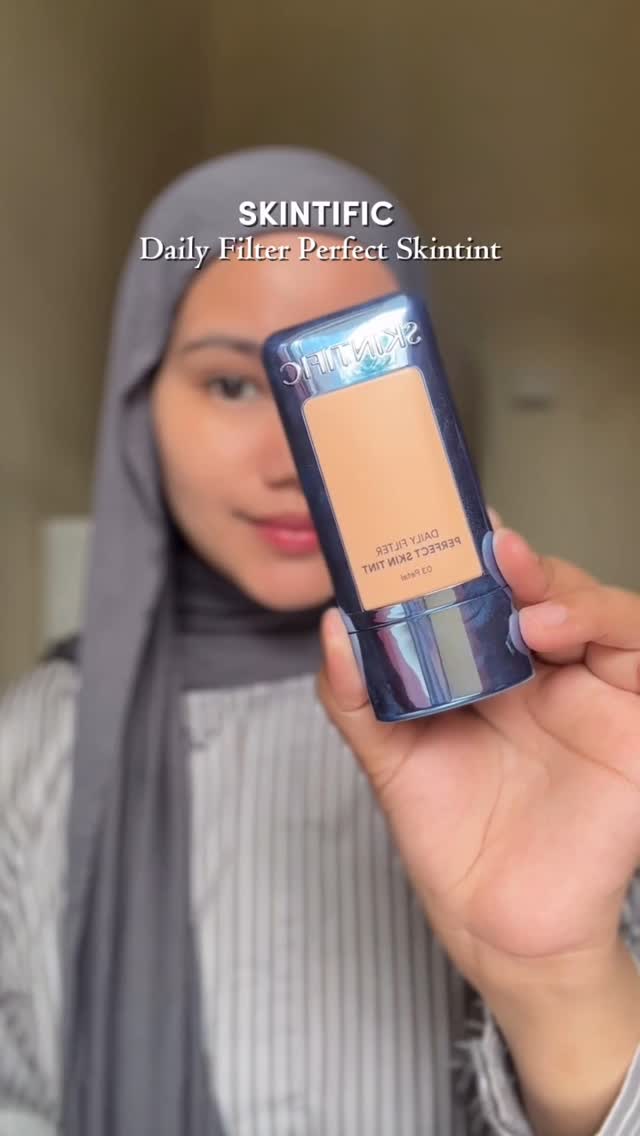
cclaracr x Skintific
![Instagram post by @cclaracr for Skintific. Caption reads: [...] dry skin!! this pink glow cushion from....](https://images.od.modash.io/5e7c2c48019e01f4e6f0d0ec2c8925a6977e9f25)
Skintific's influencer activity vs. related brands
Skintific competes with Anua and Round Lab in modern, ingredient-forward skincare with strong Asia-beauty influence and routine-based positioning. These brands frequently grow through creator reviews, sensitive-skin claims, and “before/after” performance proof.
Total influencer content
Skintific vs. related brands influencer activity
Total sponsored posts tracked (last 12 months)
Anua leads with 21.5k sponsored posts, marginally ahead of Skintific (19.7k posts) and Round Lab (4.4k posts). Across all three brands, the average volume is 15.2k posts, indicating mature, scaled influencer programs.
By social platform
Skintific vs. related brands influencer activity (by social platform)
Sponsored posts by platform
Skintific leads on Instagram, while Anua has the most activity on TikTok and YouTube. The gap is most notable on TikTok, with Anua at 11.3k, Skintific at 5k, Round Lab at 4.4k posts. Skintific's activity is particularly concentrated on Instagram. Round Lab has no Instagram or YouTube posts in this comparison, while Skintific and Anua have posts on both platforms.
By geographical market
Skintific vs. related brands influencer activity (by country)
Estimated sponsored posts in Skintific's top markets
Skintific has the highest estimated sponsored-post volume in Indonesia (7.3k posts, 36.8%), Malaysia (3.9k posts, 19.9%), Thailand (3.8k posts, 19.1%), suggesting a Asia focus, while Anua has the highest estimated sponsored-post volume in United States (6k posts, 28.1%), India (2k posts, 9.2%), Italy (1.5k posts, 7%).
Read more influencer strategy breakdowns
Looking for more like this? Here are 5 similar influencer marketing strategy breakdowns for other brands:
- Anua's Influencer Marketing Strategy
- Round Lab's Influencer Marketing Strategy
- Tiger Mist's Influencer Marketing Strategy
- Femme Luxe's Influencer Marketing Strategy
- Lovevery's Influencer Marketing Strategy
Or, if you want to access data like this for your own software or processes, take a look at Modash's API products:
Frequently asked questions
Scaling your influencer program?
When you outgrow your mishmash of spreadsheets & free tools, try Modash. Find & email influencers, track campaigns, ship products & more - all in one place.