boandtee Influencer Marketing Strategy
(2026 Data & Insights)
We analyzed 2.5k pieces of influencer content sponsored by boandtee over the last 12 months.
This report breaks down where & how boandtee invests in influencer marketing, which social platforms they prioritize, top geographical markets, and more.
The data in this report comes from Modash's Brand Collaborations API.
P.S. for a simple list of influencers who have collaborated with boandtee, see here: boandtee influencers.
Influencer activity throughout the year
boandtee's influencer campaigns are active year-round with notable month-to-month fluctuation. The chart below shows month-by-month data for total sponsored posts tracked.
boandtee's influencer activity by month
Number of sponsored posts
boandtee's sponsored post volume appears to trend upward over the 12-month period, rising from 234 posts in January to 206 in December. The peak month, August, reached 370 posts, 79% higher than the monthly average of 207.
Social platforms breakdown
In our dataset (which only includes Instagram, YouTube, and TikTok), this is how the volume of boandtee's sponsored influencer collaborations break down by social platform:
- Instagram: 1.8k posts (71.5%)
- TikTok: 699 posts (28.1%)
- YouTube: 12 posts (0.5%)
boandtee's influencer activity by platform
Share of sponsored content by social network
Instagram influencer marketing is a clear focus for boandtee.
Here are 2 examples of boandtee's recent sponsored collaborations (one each for Instagram, TikTok).
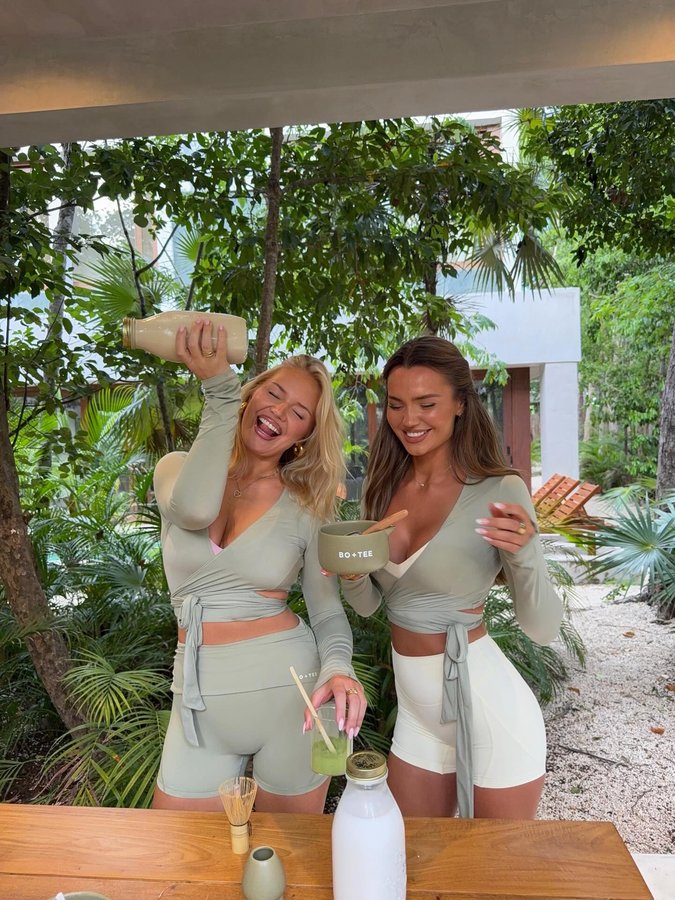
joannvdherik x boandtee
![Instagram post by @joannvdherik for boandtee. Caption reads: [...] day thermo clothing @stronger skisuit....](https://images.od.modash.io/3c93da3817ec7cab04a77891dc384c48ecf1553e)
Influencer bio
your online bestie 🤍🫂 author of “Joann’s weg naar zelfliefde” 💌 joann@bombersandlemonade.com jojo & may’s youtube channel 👇🏼
Collaboration metrics
Get a free trial to find more data on influencer audiences, performance, and collaborations.
hollyjai_ x boandtee
![TikTok post by @hollyjai_ for boandtee. Caption reads: [...] in pink please🎀🤭💕🩰 #pinkaholic #boandtee....](https://images.od.modash.io/cd9876457992e9b4fa22db9bc788aa58393960df)
Influencer bio
all things girly 🤭🎀✨🫶🏼 Insta: hollyjai YouTube: hollyjaix Contact: holly.jai@outreachtalentgroup.com
Collaboration metrics
Get a free trial to find more data on influencer audiences, performance, and collaborations.
If you break this down further by content type on Instagram, this is what it looks like:
- Posts: 67.4%
- Reels: 32.6%
💡 Related resource: How To Find Instagram Influencers.
Influencer audience size breakdown (by views)
For their top social platform (Instagram), here is a breakdown of the type of influencers boandtee are collaborating with, by audience size.
Note: this breakdown is based on each influencer's average views (not follower/subscriber count), because views typically correlate more closely with influencer pricing and impact.
boandtee's influencers average views (Instagram)
Based on each influencer's average views per post
With 30.3% of partnerships featuring creators averaging 1K-5K views, boandtee's strategy suggests niche targeting and authenticity, likely leveraging collaboration models like gifting and affiliates to work with smaller creators. The 10K-50K views segment is also prominent at 29.8%, indicating investment across adjacent tiers.
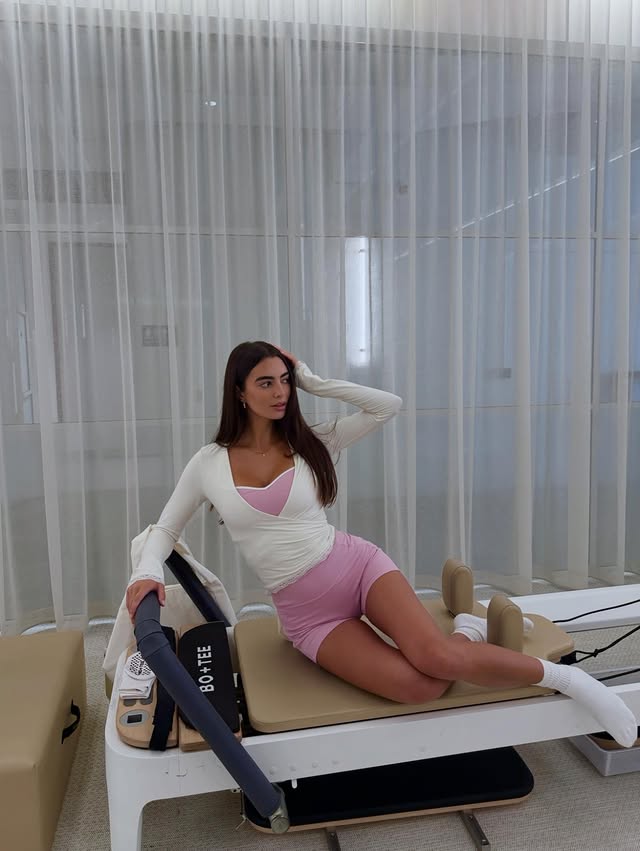
Here is an example of a sponsored collaboration with a larger-audience creator on Instagram (79.8k avg views/post):
mayridts x boandtee
![Instagram post by @mayridts for boandtee. Caption reads: [...] in flow. 🧘🏻♀️🌤️🌸🐚☁️💖 Wearing....](https://images.od.modash.io/80612dd66b5038e06a7892f97da93ba8ead08714)
Influencer bio
The only beauty standards you should follow are your own.♡ 🗺️ Wandering, always ✨🧚💕🌤️ 💌 may@underwatercreative.co.uk
Collaboration metrics
Get a free trial to find more data on influencer audiences, performance, and collaborations.
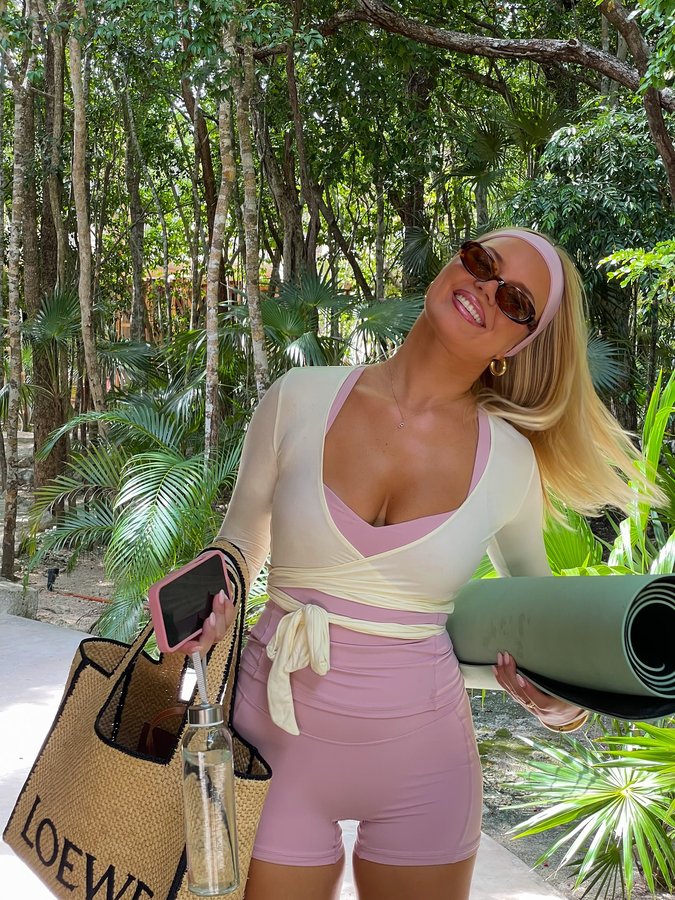
And here is another example with a smaller creator on Instagram (6.3k avg views/post):
miaflorentia x boandtee
Influencer bio
i post cute outfits and convince you to move abroad. 📍Bali @lovebalistarz Socials: Miaflorentiacollabs@gmail.com @brooklynmgmt @motmodels
Collaboration metrics
Get a free trial to find more data on influencer audiences, performance, and collaborations.
boandtee's repeat partnerships
Out of 1.4k unique influencers in our dataset, 39 of them (3%) posted content for boandtee in 3 or more separate calendar months. The most consistent partner is @daniellemetz, who has collaborated across 9 months with 17 total posts.
Here are 3 examples of boandtee's repeat influencer partnerships, with links to the sponsored content.
daniellemetz x boandtee

![Instagram post by @daniellemetz for boandtee. Caption reads: [...] me at the country club ♣️ @boandtee ad.](https://images.od.modash.io/6f6812b8a6a447fefab1e06fd4d61543c5b73d1d)
barbarakristoffersen x boandtee

hollyjai x boandtee
![Instagram post by @hollyjai for boandtee. Caption reads: [...] the life for me🤭🏌️♀️🌸⛳️ @boandtee ad.](https://images.od.modash.io/671386c1083f297b932d160cec4cebc5b575a2a3)
![Instagram post by @hollyjai for boandtee. Caption reads: [...] to go get coffee!!🪽☕️🤍) @boandtee adv.](https://images.od.modash.io/bd96cf622f7f718c39b4c5f141605ce4ac7203bc)

💡 Related resource: Long-Term Influencer Partnerships: Pros, Cons & How The Pros Manage Them.
Geographical breakdown
In our dataset, United States is where boandtee had the most influencer activity. 34.9% of their live influencer content in the last 12 months was posted by American influencers.
Based on the percentage of influencer content per market, other important markets include:
- United Kingdom (27.8%)
- Australia (4.1%)
- Brazil (3.2%)
boandtee's influencer activity by market
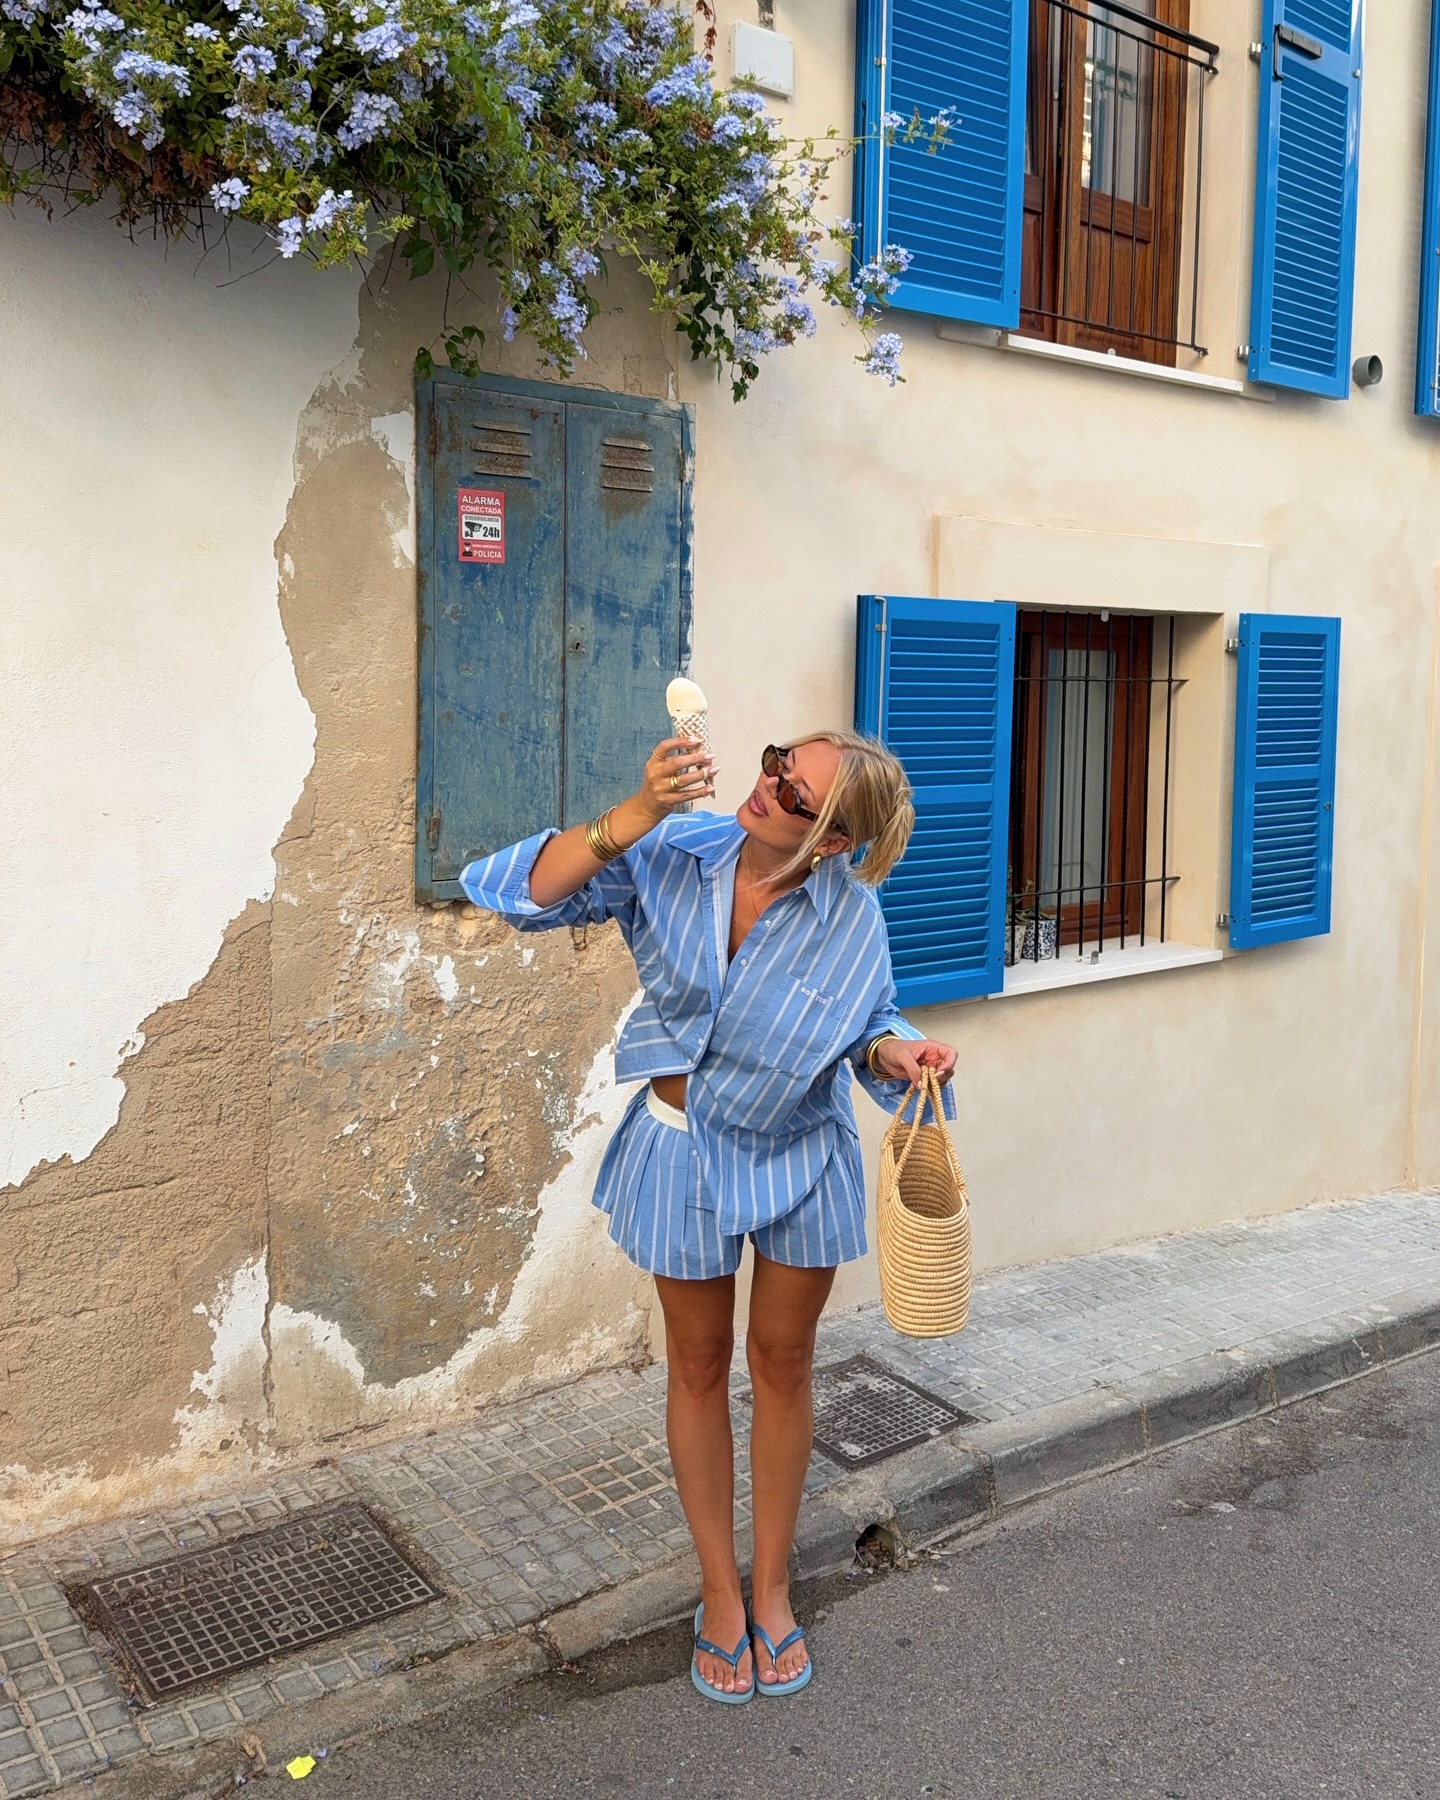
Here is another example of boandtee collaborating with an influencer in United States.
hollyb_fitness x boandtee
![Instagram post by @hollyb_fitness for boandtee. Caption reads: [...] into the deep end !! So grateful for....](https://images.od.modash.io/fa6320c3102e58bc379009cc30ea9ebebeed8303)
boandtee's influencer activity vs. related brands
boandtee competes in women’s gym and athleisure sets, closely overlapping with AYBL and Yeoreo for fit-focused, social-first shoppers. These brands share similar creator ecosystems built around try-ons, gym fits, and transformation content.
Total influencer content
boandtee vs. related brands influencer activity
Total sponsored posts tracked (last 12 months)
AYBL leads with 45.2k sponsored posts, significantly outpacing Yeoreo (8.7k posts) and boandtee (2.5k posts). Across all three brands, the average volume is 18.8k posts, indicating mature, scaled influencer programs. AYBL has a much higher total post count than boandtee and Yeoreo.
By social platform
boandtee vs. related brands influencer activity (by social platform)
Sponsored posts by platform
Among these brands, AYBL leads on Instagram, TikTok, and YouTube. The gap is most notable on TikTok, with AYBL at 24k, Yeoreo at 4.5k, boandtee at 699 posts. boandtee's activity is particularly concentrated on Instagram. On Instagram and TikTok, AYBL posts far more than boandtee and Yeoreo.
By geographical market
boandtee vs. related brands influencer activity (by country)
Estimated sponsored posts in boandtee's top markets
AYBL has the highest estimated sponsored-post volume in United States (21k posts, 46.9%), United Kingdom (9.3k posts, 20.5%), Canada (1.8k posts, 4%), suggesting a North America focus, while Yeoreo leads in Mexico with 746 posts (8.6%), while boandtee leads in Australia with 102 posts (4.1%). Looking at United States specifically, the split is AYBL at 21k posts (46.9%), Yeoreo at 4.7k posts (54.3%), boandtee at 869 posts (34.9%).
Read more influencer strategy breakdowns
Looking for more like this? Here are 5 similar influencer marketing strategy breakdowns for other brands:
- AYBL's Influencer Marketing Strategy
- Yeoreo's Influencer Marketing Strategy
- En Route Jewelry's Influencer Marketing Strategy
- Lioness Fashion's Influencer Marketing Strategy
- Tiger Mist's Influencer Marketing Strategy
Or, if you want to access data like this for your own software or processes, take a look at Modash's API products:
Frequently asked questions
Scaling your influencer program?
When you outgrow your mishmash of spreadsheets & free tools, try Modash. Find & email influencers, track campaigns, ship products & more - all in one place.