Hawaiian Tropic Influencer Marketing Strategy
(2026 Data & Insights)
We analyzed 1.2k pieces of influencer content sponsored by Hawaiian Tropic over the last 12 months.
This report breaks down where & how Hawaiian Tropic invests in influencer marketing, which social platforms they prioritize, top geographical markets, and more.
The data in this report comes from Modash's Brand Collaborations API.
P.S. for a simple list of influencers who have collaborated with Hawaiian Tropic, see here: Hawaiian Tropic influencers.
Influencer activity throughout the year
Hawaiian Tropic's influencer campaigns are active year-round with notable month-to-month fluctuation. The chart below shows month-by-month data for total sponsored posts tracked.
Hawaiian Tropic's influencer activity by month
Number of sponsored posts
Hawaiian Tropic's influencer activity appears to have tapered over the year, from 46 posts in January down to 48 in December. July was the busiest month at 202 posts, 113% above the monthly average.
Social platforms breakdown
In our dataset (which only includes Instagram, YouTube, and TikTok), this is how the volume of Hawaiian Tropic's sponsored influencer collaborations break down by social platform:
- TikTok: 644 posts (55.6%)
- Instagram: 514 posts (44.4%)
Hawaiian Tropic's influencer activity by platform
Share of sponsored content by social network
TikTok influencer marketing is a clear focus for Hawaiian Tropic.
Here are 2 examples of Hawaiian Tropic's recent sponsored collaborations (one each for Instagram, TikTok).
alixearle x Hawaiian Tropic

Influencer bio
❣︎ Founder and Chief Brand Officer of @realeactives alixearleteam@unitedtalent.com
Collaboration metrics
Get a free trial to find more data on influencer audiences, performance, and collaborations.
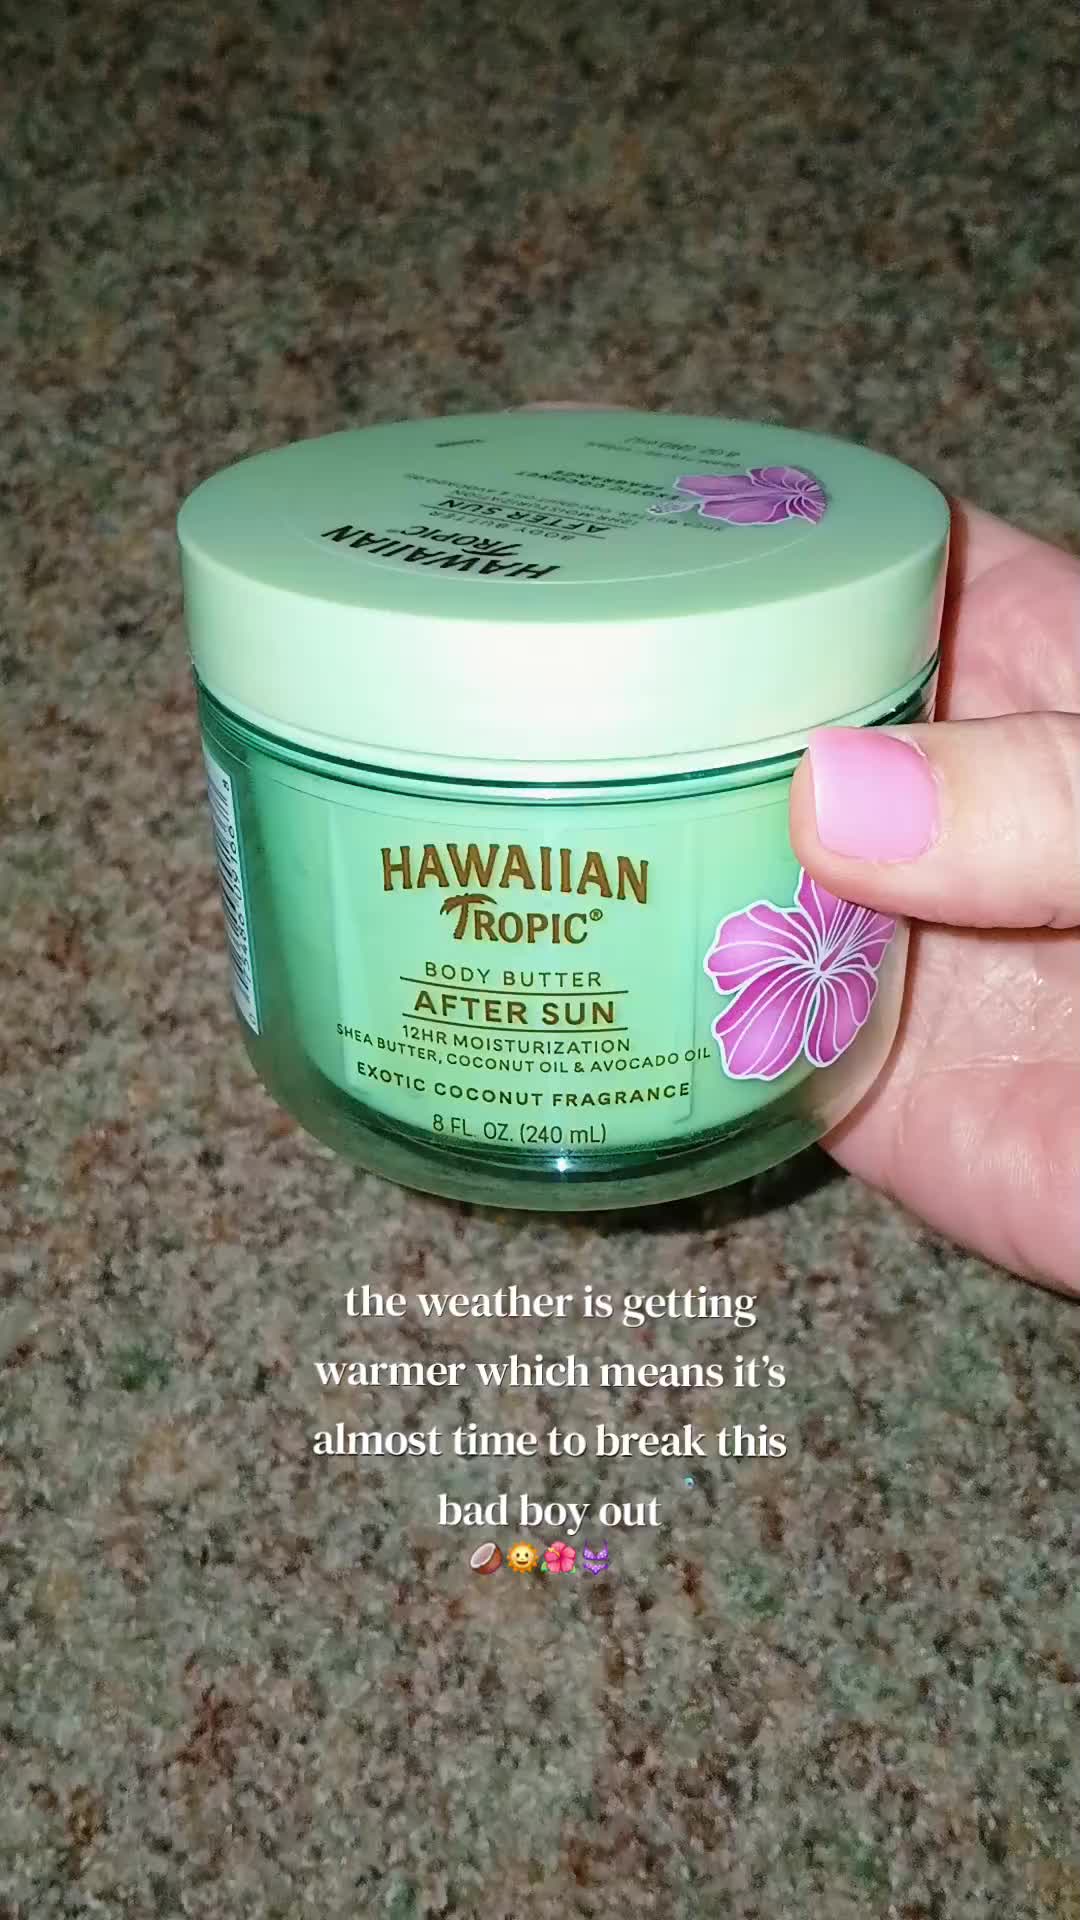
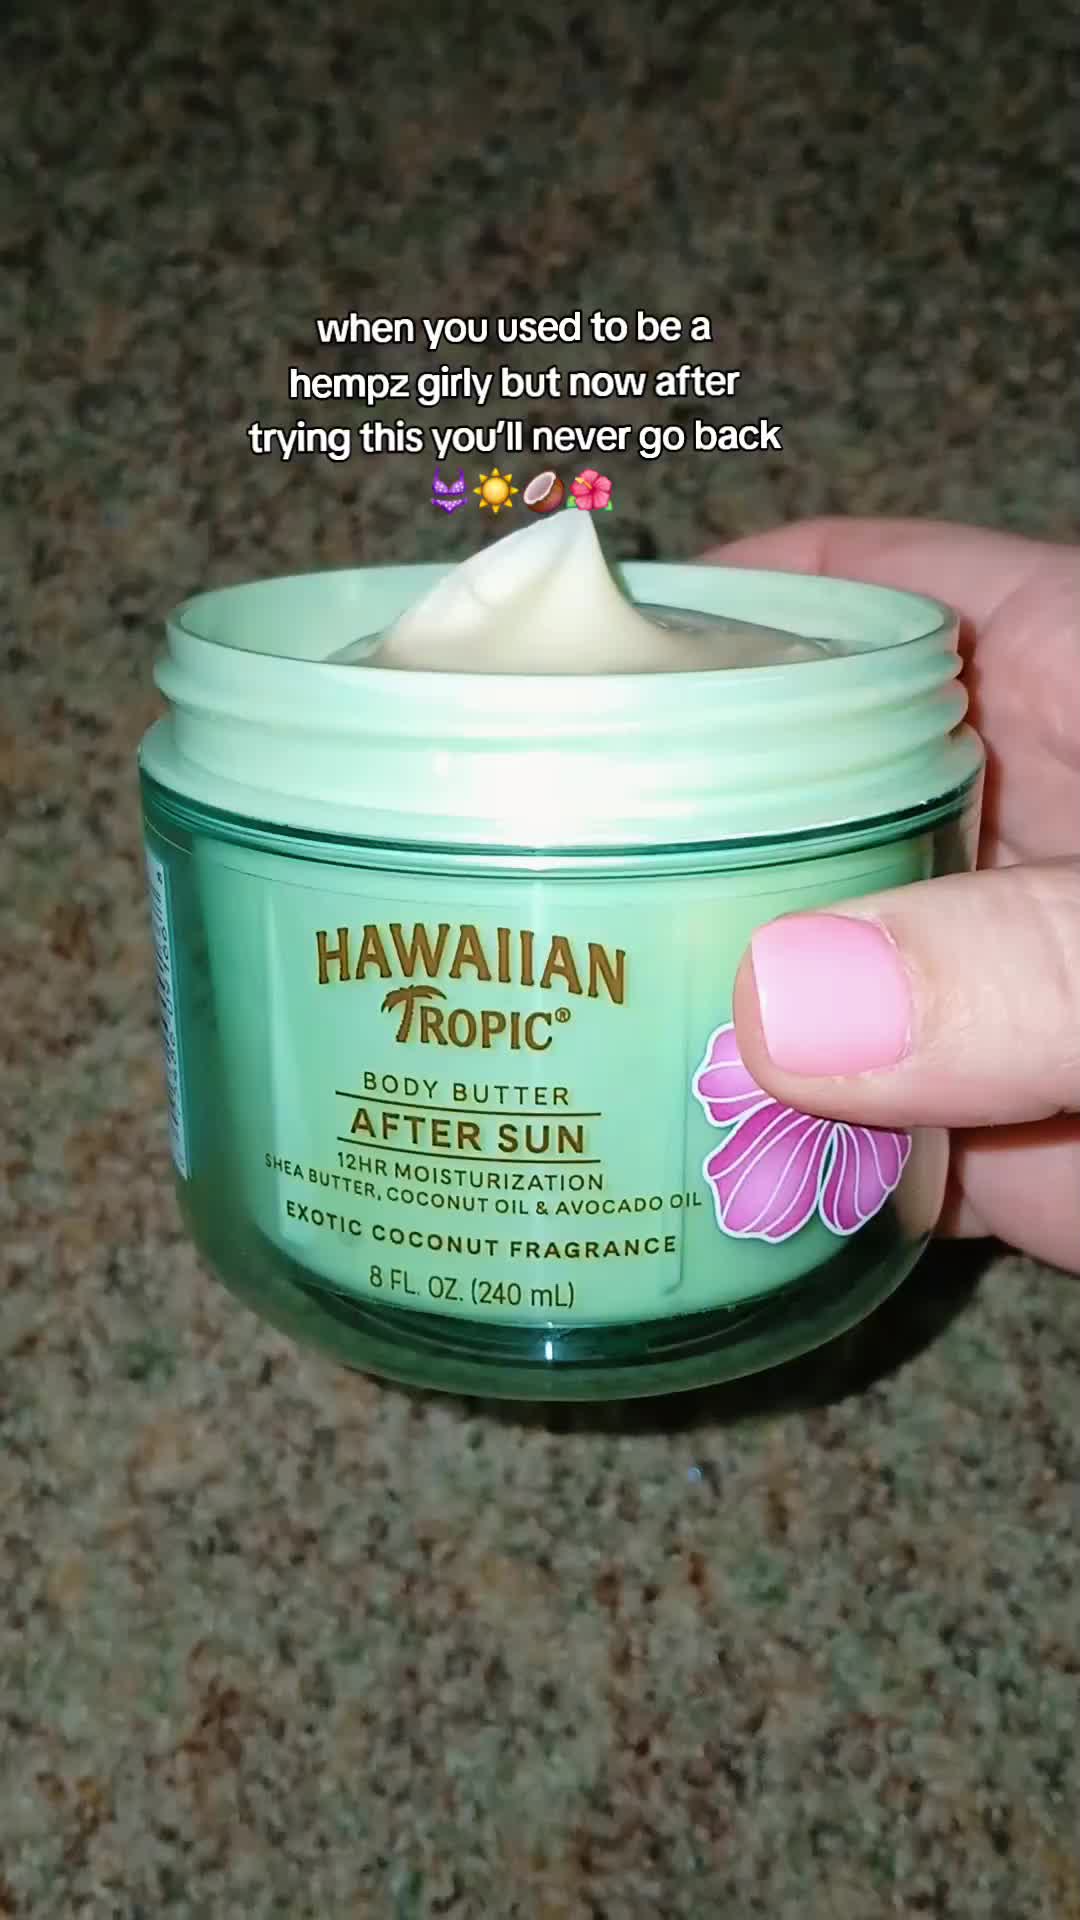
achendricks x Hawaiian Tropic
![TikTok post by @achendricks for Hawaiian Tropic. Caption reads: [...] be using this all summer long 🌞 @Hawaiian....](https://images.od.modash.io/b3958776c3538feba961ed7fe5ffe9a657184341)
Influencer bio
Business inquires: achendricks@linkcreatormgmt.com NYC
Collaboration metrics
Get a free trial to find more data on influencer audiences, performance, and collaborations.
If you break this down further by content type on TikTok, this is what it looks like:
- Videos: 95%
- Carousels: 5%
💡 Related resource: How To Find TikTok Influencers.
Influencer audience size breakdown (by views)
For their top social platform (TikTok), here is a breakdown of the type of influencers Hawaiian Tropic are collaborating with, by audience size.
Note: this breakdown is based on each influencer's average views (not follower/subscriber count), because views typically correlate more closely with influencer pricing and impact.
Hawaiian Tropic's influencers average views (TikTok)
Based on each influencer's average views per post
Hawaiian Tropic's creator selection appears relatively diversified across size tiers, with no single segment dominating. This suggests a balanced approach to influencer partnerships, spreading investment across different audience sizes.
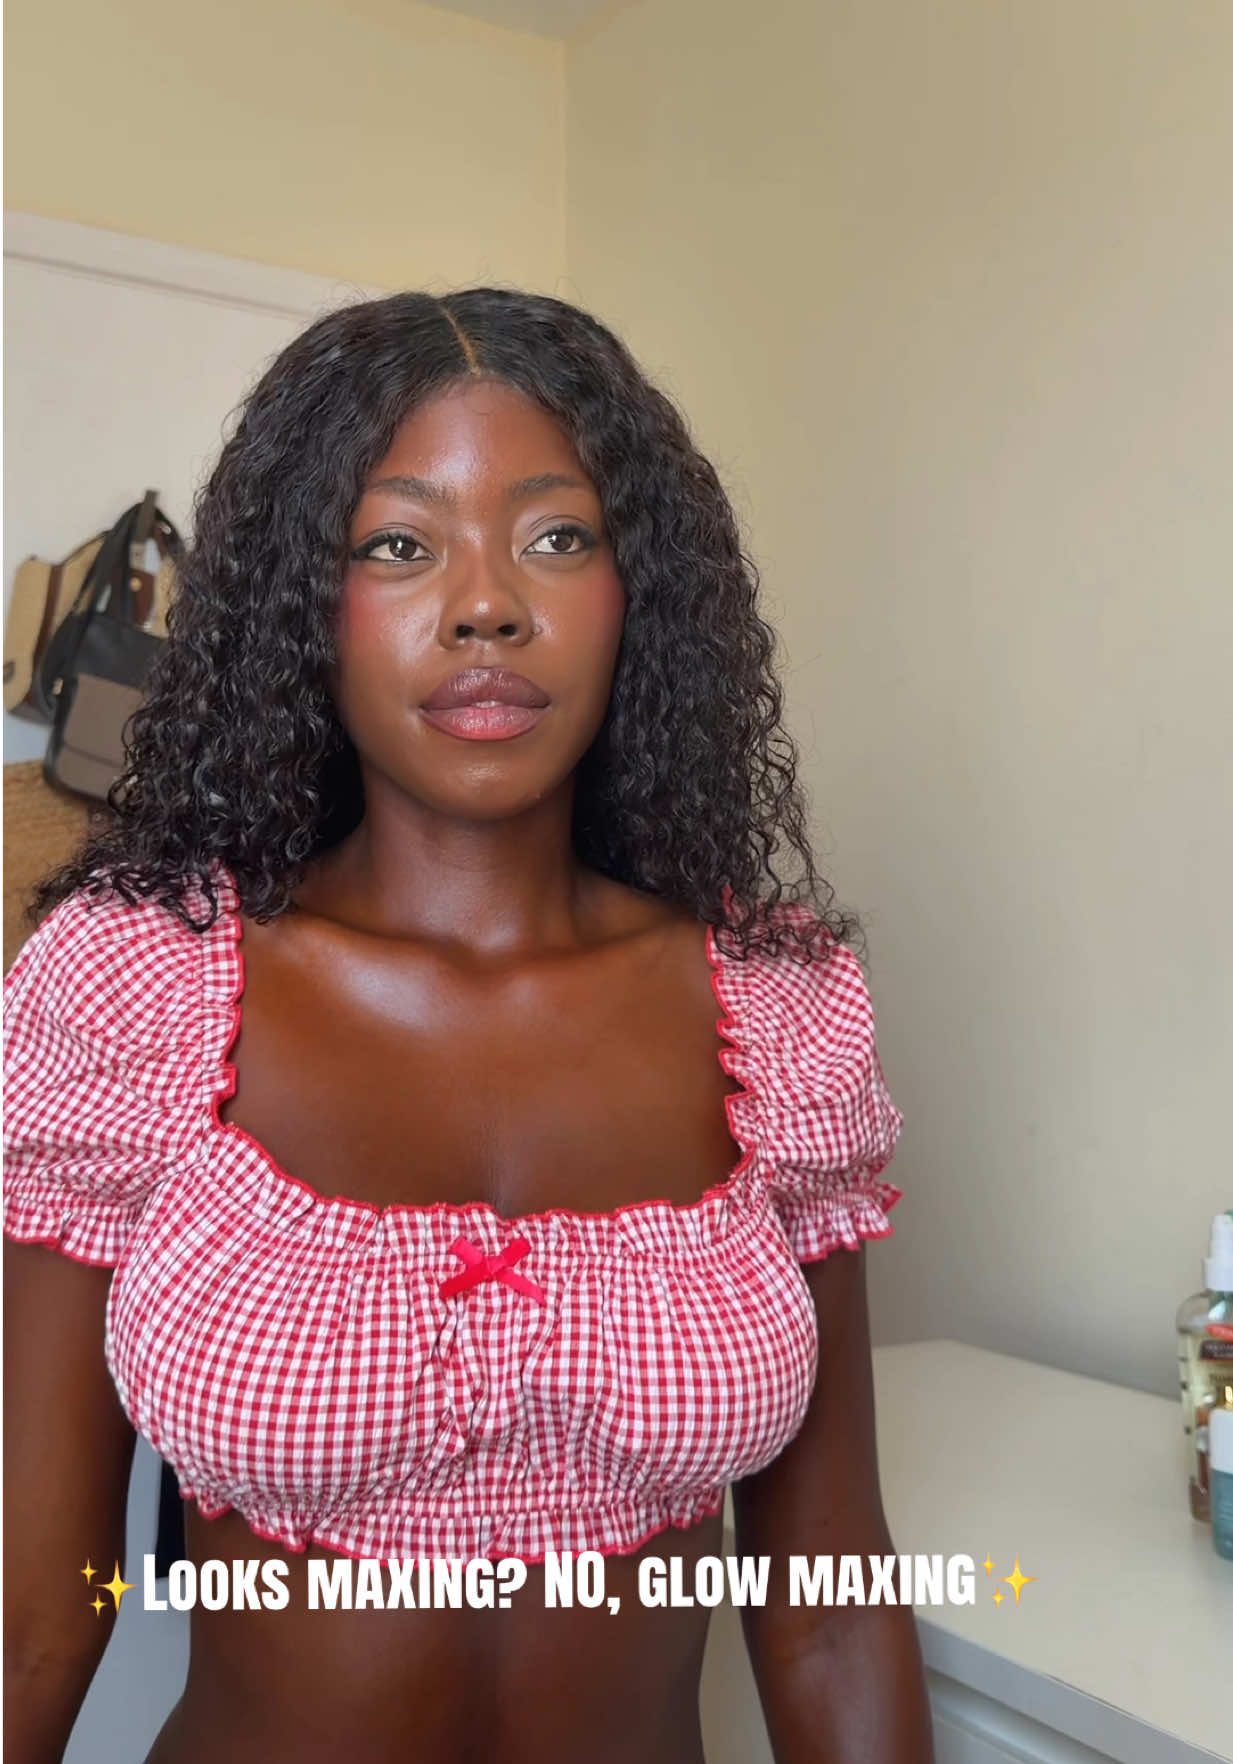
Here is an example of a sponsored collaboration with a larger-audience creator on TikTok (1.1M avg views/post):
shaniachristinad x Hawaiian Tropic
Influencer bio
Hi hiii 😙 MIA YouTube: ShaniaChristinad Shania@underscoretalent.com
Collaboration metrics
Get a free trial to find more data on influencer audiences, performance, and collaborations.
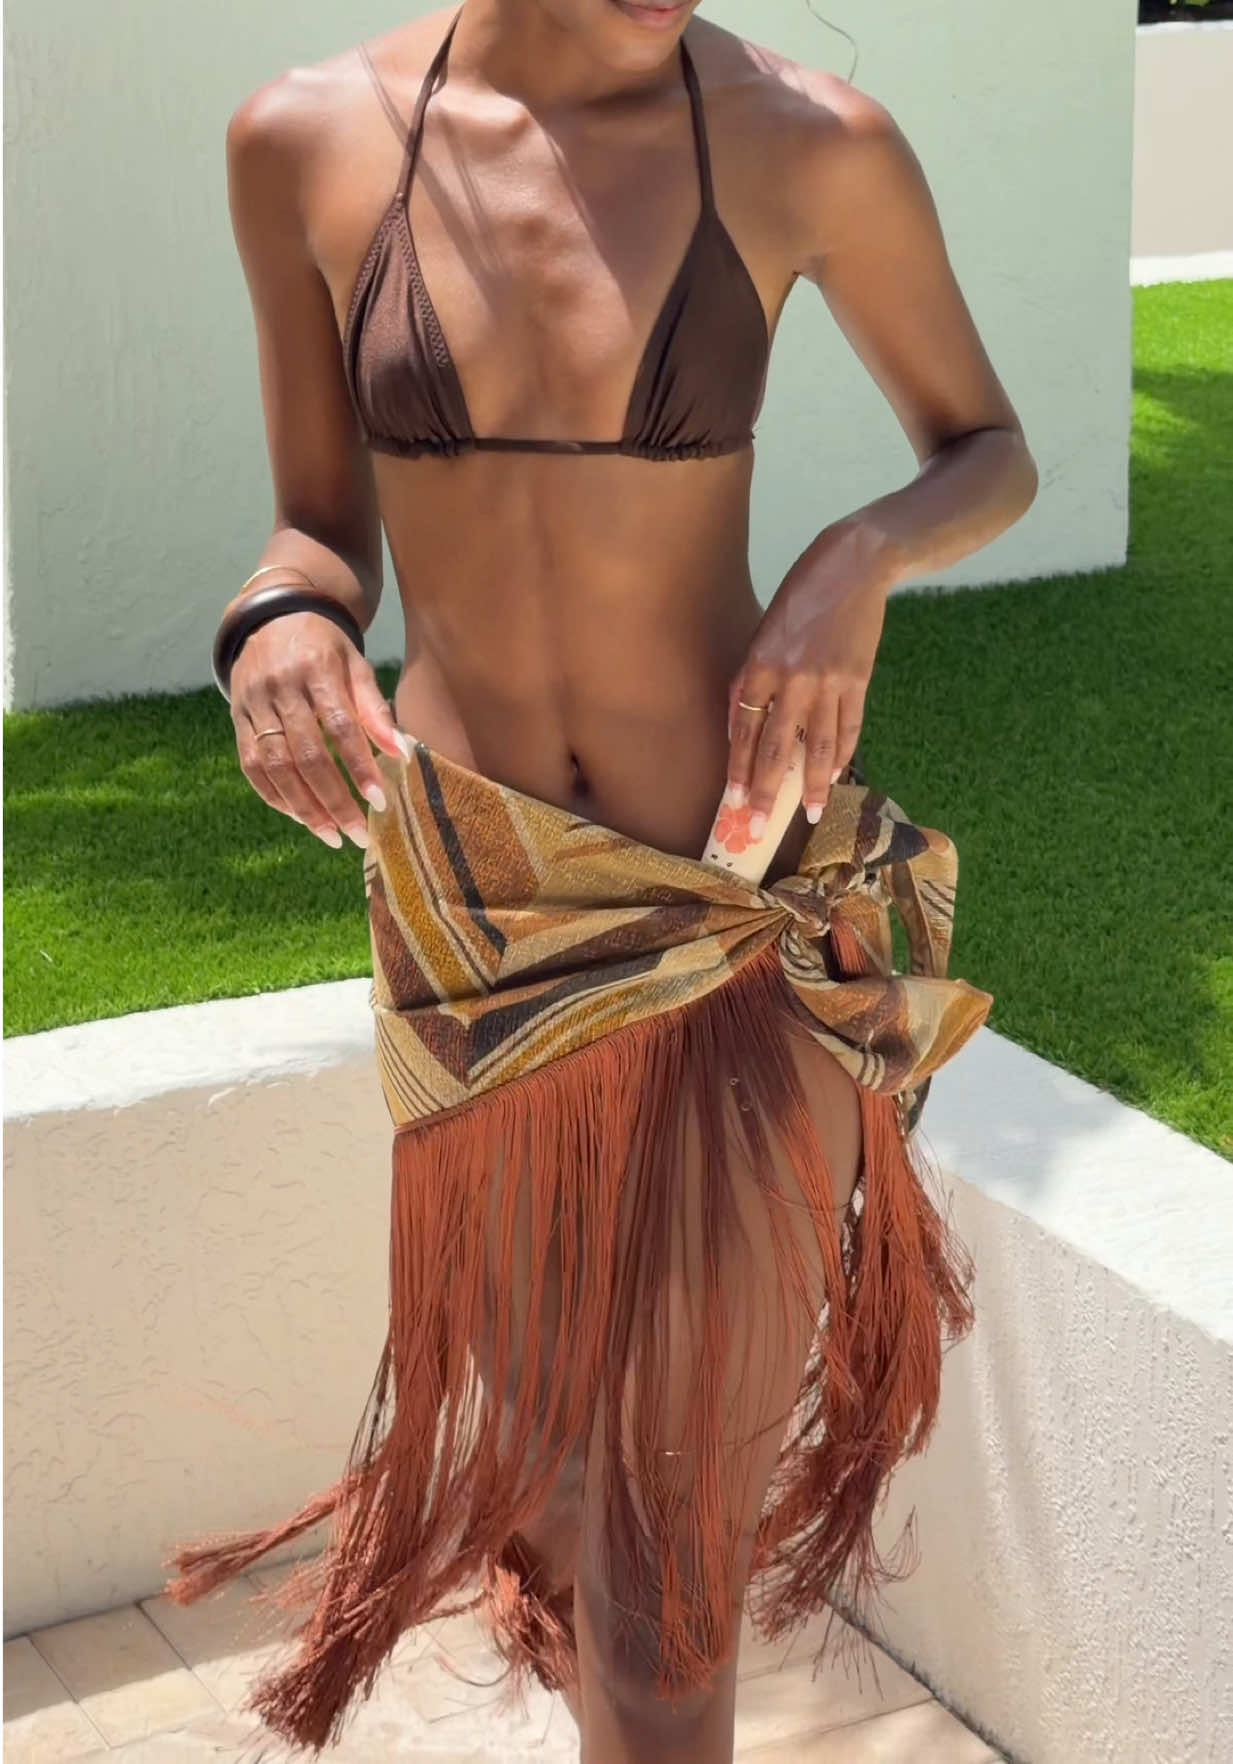
And here is another example with a smaller creator on TikTok (9.6k avg views/post):
roe.thompsonn x Hawaiian Tropic
Influencer bio
Look good, feel good || London🍒🍸🐆🪽 roethompson07@gmail.com CLICK THE LINK TO FIND THE ITEM
Collaboration metrics
Get a free trial to find more data on influencer audiences, performance, and collaborations.
Hawaiian Tropic's repeat partnerships
Out of 962 unique influencers in our dataset, 4 of them (0%) posted content for Hawaiian Tropic in 3 or more separate calendar months. The most consistent partner is @mama16181, who has collaborated across 4 months with 15 total posts.
Here are 3 examples of Hawaiian Tropic's repeat influencer partnerships, with links to the sponsored content.
mama16181 x Hawaiian Tropic
![TikTok post by @mama16181 for Hawaiian Tropic. Caption reads: @Hawaiian Tropic #Hawaiiantropic #tanning [...].](https://images.od.modash.io/cc32c164776d6a878d510886555fff1fe2b9ecb1)
si_swimsuit x Hawaiian Tropic
![Instagram post by @si_swimsuit for Hawaiian Tropic. Caption reads: [...] finishing touch thanks to @HawaiianTropic.](https://images.od.modash.io/c2698c5ae63096dde86dfbdad6502b2620fe29df)
![Instagram post by @si_swimsuit for Hawaiian Tropic. Caption reads: [...] to the social club, Hawaiian Tropic brought....](https://images.od.modash.io/0fc39ebb86b7fea1b2e03f9cc917a91f5c8db240)

marigonzalez x Hawaiian Tropic
![Instagram post by @marigonzalez for Hawaiian Tropic. Caption reads: [...] O cheirinho icônico de @hawaiiantropic.br e....](https://images.od.modash.io/bcfa1809ef972eb3fbb6551aff764306a6cab6e5)
![Instagram post by @marigonzalez for Hawaiian Tropic. Caption reads: [...] pra usar todos os dias! @hawaiiantropic.br....](https://images.od.modash.io/7fccb6e2382ddcb892a3731d92ff661ee4318956)
![Instagram post by @marigonzalez for Hawaiian Tropic. Caption reads: [...] que a gente ama, penso em....](https://images.od.modash.io/a3d71fa7ffca6a78beeae20c6cc3d1b52ae2e870)
💡 Related resource: Long-Term Influencer Partnerships: Pros, Cons & How The Pros Manage Them.
Geographical breakdown
In our dataset, United States is where Hawaiian Tropic had the most influencer activity. 29.9% of their live influencer content in the last 12 months was posted by American influencers.
Based on the percentage of influencer content per market, other important markets include:
- United Kingdom (9.9%)
- Germany (6.6%)
- Mexico (6.4%)
Hawaiian Tropic's influencer activity by market
Here is another example of Hawaiian Tropic collaborating with an influencer in United States.
costcoguide x Hawaiian Tropic
![Instagram post by @costcoguide for Hawaiian Tropic. Caption reads: [...] skin protected and glowing with....](https://images.od.modash.io/3176b8eba9c8e78c423befeb684dab2a6d964c1e)
Hawaiian Tropic's influencer activity vs. related brands
Hawaiian Tropic competes directly with Sun Bum and Supergoop for sunscreen and sun-care shoppers, especially during peak summer travel and beach season. They target overlapping creator niches like travel, beauty, and outdoor lifestyle for SPF education and product showcases.
Total influencer content
Hawaiian Tropic vs. related brands influencer activity
Total sponsored posts tracked (last 12 months)
Supergoop leads with 6.1k sponsored posts, significantly outpacing Hawaiian Tropic (1.2k posts) and Sun Bum (886 posts). Across all three brands, the average volume is 2.7k posts, indicating mature, scaled influencer programs. Supergoop has far more total posts than Hawaiian Tropic and Sun Bum.
By social platform
Hawaiian Tropic vs. related brands influencer activity (by social platform)
Sponsored posts by platform
Among these brands, Supergoop leads on Instagram, TikTok, and YouTube. The gap is most notable on TikTok, with Supergoop at 4.5k, Hawaiian Tropic at 644, Sun Bum at 244 posts. Sun Bum's activity is particularly concentrated on Instagram. Supergoop has far more TikTok and YouTube posts than Hawaiian Tropic and Sun Bum.
By geographical market
Hawaiian Tropic vs. related brands influencer activity (by country)
Estimated sponsored posts in Hawaiian Tropic's top markets
Supergoop has the highest estimated sponsored-post volume in United States (3.5k posts, 58.1%), Brazil (330 posts, 5.4%), United Kingdom (324 posts, 5.3%), while Hawaiian Tropic leads in Germany with 76 posts (6.6%). Looking at United States specifically, the split is Supergoop at 3.5k posts (58.1%), Sun Bum at 590 posts (66.6%), Hawaiian Tropic at 346 posts (29.9%). Hawaiian Tropic's strength in Germany may indicate a home-market focus, while Supergoop shows broader regional investment.
Read more influencer strategy breakdowns
Looking for more like this? Here are 5 similar influencer marketing strategy breakdowns for other brands:
- Sun Bum's Influencer Marketing Strategy
- Supergoop's Influencer Marketing Strategy
- EZ Tattoo Supply's Influencer Marketing Strategy
- Show Me Your Mumu's Influencer Marketing Strategy
- Monday Swimwear's Influencer Marketing Strategy
Or, if you want to access data like this for your own software or processes, take a look at Modash's API products:
Frequently asked questions
Scaling your influencer program?
When you outgrow your mishmash of spreadsheets & free tools, try Modash. Find & email influencers, track campaigns, ship products & more - all in one place.