Monday Swimwear Influencer Marketing Strategy
(2026 Data & Insights)
We analyzed 2.7k pieces of influencer content sponsored by Monday Swimwear over the last 12 months.
This report breaks down where & how Monday Swimwear invests in influencer marketing, which social platforms they prioritize, top geographical markets, and more.
The data in this report comes from Modash's Brand Collaborations API.
P.S. for a simple list of influencers who have collaborated with Monday Swimwear, see here: Monday Swimwear influencers.
Influencer activity throughout the year
Monday Swimwear's influencer campaigns are active year-round with notable month-to-month fluctuation. The chart below shows month-by-month data for total sponsored posts tracked.
Monday Swimwear's influencer activity by month
Number of sponsored posts
Monday Swimwear's sponsored post volume peaks in July with 354 posts, 60% higher than the monthly average of 221. December recorded the lowest activity at 109 posts, 51% below average.
Social platforms breakdown
In our dataset (which only includes Instagram, YouTube, and TikTok), this is how the volume of Monday Swimwear's sponsored influencer collaborations break down by social platform:
- Instagram: 2.1k posts (78.3%)
- TikTok: 562 posts (20.9%)
- YouTube: 20 posts (0.7%)
Monday Swimwear's influencer activity by platform
Share of sponsored content by social network
Instagram influencer marketing is a clear focus for Monday Swimwear.
Here are 3 examples of Monday Swimwear's recent sponsored collaborations (one each for Instagram, TikTok, YouTube).
albadiazmartin x Monday Swimwear
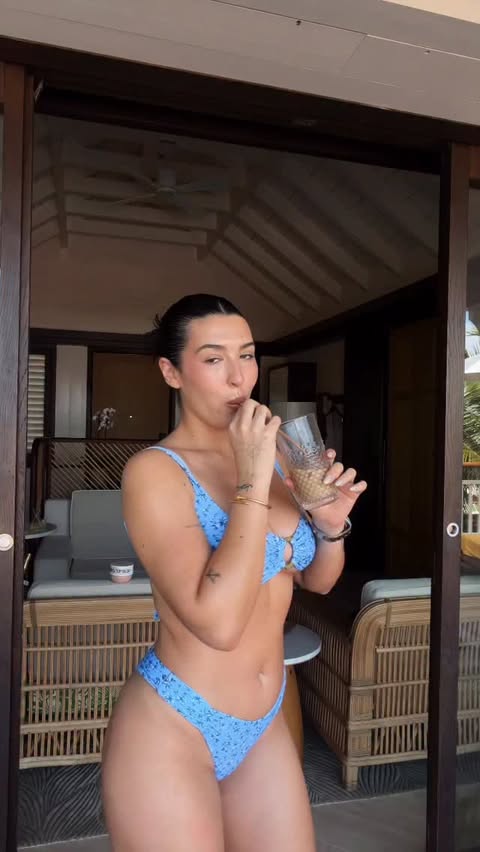
Influencer bio
@untie.agency
Collaboration metrics
Get a free trial to find more data on influencer audiences, performance, and collaborations.
averyyy_j11 x Monday Swimwear
Influencer bio
Hi there 🫶🏻 | Chicago | 👇🏼link below to shop posts + socials
Collaboration metrics
Get a free trial to find more data on influencer audiences, performance, and collaborations.
Gemaryermus x Monday Swimwear
Influencer bio
I create videos about simple, everyday fashion, interiors & lifestyle. I try to upload at least once a week. If you enjoy my videos, don't forget to subscribe & join the fam!
Collaboration metrics
Get a free trial to find more data on influencer audiences, performance, and collaborations.
If you break this down further by content type on Instagram, this is what it looks like:
- Posts: 68.4%
- Reels: 31.6%
💡 Related resource: How To Find Instagram Influencers.
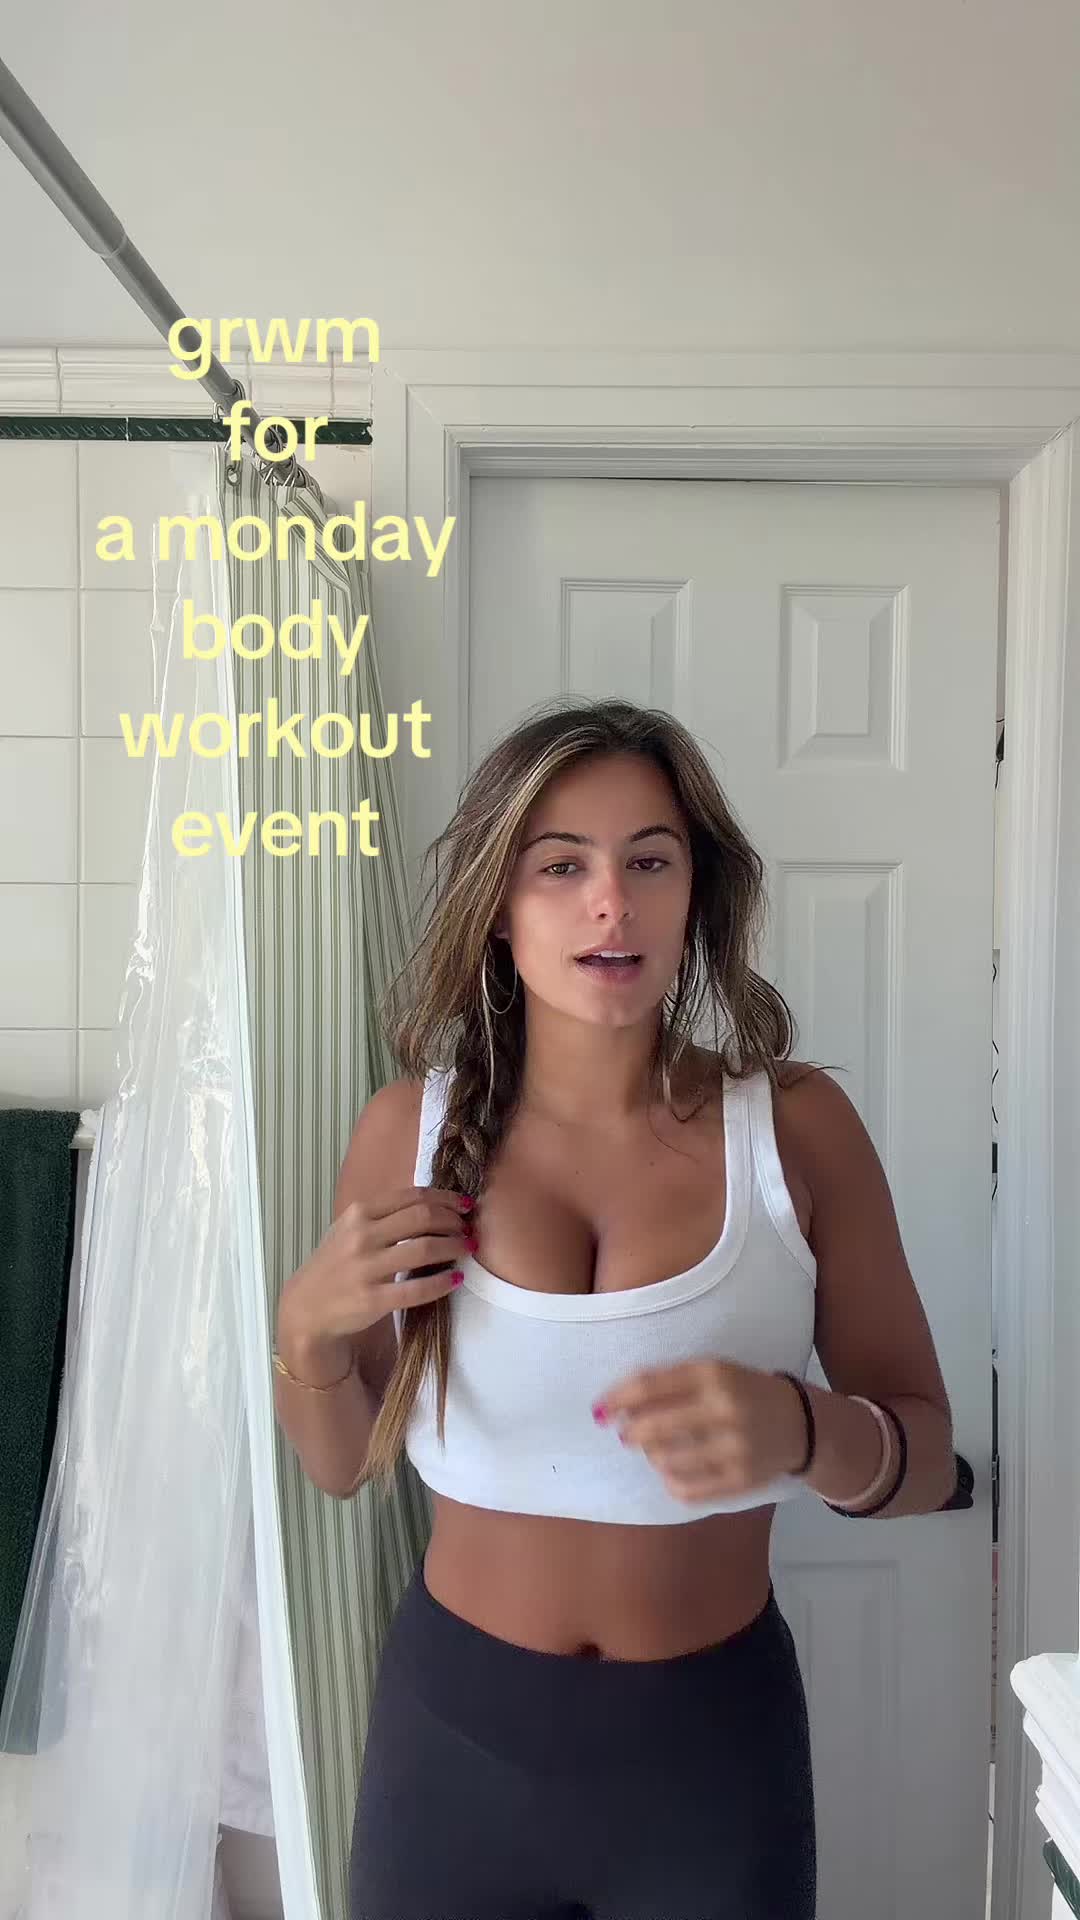
Influencer audience size breakdown (by views)
For their top social platform (Instagram), here is a breakdown of the type of influencers Monday Swimwear are collaborating with, by audience size.
Note: this breakdown is based on each influencer's average views (not follower/subscriber count), because views typically correlate more closely with influencer pricing and impact.
Monday Swimwear's influencers average views (Instagram)
Based on each influencer's average views per post
With 34.7% of partnerships featuring creators averaging 10K-50K views, Monday Swimwear's strategy suggests cost-efficiency and engagement-focused partnerships.
Here is an example of a sponsored collaboration with a larger-audience creator on Instagram (197.1k avg views/post):
devinbrugman x Monday Swimwear
![Instagram post by @devinbrugman for Monday Swimwear. Caption reads: [...] SALE STARTS NOW 😍 Code: BFCM25....](https://images.od.modash.io/2529640bfc6f455d1ddbcc4fb37e2a7faded07c1)
Influencer bio
Co Founder of @mondayswimwear & @mondaybody Dog mom to @waltersnaks
Collaboration metrics
Get a free trial to find more data on influencer audiences, performance, and collaborations.
And here is another example with a smaller creator on Instagram (8.6k avg views/post):
paigepilgs x Monday Swimwear
Influencer bio
📍 Chicago/London @selectmodelchicago @bridgemodels @bossmodelmanagement @maroemanagement
Collaboration metrics
Get a free trial to find more data on influencer audiences, performance, and collaborations.
Monday Swimwear's repeat partnerships
Out of 1.6k unique influencers in our dataset, 11 of them (1%) posted content for Monday Swimwear in 3 or more separate calendar months. The most consistent partner is @devinbrugman, who has collaborated across 12 months with 31 total posts.
Here are 2 examples of Monday Swimwear's repeat influencer partnerships, with links to the sponsored content.
imlorenaduran x Monday Swimwear
![Instagram post by @imlorenaduran for Monday Swimwear. Caption reads: [...] is the new black 🍫🤎 @mondayswimwear.](https://images.od.modash.io/90c033fef433bde2438671bd636b49df593e0a32)
![Instagram post by @imlorenaduran for Monday Swimwear. Caption reads: [...] Barth edition day one ✨🦋 @mondayswimwear.](https://images.od.modash.io/dd180cb8da3f0ce147e649f716e538b551bab23d)
![Instagram post by @imlorenaduran for Monday Swimwear. Caption reads: [...] day with my girls 🛥️ @mondayswimwear.](https://images.od.modash.io/456a4a81877def8a83b7d289cda9a576d8a88a2d)
thesegirlscom x Monday Swimwear
![Instagram post by @thesegirlscom for Monday Swimwear. Caption reads: [...] for the beach 🐚 wearing @mondayswimwear |....](https://images.od.modash.io/922352eb88e1068e1023c61c32a604a2a1717edf)
![Instagram post by @thesegirlscom for Monday Swimwear. Caption reads: [...] swimwear 👙✨ In order: @mondayswimwear....](https://images.od.modash.io/21779ff54ab5ea62a572b7a5913a0957225d0888)
![Instagram post by @thesegirlscom for Monday Swimwear. Caption reads: [...] babes, too 🌿 Wearing @mondayswimwear *ad....](https://images.od.modash.io/75cc0cf6ad3823cdc805f5b136fad06e3da28b95)
💡 Related resource: Long-Term Influencer Partnerships: Pros, Cons & How The Pros Manage Them.
Geographical breakdown
In our dataset, United States is where Monday Swimwear had the most influencer activity. 52.2% of their live influencer content in the last 12 months was posted by American influencers.
Based on the percentage of influencer content per market, other important markets include:
- United Kingdom (9.7%)
- Australia (7%)
- France (4%)
Monday Swimwear's influencer activity by market
Here is another example of Monday Swimwear collaborating with an influencer in United States.
isabella.lauren x Monday Swimwear
Monday Swimwear's influencer activity vs. related brands
Monday Swimwear competes for swimwear shoppers with Cupshe and Frankies Bikinis, sharing influencer angles around fit, vacation styling, and seasonal launch try-ons.
Total influencer content
Monday Swimwear vs. related brands influencer activity
Total sponsored posts tracked (last 12 months)
Cupshe leads with 11.3k sponsored posts, significantly outpacing Monday Swimwear (2.7k posts) and Frankies Bikinis (1.7k posts). Across all three brands, the average volume is 5.2k posts, indicating mature, scaled influencer programs. Cupshe has several times more total posts than Monday Swimwear and Frankies Bikinis.
By social platform
Monday Swimwear vs. related brands influencer activity (by social platform)
Sponsored posts by platform
Among these brands, Cupshe leads on Instagram, TikTok, and YouTube. The gap is most notable on TikTok, with Cupshe at 6.9k, Frankies Bikinis at 772, Monday Swimwear at 562 posts. Monday Swimwear's activity is particularly concentrated on Instagram. On TikTok, Cupshe has several times more posts than Monday Swimwear and Frankies Bikinis.
By geographical market
Monday Swimwear vs. related brands influencer activity (by country)
Estimated sponsored posts in Monday Swimwear's top markets
Cupshe has the highest estimated sponsored-post volume in United States (6.2k posts, 54.5%), United Kingdom (1k posts, 8.9%), France (725 posts, 6.4%), suggesting a Europe focus, while Monday Swimwear leads in Australia with 188 posts (7%), while Frankies Bikinis leads in Brazil with 95 posts (5.6%). Looking at United States specifically, the split is Cupshe at 6.2k posts (54.5%), Monday Swimwear at 1.4k posts (52.2%), Frankies Bikinis at 1.1k posts (62.3%).
Read more influencer strategy breakdowns
Looking for more like this? Here are 5 similar influencer marketing strategy breakdowns for other brands:
- Cupshe's Influencer Marketing Strategy
- Frankies Bikinis's Influencer Marketing Strategy
- ChicMe's Influencer Marketing Strategy
- Everlane's Influencer Marketing Strategy
- Christy Ng's Influencer Marketing Strategy
Or, if you want to access data like this for your own software or processes, take a look at Modash's API products:
Frequently asked questions
Scaling your influencer program?
When you outgrow your mishmash of spreadsheets & free tools, try Modash. Find & email influencers, track campaigns, ship products & more - all in one place.