Sponsored posts by month
Last 12 months
Oct '25
Nov '25
Dec '25
Jan '26
Feb '26
Mar '26
Apr '26
May '26
Jun '26
Jul '26
Aug '26
Sep '26
Join Modash Live to learn how marketers at Stanley 1913, goodwipes & Oddball are doing influencer marketing.

We analyzed 220 sponsored posts from Lioness Fashion across Instagram and TikTok over the last 12 months.
See where Lioness Fashion invests in influencer marketing — the platforms they prioritize, the creators they work with repeatedly, and the markets they push hardest. The data in this report comes from Modash's Brand Collaborations API.
Compared to the average month across the year, August was 47.3% more active in terms of posting frequency.
Last 12 months
Where Lioness Fashion's sponsored collaborations happen, and which content formats they use on each platform.
Across all of Lioness Fashion's accounts
Share of all sponsored posts.
Share of all sponsored posts.
We can separate videos from feed posts, but not single-image posts from carousels, so those are grouped together.
Reach and engagement across all 220 posts. We show median views alongside the average, because a single viral post can pull an average far above what a typical post achieves.

31.4K
Average views per post

2.9K
Median views per post

2.4M
Total views

$142K
Estimated media value

3.9%
Average engagement rate
These figures may include posts amplified with paid spend, which we can't identify separately.
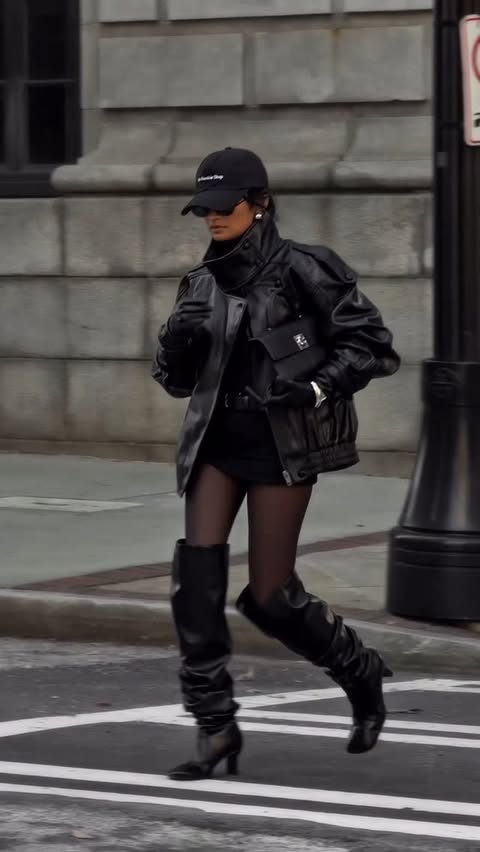
comment “love” to receive the outfits links ⬇ - Everyday outfit inspiration | ootd | [...]
Get a free trial to find more data on influencer audiences, past collabs and more.

(Ad @lioness_official) help me decide, comment your favourite 🐛
Get a free trial to find more data on influencer audiences, past collabs and more.

When it’s Revolve Festival and the entire hotel has Bieber Fever 💜😆🗣️🎶 Wearing [...]
Get a free trial to find more data on influencer audiences, past collabs and more.
Modash tracks sponsored posts across Instagram, TikTok and YouTube. Search any brand to see who they work with, how often, and how it performs.
The size of creator Lioness Fashion works with, measured by average views per post rather than follower count. Views track closer to the reach a brand actually gets, and follower counts can be inflated.
Share of the 59 creators in this dataset
Lioness Fashion's highest-reach creator partners over the last 12 months.
Want creator data programmatically?
Check out our API.
Whether Lioness Fashion works with creators once, or builds an ongoing roster.
Repeat creators make up 25.8% of Lioness Fashion's creator network and generate 31.6% of total reach. The charts below show how often those partnerships recur and how much of Lioness Fashion's audience reach they account for.
Repeat creators make up 25.8% of Lioness Fashion's creator network and generate 31.6% of total reach. The charts below show how often those partnerships recur and how much of Lioness Fashion's audience reach they account for.
Share of 124 creators
Repeat creators only
31.6%
of total reach comes from repeat creators
3.9
average posts per repeat creator
12 months
longest running partnership

hangin out @lioness_official 🩵 partnership SASKIA25
Get a free trial to find more data on influencer audiences, past collabs and more.

🦋 @lioness_official ad
Get a free trial to find more data on influencer audiences, past collabs and more.
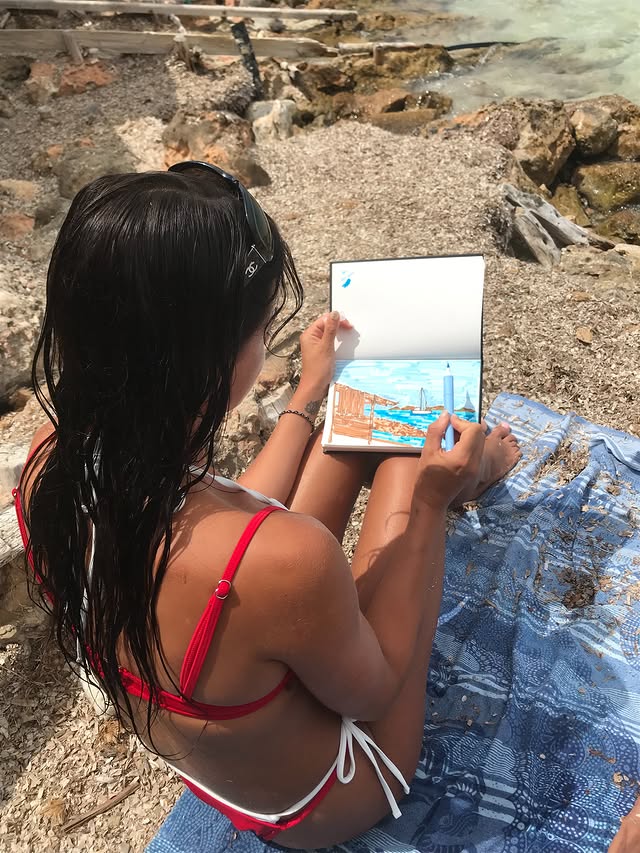
☮️&love kini from @lioness_official use my code BARBARA25 ad
Get a free trial to find more data on influencer audiences, past collabs and more.
The markets where Lioness Fashion's sponsored creators are based. 74.9% of sponsored posts came from creators based in 5 markets. United States and Australia lead at 22.6% and 20.8%, with the remaining 25.1% spread across a wider range of countries.
Top 11 markets
How Lioness Fashion's influencer activity compares with other women's apparel brands.
Lioness Fashion vs. related brands

10.2K posts

220 posts
203 posts
Find & email influencers, track campaigns, ship products & more. All in one place.

