Maria Nila Influencer Marketing Strategy
(2026 Data & Insights)
We analyzed 1.6k pieces of influencer content sponsored by Maria Nila over the last 12 months.
This report breaks down where & how Maria Nila invests in influencer marketing, which social platforms they prioritize, top geographical markets, and more.
The data in this report comes from Modash's Brand Collaborations API.
P.S. for a simple list of influencers who have collaborated with Maria Nila, see here: Maria Nila influencers.
Influencer activity throughout the year
Maria Nila's influencer campaigns are active year-round with notable month-to-month fluctuation. The chart below shows month-by-month data for total sponsored posts tracked.
Maria Nila's influencer activity by month
Number of sponsored posts
Maria Nila's influencer output appears relatively consistent throughout the year, averaging about 130 sponsored posts per month. May recorded the highest volume at 165 posts (27% above average), while April was the quietest at 89 posts.
Social platforms breakdown
In our dataset (which only includes Instagram, YouTube, and TikTok), this is how the volume of Maria Nila's sponsored influencer collaborations break down by social platform:
- TikTok: 912 posts (58.4%)
- Instagram: 646 posts (41.4%)
- YouTube: 4 posts (0.3%)
Maria Nila's influencer activity by platform
Share of sponsored content by social network
TikTok influencer marketing is a clear focus for Maria Nila.
Here are 3 examples of Maria Nila's recent sponsored collaborations (one each for Instagram, TikTok, YouTube).
samira.sfiii x Maria Nila
![Instagram post by @samira.sfiii for Maria Nila. Caption reads: [...] hack for the perfekt half up do w/....](https://images.od.modash.io/90574e684c6bcf7c48f459e3d5899b6ec4a07c62)
Influencer bio
just a girl with too many dresses & make-up✨ Based in Hamburg/ Germany @influencing101 ✉️ info@samirasafi.com
Collaboration metrics
Get a free trial to find more data on influencer audiences, performance, and collaborations.
sandimonzon x Maria Nila
![TikTok post by @sandimonzon for Maria Nila. Caption reads: [...] place I used the “Styling Spray” by @Maria....](https://images.od.modash.io/32235a8202740af7e43cafd338ae35e5b3c4b5db)
Influencer bio
@SalonCentric Team Estilista de cabello y maquillaje Especialista en peinados Novia Ubicada en Winder, GA Envíame un msj por WhatsApp
Collaboration metrics
Get a free trial to find more data on influencer audiences, performance, and collaborations.
hairtalkbyemelie x Maria Nila

Influencer bio
Jag jobbar som frisör, älskar beauty och driver instagramkontot @hairtalkbyemelie. Här inne får ni följa serien I Badrumsskåpet där jag gästar olika personers hem och badrumsskåp samt en massa andra härliga videos!
Collaboration metrics
Get a free trial to find more data on influencer audiences, performance, and collaborations.
If you break this down further by content type on TikTok, this is what it looks like:
- Videos: 98.7%
- Carousels: 1.3%
💡 Related resource: How To Find TikTok Influencers.
Influencer audience size breakdown (by views)
For their top social platform (TikTok), here is a breakdown of the type of influencers Maria Nila are collaborating with, by audience size.
Note: this breakdown is based on each influencer's average views (not follower/subscriber count), because views typically correlate more closely with influencer pricing and impact.
Maria Nila's influencers average views (TikTok)
Based on each influencer's average views per post
Maria Nila's creator selection appears relatively diversified across size tiers, with no single segment dominating. This suggests a balanced approach to influencer partnerships, spreading investment across different audience sizes.
Here is an example of a sponsored collaboration with a larger-audience creator on TikTok (361.8k avg views/post):
bauer_teresa x Maria Nila
![TikTok post by @bauer_teresa for Maria Nila. Caption reads: [...] gesundes Haar.✨Jetzt erhältlich unter....](https://images.od.modash.io/7e6c1271648f16e1cae28185d1eaba91f05a8adb)
Influencer bio
Hey cutie ✨🎀🤍 IG: bauer_teresa Collaboration: teresa@azureagency.de
Collaboration metrics
Get a free trial to find more data on influencer audiences, performance, and collaborations.
And here is another example with a smaller creator on TikTok (8.5k avg views/post):
beautybyellieparkhurst x Maria Nila
![TikTok post by @beautybyellieparkhurst for Maria Nila. Caption reads: [...] care routine 🫧🧖🏼♀️ ad @Sephora UK @Maria....](https://images.od.modash.io/472aa2e9afe4598b2c63aca469dd3678a3d46d14)
Influencer bio
makeup artist & beauty content 🤍 ✉️ poppy@wmgmt.co.uk @melybeauty "ELLIESEPHORA" for 20% off
Collaboration metrics
Get a free trial to find more data on influencer audiences, performance, and collaborations.
Maria Nila's repeat partnerships
Out of 868 unique influencers in our dataset, 43 of them (5%) posted content for Maria Nila in 3 or more separate calendar months. The most consistent partner is @adamlukacs, who has collaborated across 8 months with 14 total posts. @bencehankoszky alone accounts for 8% of all tracked sponsored content.
Here are 3 examples of Maria Nila's repeat influencer partnerships, with links to the sponsored content.
adamlukacs x Maria Nila
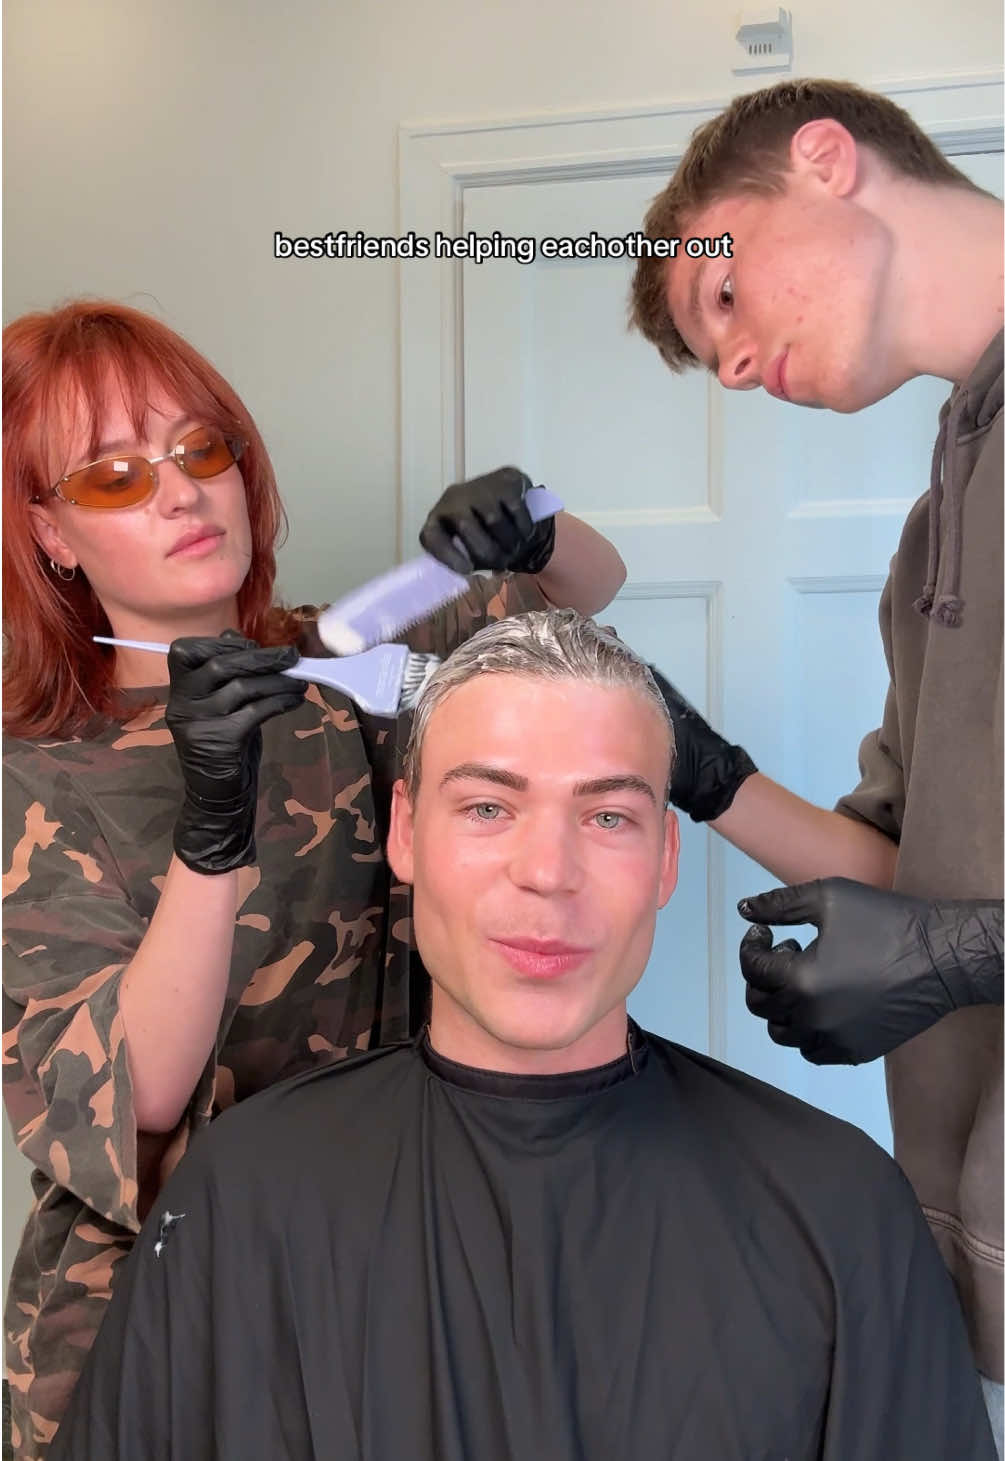
![TikTok post by @adamlukacs for Maria Nila. Caption reads: [...] med mig!! 🥹💘 reklam för @Maria Nila....](https://images.od.modash.io/0927666293127bb60b87ae28733b05944fc5a72f)
![TikTok post by @adamlukacs for Maria Nila. Caption reads: [...] ready @OMAR 💘 ad/ using @Maria Nila....](https://images.od.modash.io/1ade37b948d0cc8f9d265f23b7231e87766438a6)
cenkinz x Maria Nila
![Instagram post by @cenkinz for Maria Nila. Caption reads: [...] ihrer Haare abgedunkelt mit....](https://images.od.modash.io/49f2d21f62a7efca61dc3f24ad58d8678e01f566)
![Instagram post by @cenkinz for Maria Nila. Caption reads: [...] gebe ich am liebsten mit den....](https://images.od.modash.io/38925072a586f76d4bebb219e8700d04a2c85b78)
![Instagram post by @cenkinz for Maria Nila. Caption reads: [...] ??😍 *Werbung Wir haben mit....](https://images.od.modash.io/161613dc8bd2b23a8668969a5abc7f961822d621)
cenkinz x Maria Nila
![TikTok post by @cenkinz for Maria Nila. Caption reads: [...] ihrer Haare abgedunkelt mit @Maria Nila +....](https://images.od.modash.io/61c9ac40266757ea35a00040dd42aa95de49cbfe)
![TikTok post by @cenkinz for Maria Nila. Caption reads: [...] Ammoniak haben wir mit der @Maria Nila Cover....](https://images.od.modash.io/cde0e839404d43b64e76d67c786432374af0e961)
![TikTok post by @cenkinz for Maria Nila. Caption reads: [...] Anschließend mit @Maria Nila Sheer....](https://images.od.modash.io/686704d70d764d0278d980972eb003c40f206fa5)
💡 Related resource: Long-Term Influencer Partnerships: Pros, Cons & How The Pros Manage Them.
Geographical breakdown
In our dataset, United States is where Maria Nila had the most influencer activity. 32.7% of their live influencer content in the last 12 months was posted by American influencers.
Based on the percentage of influencer content per market, other important markets include:
- United Kingdom (19.6%)
- France (6.9%)
- Sweden (4.9%)
Maria Nila's influencer activity by market
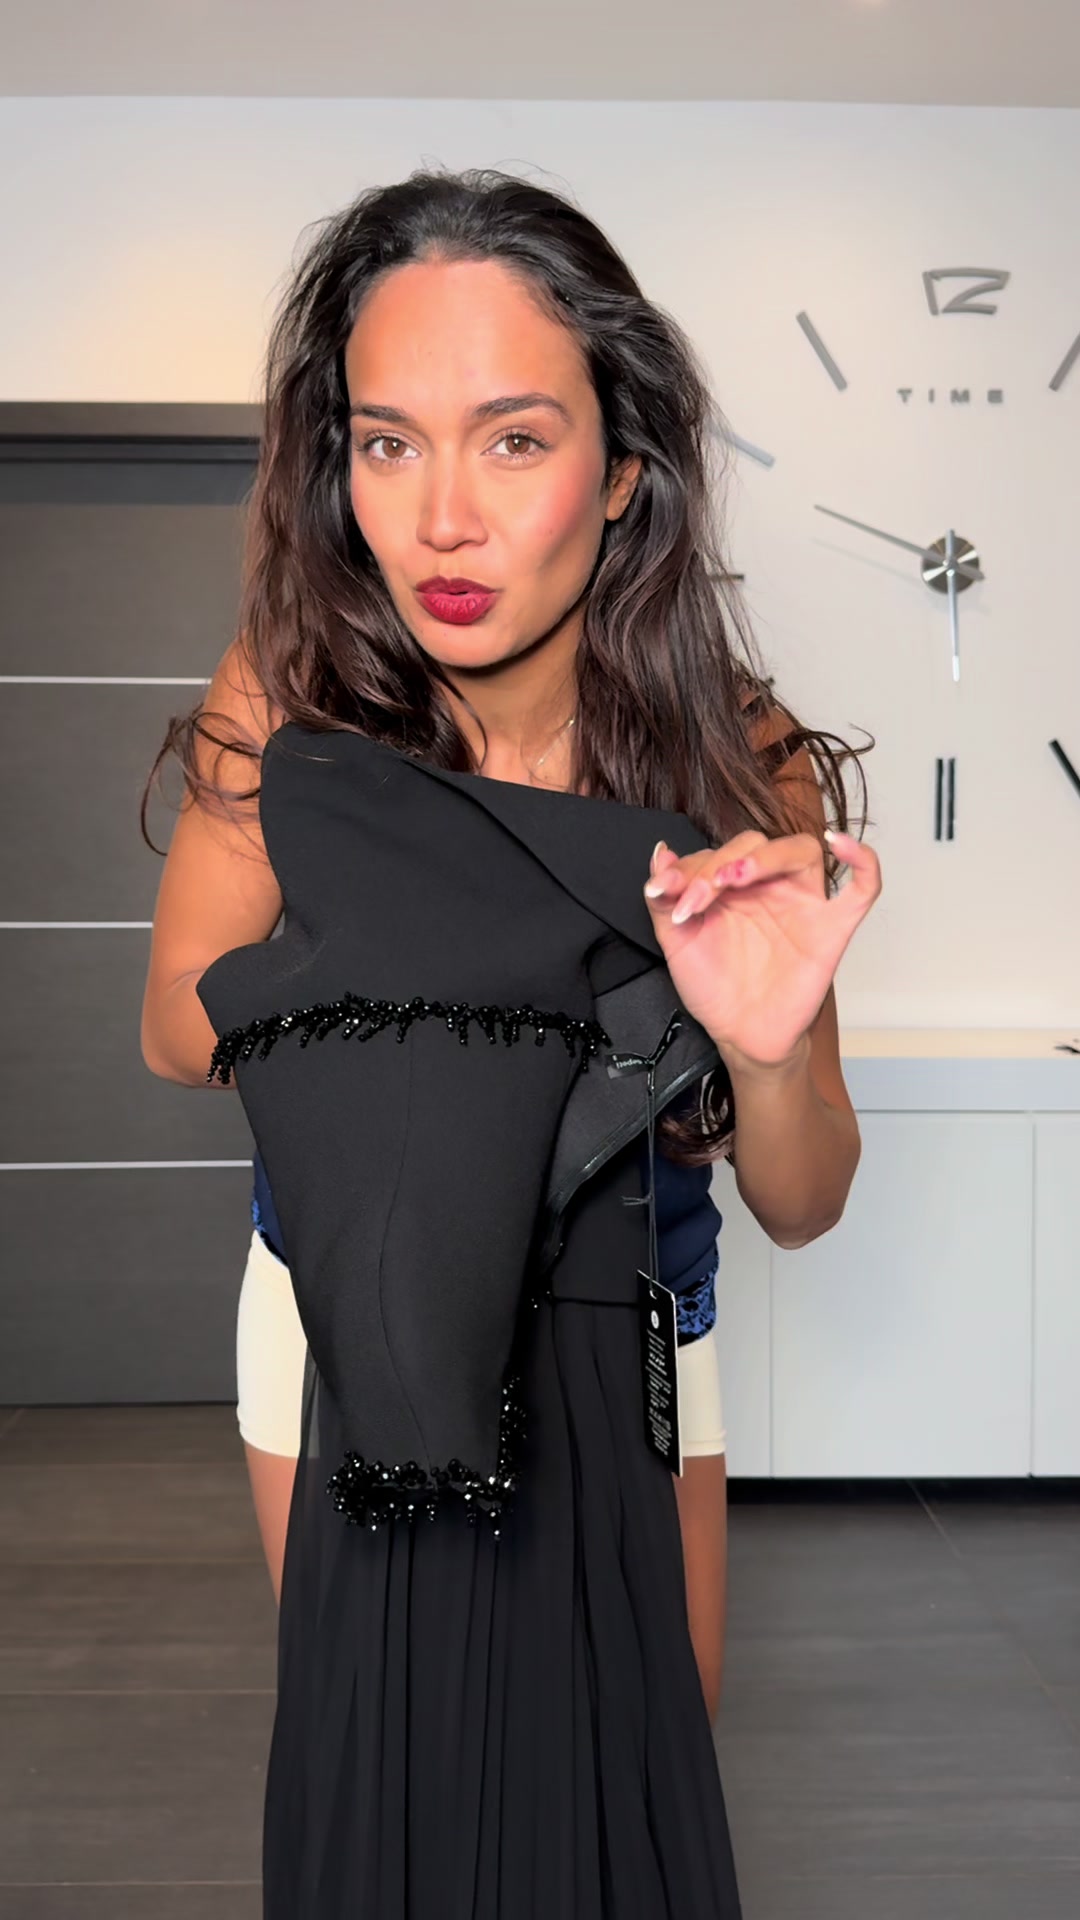
Here is another example of Maria Nila collaborating with an influencer in France.
cynthia__blin x Maria Nila
Maria Nila's influencer activity vs. related brands
Maria Nila competes with OUAI and Living Proof in premium haircare positioned around performance and routine building. All three brands use salon pros and beauty creators to demonstrate results and justify higher price points.
Total influencer content
Maria Nila vs. related brands influencer activity
Total sponsored posts tracked (last 12 months)
Living Proof leads with 6.2k sponsored posts, marginally ahead of OUAI (5.7k posts) and Maria Nila (1.6k posts). Across all three brands, the average volume is 4.5k posts, indicating mature, scaled influencer programs. OUAI and Living Proof each have about four times as many total posts as Maria Nila.
By social platform
Maria Nila vs. related brands influencer activity (by social platform)
Sponsored posts by platform
Among these brands, Living Proof leads on Instagram and OUAI leads on TikTok and YouTube. The gap is most notable on Instagram, with Living Proof at 2.5k, OUAI at 1.5k, Maria Nila at 646 posts. OUAI's activity is particularly concentrated on TikTok. On TikTok, OUAI and Living Proof each have about four times as many posts as Maria Nila.
By geographical market
Maria Nila vs. related brands influencer activity (by country)
Estimated sponsored posts in Maria Nila's top markets
Living Proof has the highest estimated sponsored-post volume in United States (3.9k posts, 62.8%), United Kingdom (783 posts, 12.7%), India (228 posts, 3.7%), while OUAI leads in Indonesia with 291 posts (5.1%), while Maria Nila leads in France with 108 posts (6.9%). Looking at United States specifically, the split is Living Proof at 3.9k posts (62.8%), OUAI at 3.3k posts (57.6%), Maria Nila at 511 posts (32.7%). Maria Nila's strength in France may indicate a home-market focus, while OUAI shows broader regional investment.
Read more influencer strategy breakdowns
Looking for more like this? Here are 5 similar influencer marketing strategy breakdowns for other brands:
- OUAI's Influencer Marketing Strategy
- Living Proof's Influencer Marketing Strategy
- Nine West's Influencer Marketing Strategy
- FrostBuddy's Influencer Marketing Strategy
- Prequel Skin's Influencer Marketing Strategy
Or, if you want to access data like this for your own software or processes, take a look at Modash's API products:
Scaling your influencer program?
When you outgrow your mishmash of spreadsheets & free tools, try Modash. Find & email influencers, track campaigns, ship products & more - all in one place.