OUAI Influencer Marketing Strategy
(2026 Data & Insights)
We analyzed 5.8k pieces of influencer content sponsored by OUAI over the last 12 months.
This report breaks down where & how OUAI invests in influencer marketing, which social platforms they prioritize, top geographical markets, and more.
The data in this report comes from Modash's Brand Collaborations API.
P.S. for a simple list of influencers who have collaborated with OUAI, see here: OUAI influencers.
Influencer activity throughout the year
OUAI's influencer campaigns are active year-round with notable month-to-month fluctuation. The chart below shows month-by-month data for total sponsored posts tracked.
OUAI's influencer activity by month
Number of sponsored posts
OUAI's influencer posting pattern appears irregular, with notable fluctuations month to month. December saw the highest output at 722 posts (49% above the 485 monthly average), while June was the quietest at 190 posts.
Social platforms breakdown
In our dataset (which only includes Instagram, YouTube, and TikTok), this is how the volume of OUAI's sponsored influencer collaborations break down by social platform:
- TikTok: 4.3k posts (74.3%)
- Instagram: 1.5k posts (25.1%)
- YouTube: 38 posts (0.7%)
OUAI's influencer activity by platform
Share of sponsored content by social network
TikTok influencer marketing is a clear focus for OUAI.
Here are 3 examples of OUAI's recent sponsored collaborations (one each for Instagram, TikTok, YouTube).
miammarquez x OUAI
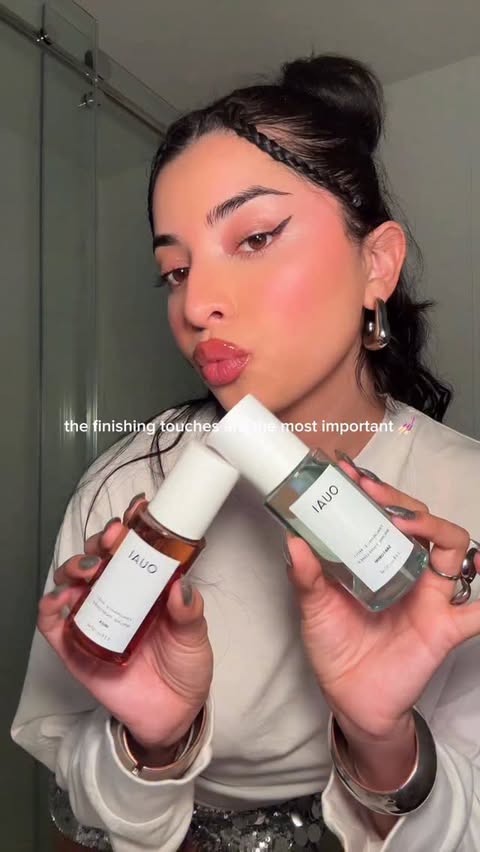
Influencer bio
♡︎ nyc ⁂❤︎︎ @recovered.by.m 🪡 recovered.the.label@gmail.com mgmt: @koshu.co mia@koshu.co
Collaboration metrics
Get a free trial to find more data on influencer audiences, performance, and collaborations.
dananozime x OUAI
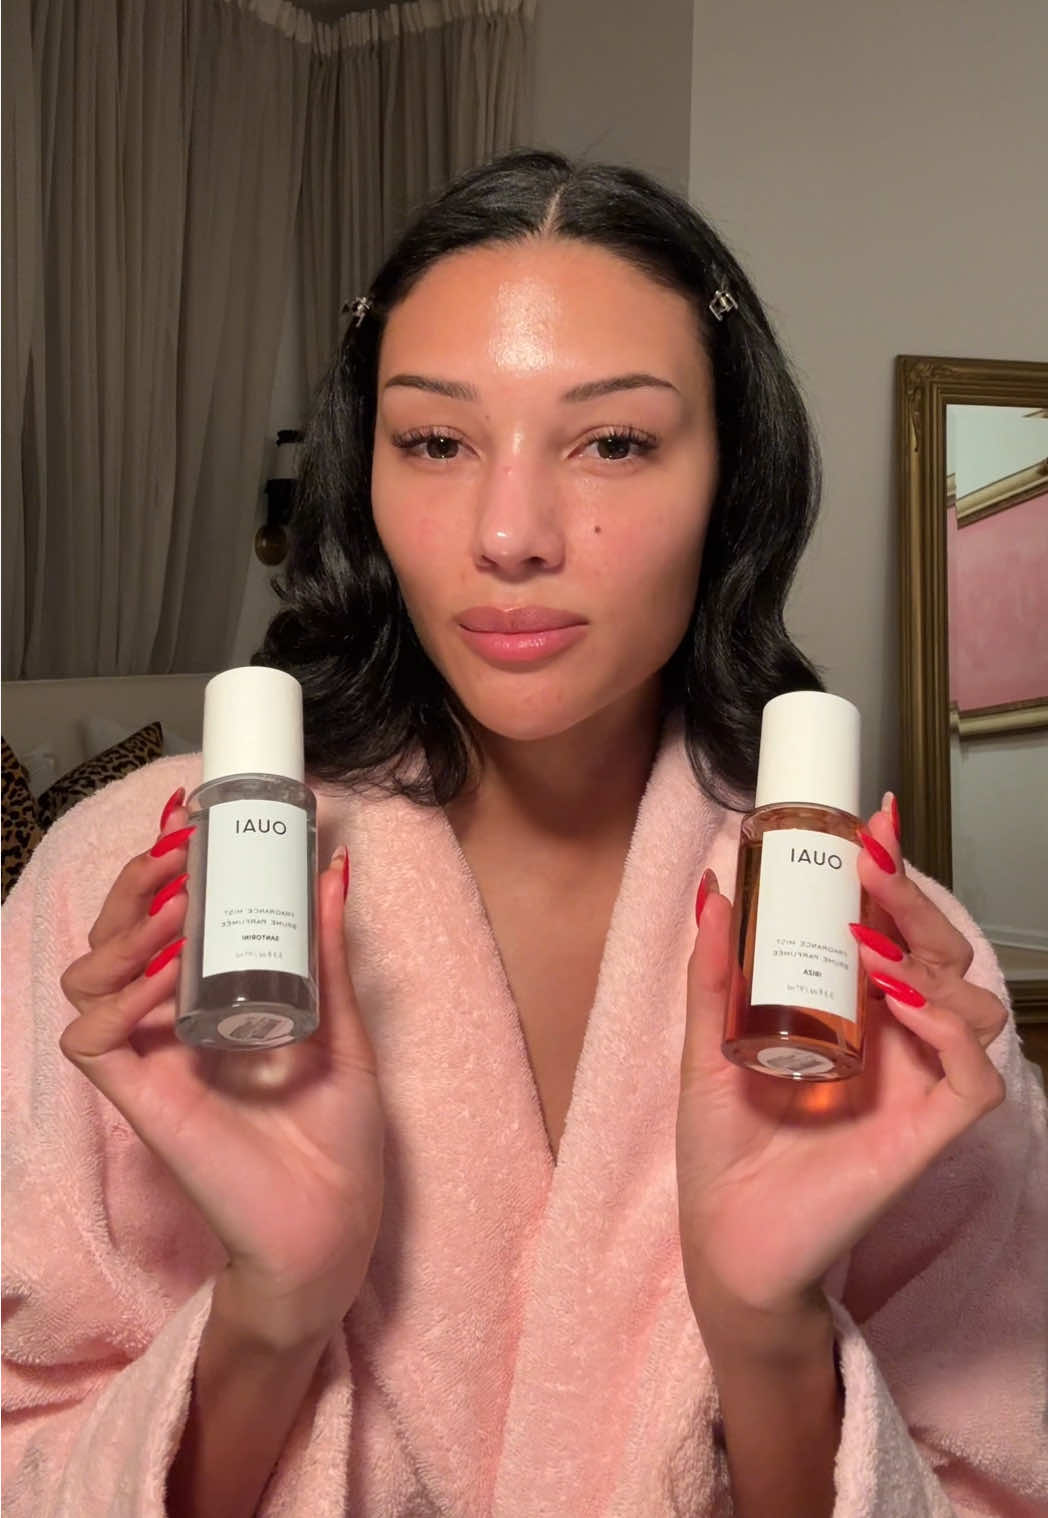
Influencer bio
beauty, fashion, and lifestyle — chicago 🧚🏽♀️ ✉️ dana@underscoretalent.com
Collaboration metrics
Get a free trial to find more data on influencer audiences, performance, and collaborations.
lilypebbles x OUAI
![YouTube post by @lilypebbles for OUAI. Caption reads: [...] & Co Rehab Dose 0 Matcha Scalp Hair Oil Ouai....](https://images.od.modash.io/14d8133d9cd191e2a6a350df056a5b08b35c277f)
Influencer bio
OG Comfort Creator // Here for the authentic, slower paced content. Weekly vlogs every Sunday 7.00am GMT. Style - Food - Beauty - London - Home Follow on Instagram @lilypebbles
Collaboration metrics
Get a free trial to find more data on influencer audiences, performance, and collaborations.
If you break this down further by content type on TikTok, this is what it looks like:
- Videos: 95.2%
- Carousels: 4.8%
💡 Related resource: How To Find TikTok Influencers.
Influencer audience size breakdown (by views)
For their top social platform (TikTok), here is a breakdown of the type of influencers OUAI are collaborating with, by audience size.
Note: this breakdown is based on each influencer's average views (not follower/subscriber count), because views typically correlate more closely with influencer pricing and impact.
OUAI's influencers average views (TikTok)
Based on each influencer's average views per post
OUAI's creator selection appears relatively diversified across size tiers, with no single segment dominating. This suggests a balanced approach to influencer partnerships, spreading investment across different audience sizes.
Here is an example of a sponsored collaboration with a larger-audience creator on TikTok (6.2M avg views/post):
jayjaymarie_ x OUAI
![TikTok post by @jayjaymarie_ for OUAI. Caption reads: [...] residue, I’m in love. #complimentary....](https://images.od.modash.io/3c8ff130a5448f9aa120d7a80b2a18d4e6de0af1)
Influencer bio
💌:jaycmarie07@gmail.com 💙
Collaboration metrics
Get a free trial to find more data on influencer audiences, performance, and collaborations.
And here is another example with a smaller creator on TikTok (173 avg views/post):
ladietiktokshop x OUAI
![TikTok post by @ladietiktokshop for OUAI. Caption reads: [...] without trying” starter kit 😍🎁✨ OUAI....](https://images.od.modash.io/544bc015c7f42ee5cc1ffc9bfbee1ece48a0dd8e)
Influencer bio
Lifestyle + Beauty + Fashion + Faith🙏🏽 Over 40 LIVE HOST 🎥 Orlando/NYC 📧 MsLadieW@gmail.com 🩷💚
Collaboration metrics
Get a free trial to find more data on influencer audiences, performance, and collaborations.
OUAI's repeat partnerships
Out of 4.1k unique influencers in our dataset, 84 of them (2%) posted content for OUAI in 3 or more separate calendar months. The most consistent partner is @byemmaleah, who has collaborated across 11 months with 16 total posts.
Here are 3 examples of OUAI's repeat influencer partnerships, with links to the sponsored content.
byemmaleah x OUAI
![Instagram post by @byemmaleah for OUAI. Caption reads: [...] @vegamour gro shampoo* @theouai scalp and....](https://images.od.modash.io/abbba7cd91799460282c0a58764314756248720c)
![Instagram post by @byemmaleah for OUAI. Caption reads: [...] 🌙🧡🎀🧚♂️🦋🫧 products @theouai scalp +....](https://images.od.modash.io/08c05755a5151c65df42f96d1450b64f725ea81f)
![Instagram post by @byemmaleah for OUAI. Caption reads: [...] molecular repair hair mask* @theouai scalp....](https://images.od.modash.io/92a1a21f99a3b7c57f7870fd6049640c4d5ae960)
by.emmaleah x OUAI
![TikTok post by @by.emmaleah for OUAI. Caption reads: [...] Inc. restore shampoo* @THE OUAI scalp + body....](https://images.od.modash.io/c1928dce763fe0236e8b92b87bc03f3c99693e97)
![TikTok post by @by.emmaleah for OUAI. Caption reads: [...] UK elvive extraordinary oil* @OUAI santorini....](https://images.od.modash.io/7446a7a92c7f42a8802cd8c4af93b224e7a32817)
![TikTok post by @by.emmaleah for OUAI. Caption reads: [...] honey infused hair oil* @THE OUAI body....](https://images.od.modash.io/512cfa9840e7b6d9e7450f1a6828d913f4ad0013)
psychictexas x OUAI
![TikTok post by @psychictexas for OUAI. Caption reads: [...] north bondi fragrance ✨ @THE OUAI #fyp....](https://images.od.modash.io/9326466de5fbe6b3f344e1d5db87b8e6783c495a)
💡 Related resource: Long-Term Influencer Partnerships: Pros, Cons & How The Pros Manage Them.
Geographical breakdown
In our dataset, United States is where OUAI had the most influencer activity. 55.2% of their live influencer content in the last 12 months was posted by American influencers.
Based on the percentage of influencer content per market, other important markets include:
- United Kingdom (8.8%)
- Indonesia (4.9%)
- India (4.7%)
OUAI's influencer activity by market
Here is another example of OUAI collaborating with an influencer in United States.
becamichie x OUAI
![TikTok post by @becamichie for OUAI. Caption reads: [...] I smell so good bc of the new @THE OUAI....](https://images.od.modash.io/50d14e7a6600b0c489987aecf8e7503ac7c3a433)
OUAI's influencer activity vs. related brands
OUAI competes with Moroccanoil and Briogeo in premium haircare positioned around salon-quality results and sensorial branding, where creator routines and styling tutorials directly influence purchase intent.
Total influencer content
OUAI vs. related brands influencer activity
Total sponsored posts tracked (last 12 months)
Moroccanoil leads with 8.6k sponsored posts, significantly outpacing OUAI (5.8k posts) and Briogeo (1.9k posts). Across all three brands, the average volume is 5.5k posts, indicating mature, scaled influencer programs.
By social platform
OUAI vs. related brands influencer activity (by social platform)
Sponsored posts by platform
Among these brands, Moroccanoil leads on Instagram, TikTok, and YouTube. The gap is most notable on Instagram, with Moroccanoil at 3.8k, OUAI at 1.5k, Briogeo at 687 posts. OUAI's activity is particularly concentrated on TikTok. On Instagram, Moroccanoil has multiple times more posts than OUAI and Briogeo.
By geographical market
OUAI vs. related brands influencer activity (by country)
Estimated sponsored posts in OUAI's top markets
Moroccanoil has the highest estimated sponsored-post volume in United States (3.3k posts, 38.3%), United Kingdom (743 posts, 8.6%), India (579 posts, 6.7%), while OUAI leads in Indonesia with 285 posts (4.9%), while Briogeo leads in Brazil with 103 posts (5.4%). Looking at United States specifically, the split is Moroccanoil at 3.3k posts (38.3%), OUAI at 3.2k posts (55.2%), Briogeo at 1.2k posts (64.7%).
Read more influencer strategy breakdowns
Looking for more like this? Here are 5 similar influencer marketing strategy breakdowns for other brands:
- Moroccanoil's Influencer Marketing Strategy
- Briogeo's Influencer Marketing Strategy
- Jeffrey Campbell Shoes's Influencer Marketing Strategy
- ZARA's Influencer Marketing Strategy
- DISSH's Influencer Marketing Strategy
Or, if you want to access data like this for your own software or processes, take a look at Modash's API products:
Frequently asked questions
Scaling your influencer program?
When you outgrow your mishmash of spreadsheets & free tools, try Modash. Find & email influencers, track campaigns, ship products & more - all in one place.