POPFLEX Active Influencer Marketing Strategy
(2026 Data & Insights)
We analyzed 4.3k pieces of influencer content sponsored by POPFLEX Active over the last 12 months.
This report breaks down where & how POPFLEX Active invests in influencer marketing, which social platforms they prioritize, top geographical markets, and more.
The data in this report comes from Modash's Brand Collaborations API.
P.S. for a simple list of influencers who have collaborated with POPFLEX Active, see here: POPFLEX Active influencers.
Influencer activity throughout the year
POPFLEX Active's influencer campaigns are active year-round with notable month-to-month fluctuation. The chart below shows month-by-month data for total sponsored posts tracked.
POPFLEX Active's influencer activity by month
Number of sponsored posts
POPFLEX Active's sponsored post volume peaks in January with 664 posts, 84% higher than the monthly average of 360. April recorded the lowest activity at 138 posts, 62% below average.
Social platforms breakdown
In our dataset (which only includes Instagram, YouTube, and TikTok), this is how the volume of POPFLEX Active's sponsored influencer collaborations break down by social platform:
- TikTok: 3.3k posts (75.4%)
- Instagram: 996 posts (23.1%)
- YouTube: 66 posts (1.5%)
POPFLEX Active's influencer activity by platform
Share of sponsored content by social network
TikTok influencer marketing is a clear focus for POPFLEX Active.
Here are 3 examples of POPFLEX Active's recent sponsored collaborations (one each for Instagram, TikTok, YouTube).
blogilates x POPFLEX Active

Influencer bio
Founder/CEO, Head Designer and Inventor. My brands: @popflex_active, and Blogilates exclusively at Target 🎯
Collaboration metrics
Get a free trial to find more data on influencer audiences, performance, and collaborations.
baldiechi x POPFLEX Active
![TikTok post by @baldiechi for POPFLEX Active. Caption reads: [...] had to share! im wearing a 2X 🖤🤍 @POPFLEX....](https://images.od.modash.io/e4f9adcd9e1d76d5bc53707134acf5cded160da4)
Influencer bio
📍OC | LA big girl, bald head, beauty lover 💌 chiara@thedigitaldept.com
Collaboration metrics
Get a free trial to find more data on influencer audiences, performance, and collaborations.
hopescope x POPFLEX Active

Influencer bio
Treasure Hunter, Professional Shopper, SUBSCRIBE! Welcome to my channel! Here we buy celebrity clothing, cheap returns mystery boxes, lost luggage, check out trending tiktok products, ruthlessly review popular brands, and tons of other exciting things! BUSINESS INQUIRIES ONLY: Email tyler@hopescope.com or DM Tyler on LinkedIn https://www.linkedin.com/in/tyler-allen-hopescope/
Collaboration metrics
Get a free trial to find more data on influencer audiences, performance, and collaborations.
If you break this down further by content type on TikTok, this is what it looks like:
- Videos: 91.3%
- Carousels: 8.7%
💡 Related resource: How To Find TikTok Influencers.
Influencer audience size breakdown (by views)
For their top social platform (TikTok), here is a breakdown of the type of influencers POPFLEX Active are collaborating with, by audience size.
Note: this breakdown is based on each influencer's average views (not follower/subscriber count), because views typically correlate more closely with influencer pricing and impact.
POPFLEX Active's influencers average views (TikTok)
Based on each influencer's average views per post
With 41.7% of partnerships featuring creators averaging 1K-5K views, POPFLEX Active's strategy suggests niche targeting and authenticity, likely leveraging collaboration models like gifting and affiliates to work with smaller creators.
Here is an example of a sponsored collaboration with a larger-audience creator on TikTok (202.4k avg views/post):
estefisaavy x POPFLEX Active
![TikTok post by @estefisaavy for POPFLEX Active. Caption reads: [...] jumpsuits I’ve owned 🫶🏼 @POPFLEX Active.](https://images.od.modash.io/375392e3278a1434c0f7152112a46531502b8fc5)
Influencer bio
🙏🏼 Phil 4:13 ✨ Relatable chaos 💪🏼 Glowing up mentally and physically 🇪🇨 Latina | Orlando 💌 estefania@fixated.com
Collaboration metrics
Get a free trial to find more data on influencer audiences, performance, and collaborations.
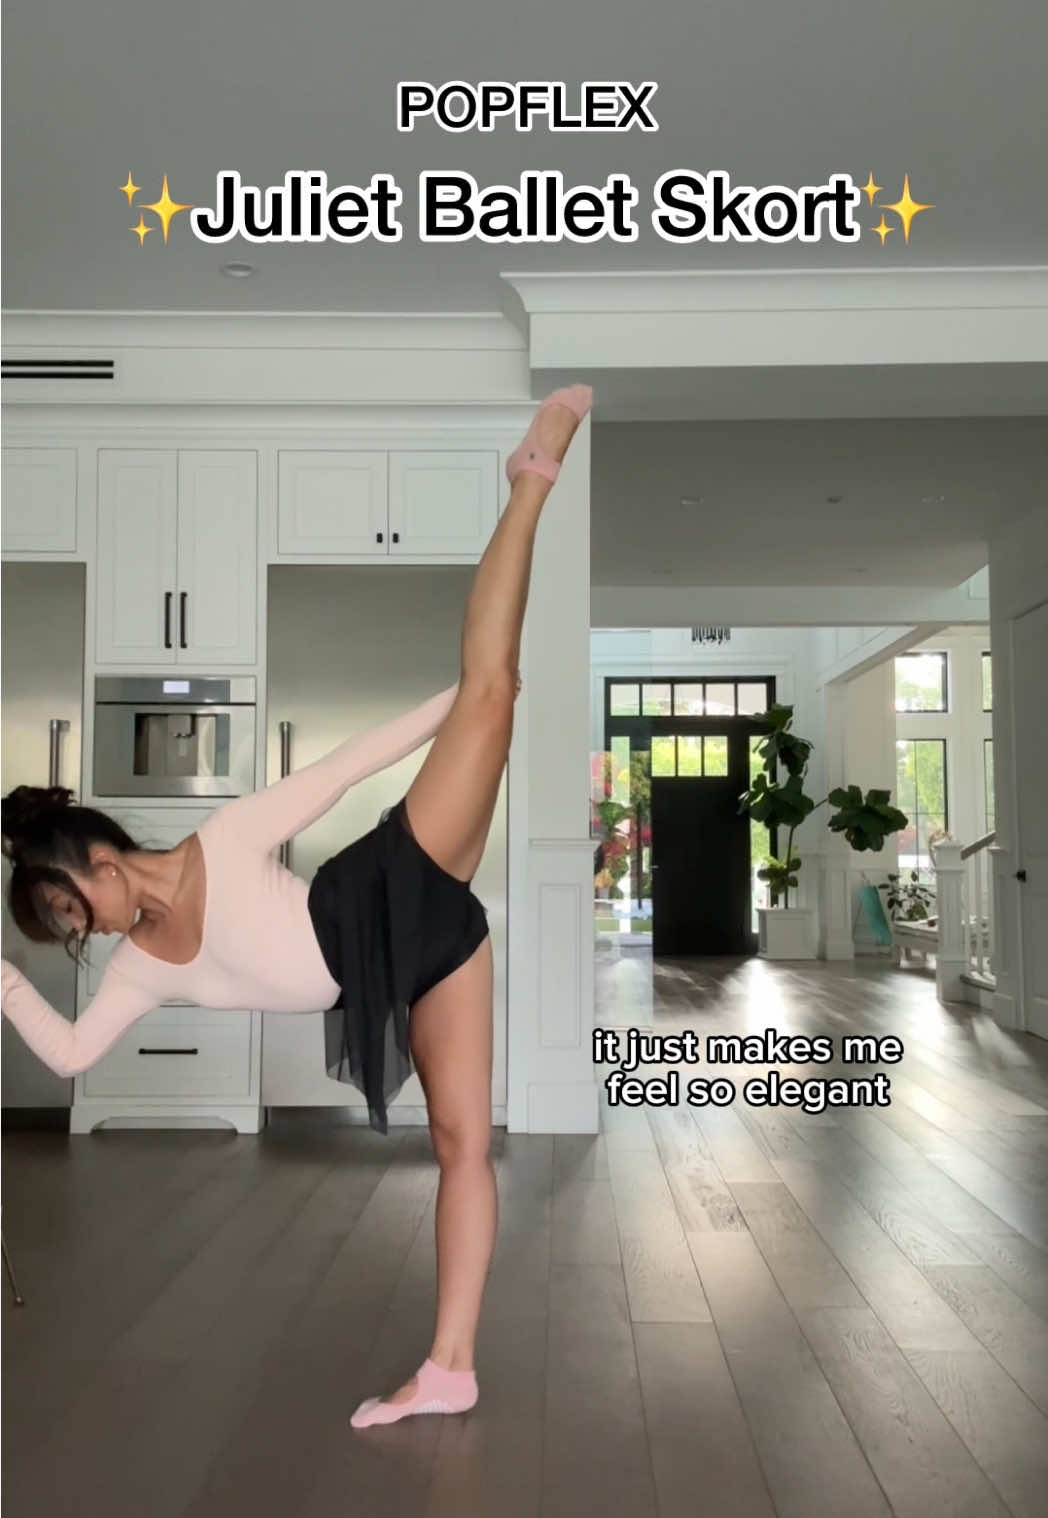
And here is another example with a smaller creator on TikTok (9.9k avg views/post):
lindslindssays x POPFLEX Active
![TikTok post by @lindslindssays for POPFLEX Active. Caption reads: [...] and every inseam for all the gals. @POPFLEX....](https://images.od.modash.io/e65961ae7751a09a6f22f07316a1a320383478a8)
Influencer bio
the BEST finds ✨ ✉️ lindslindssays@gmail.com
Collaboration metrics
Get a free trial to find more data on influencer audiences, performance, and collaborations.
POPFLEX Active's repeat partnerships
Out of 1.4k unique influencers in our dataset, 148 of them (10%) posted content for POPFLEX Active in 3 or more separate calendar months. The most consistent partner is @blogilates, who has collaborated across 12 months with 72 total posts.
Here are 3 examples of POPFLEX Active's repeat influencer partnerships, with links to the sponsored content.
blogilates x POPFLEX Active
![TikTok post by @blogilates for POPFLEX Active. Caption reads: [...] 🎈💦 Hope you love the @POPFLEX Active Zip....](https://images.od.modash.io/86904ffcc08cb44f3993f016f7fc5ba62b8e84fb)
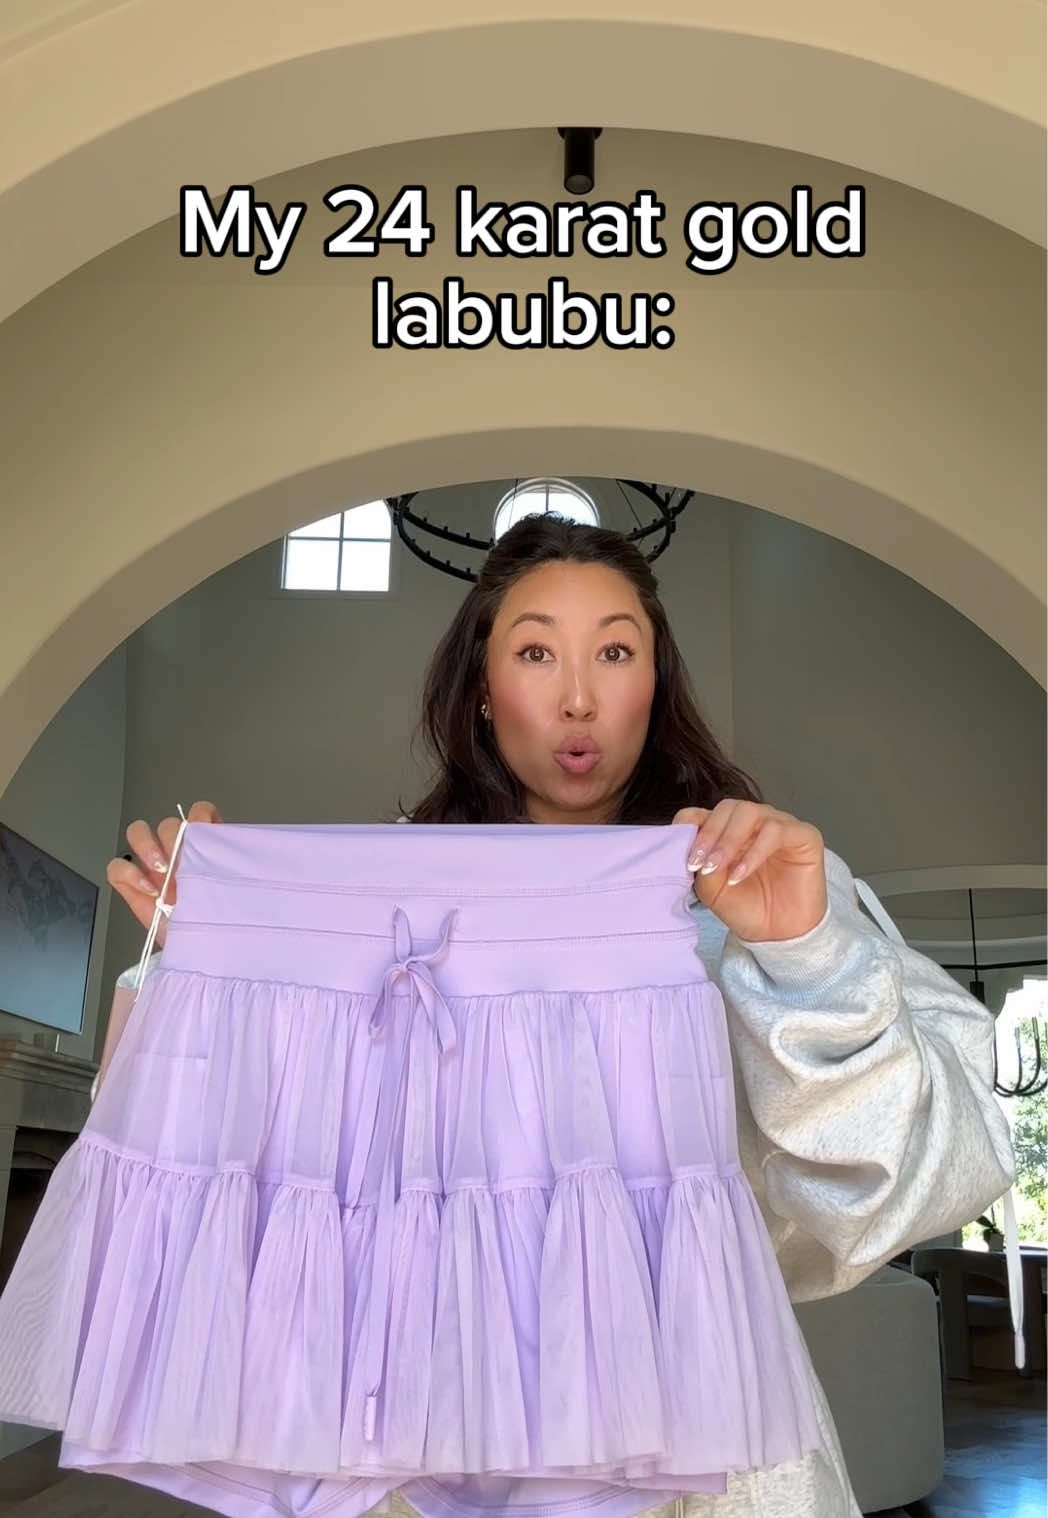
nancysbrands x POPFLEX Active
![TikTok post by @nancysbrands for POPFLEX Active. Caption reads: [...] of the pirouette skort! #popflexactive....](https://images.od.modash.io/46378ed0033bdf8a0103f2a2ca77223d0aae4b63)
![TikTok post by @nancysbrands for POPFLEX Active. Caption reads: [...] #popflexskort @POPFLEX Active.](https://images.od.modash.io/c80de3b5005c61e72d626d101f222927a9a50a1f)
![TikTok post by @nancysbrands for POPFLEX Active. Caption reads: [...] skort is on sale today! @POPFLEX Active.](https://images.od.modash.io/ded5fcf38b0cd401ad119c04fa7568b7b56ee18f)
shekymorena x POPFLEX Active
![TikTok post by @shekymorena for POPFLEX Active. Caption reads: [...] El Zip Cloud Hoodie de @POPFLEX Active....](https://images.od.modash.io/0ab5d91140c1eaad894029a51ffb1ffd2ec2c0d2)
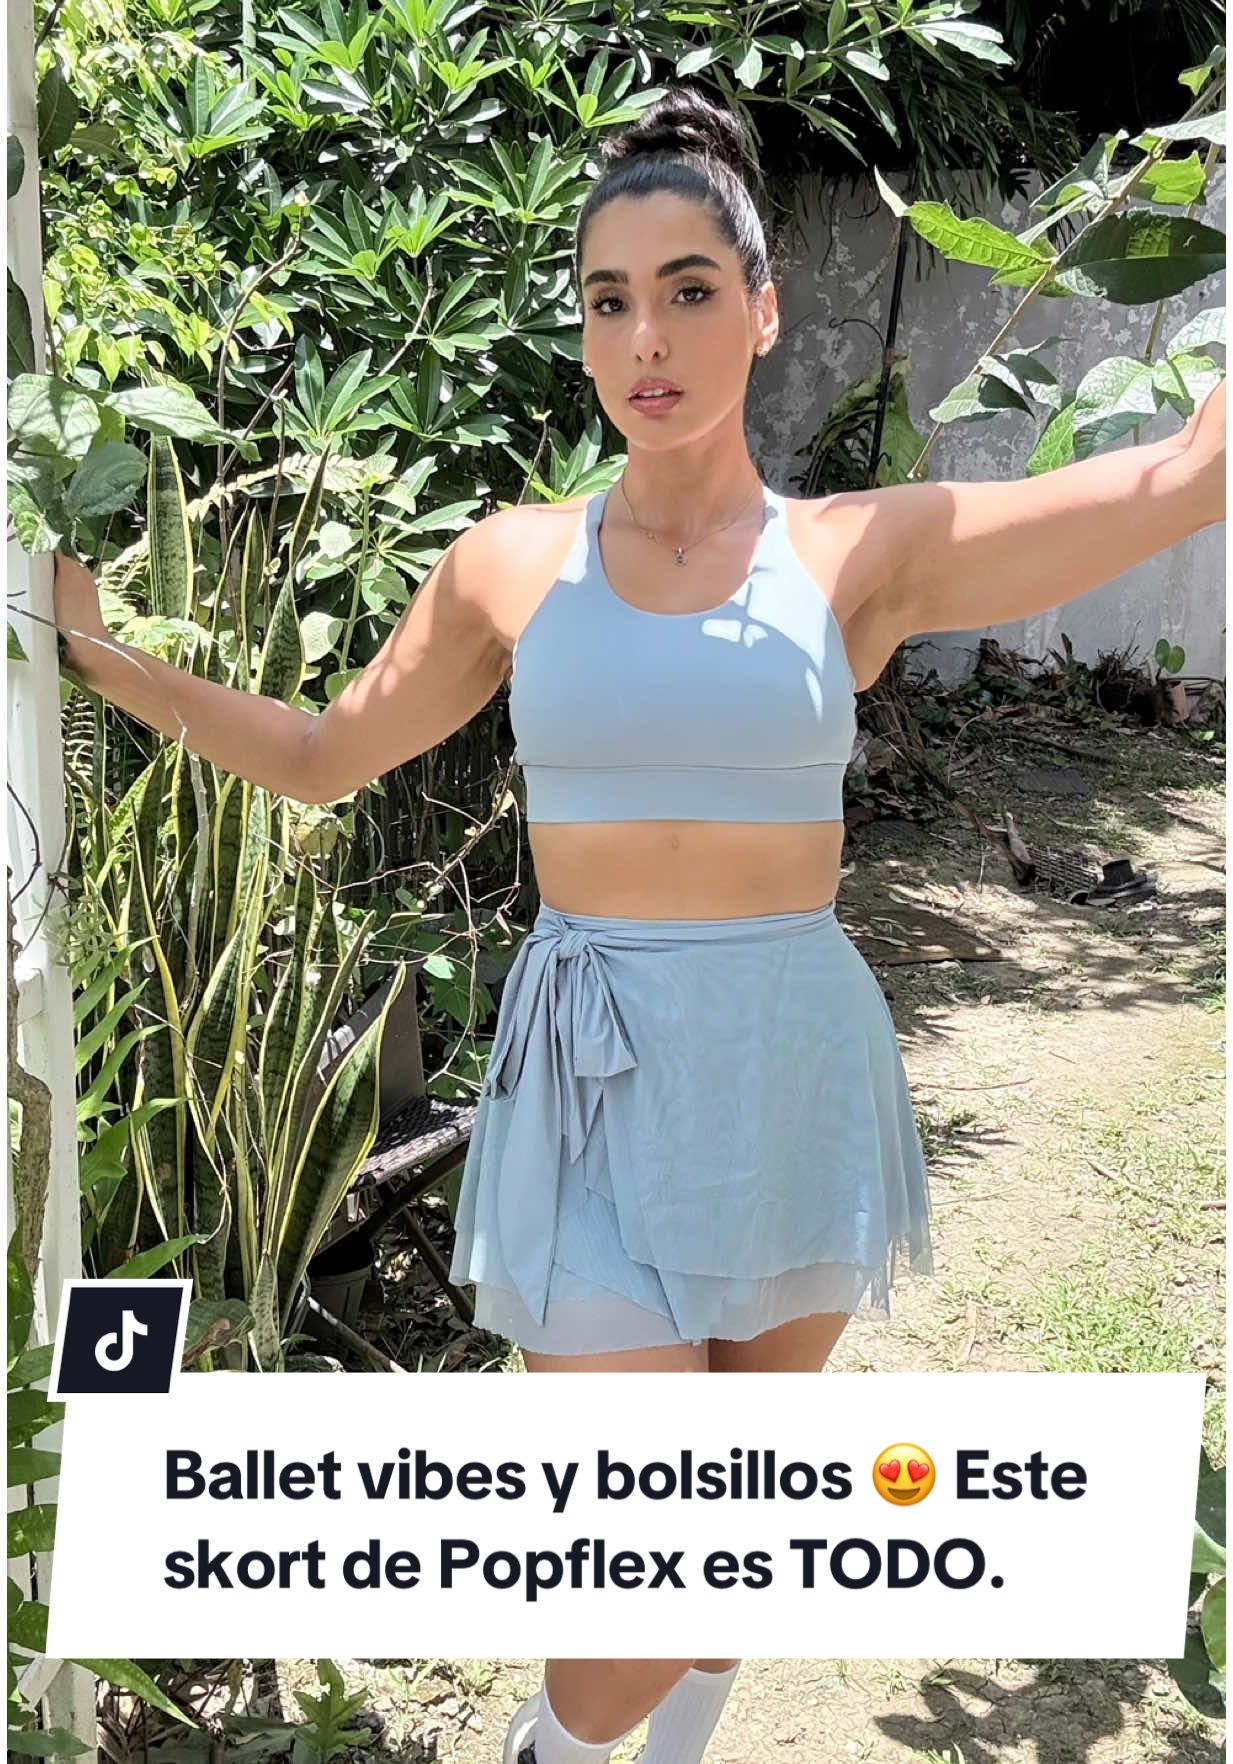
![TikTok post by @shekymorena for POPFLEX Active. Caption reads: [...] Cloud bomber jacket de @POPFLEX Active.](https://images.od.modash.io/8ba4bdc5f3d3e3b706d516b2c24dea64cff618a6)
💡 Related resource: Long-Term Influencer Partnerships: Pros, Cons & How The Pros Manage Them.
Geographical breakdown
In our dataset, United States is where POPFLEX Active had the most influencer activity. 76.1% of their live influencer content in the last 12 months was posted by American influencers.
Based on the percentage of influencer content per market, other important markets include:
- United Kingdom (5%)
- Canada (3.9%)
- Brazil (3.7%)
POPFLEX Active's influencer activity by market
Here is another example of POPFLEX Active collaborating with an influencer in United States.
balletblondie x POPFLEX Active
![TikTok post by @balletblondie for POPFLEX Active. Caption reads: [...] know this is peak szn. Shoutout @POPFLEX....](https://images.od.modash.io/2dfba4e7ebb4807e347437d092e3994a0bcc2833)
POPFLEX Active's influencer activity vs. related brands
POPFLEX Active competes with Gymshark and Beyond Yoga for women-focused activewear where comfort, performance and aesthetics all matter. They’re relevant comparisons for fitness creator partnerships, try-ons, and workout-to-lifestyle positioning.
Total influencer content
POPFLEX Active vs. related brands influencer activity
Total sponsored posts tracked (last 12 months)
Gymshark leads with 37.7k sponsored posts, significantly outpacing POPFLEX Active (4.3k posts) and Beyond Yoga (1.4k posts). Across all three brands, the average volume is 14.5k posts, indicating mature, scaled influencer programs. Gymshark has far more total posts than POPFLEX Active and Beyond Yoga combined.
By social platform
POPFLEX Active vs. related brands influencer activity (by social platform)
Sponsored posts by platform
POPFLEX Active leads on YouTube, while Gymshark has the most activity on Instagram and TikTok. The gap is most notable on TikTok, with Gymshark at 24.8k, POPFLEX Active at 3.3k, Beyond Yoga at 463 posts. POPFLEX Active's activity is particularly concentrated on TikTok. Gymshark has many more Instagram and TikTok posts than POPFLEX Active and Beyond Yoga, while POPFLEX Active has more YouTube posts than both.
By geographical market
POPFLEX Active vs. related brands influencer activity (by country)
Estimated sponsored posts in POPFLEX Active's top markets
Gymshark has the highest estimated sponsored-post volume in United States (20k posts, 54.2%), United Kingdom (5.9k posts, 15.8%), Mexico (1.3k posts, 3.5%), suggesting a North America focus, while POPFLEX Active leads in Canada with 168 posts (3.9%). Looking at United States specifically, the split is Gymshark at 20k posts (54.2%), POPFLEX Active at 3.3k posts (76.1%), Beyond Yoga at 1.1k posts (77.9%).
Read more influencer strategy breakdowns
Looking for more like this? Here are 5 similar influencer marketing strategy breakdowns for other brands:
- Gymshark's Influencer Marketing Strategy
- Beyond Yoga's Influencer Marketing Strategy
- Siete Foods's Influencer Marketing Strategy
- WalkingPad's Influencer Marketing Strategy
- FarmacyBeauty's Influencer Marketing Strategy
Or, if you want to access data like this for your own software or processes, take a look at Modash's API products:
Scaling your influencer program?
When you outgrow your mishmash of spreadsheets & free tools, try Modash. Find & email influencers, track campaigns, ship products & more - all in one place.