OLEHENRIKSEN Influencer Marketing Strategy
(2026 Data & Insights)
We analyzed 16.0k pieces of influencer content sponsored by OLEHENRIKSEN over the last 12 months.
This report breaks down where & how OLEHENRIKSEN invests in influencer marketing, which social platforms they prioritize, top geographical markets, and more.
The data in this report comes from Modash's Brand Collaborations API.
P.S. for a simple list of influencers who have collaborated with OLEHENRIKSEN, see here: OLEHENRIKSEN influencers.
Influencer activity throughout the year
OLEHENRIKSEN's influencer campaigns are active year-round with notable month-to-month fluctuation. The chart below shows month-by-month data for total sponsored posts tracked.
OLEHENRIKSEN's influencer activity by month
Number of sponsored posts
OLEHENRIKSEN's sponsored post volume peaks in January with 2.2k posts, 68% higher than the monthly average of 1.3k. June recorded the lowest activity at 445 posts, 67% below average.
Social platforms breakdown
In our dataset (which only includes Instagram, YouTube, and TikTok), this is how the volume of OLEHENRIKSEN's sponsored influencer collaborations break down by social platform:
- TikTok: 14.2k posts (88.7%)
- Instagram: 1.8k posts (11%)
- YouTube: 49 posts (0.3%)
OLEHENRIKSEN's influencer activity by platform
Share of sponsored content by social network
TikTok influencer marketing is a clear focus for OLEHENRIKSEN.
Here are 3 examples of OLEHENRIKSEN's recent sponsored collaborations (one each for Instagram, TikTok, YouTube).
livefitelle x OLEHENRIKSEN
![Instagram post by @livefitelle for OLEHENRIKSEN. Caption reads: [...] sweet just dropped…🍦 Meet The @olehenriksen....](https://images.od.modash.io/a8a872708ff8d383177dd3149f1682a381a78d81)
Influencer bio
Wellness, beauty, travel + London life 🤍 @ghostlifestyle & @nvgtn code: ELLE Creative Agency @margandmae Law Graduate + Certified Trainer 📃
Collaboration metrics
Get a free trial to find more data on influencer audiences, performance, and collaborations.
beccers_gordonn x OLEHENRIKSEN
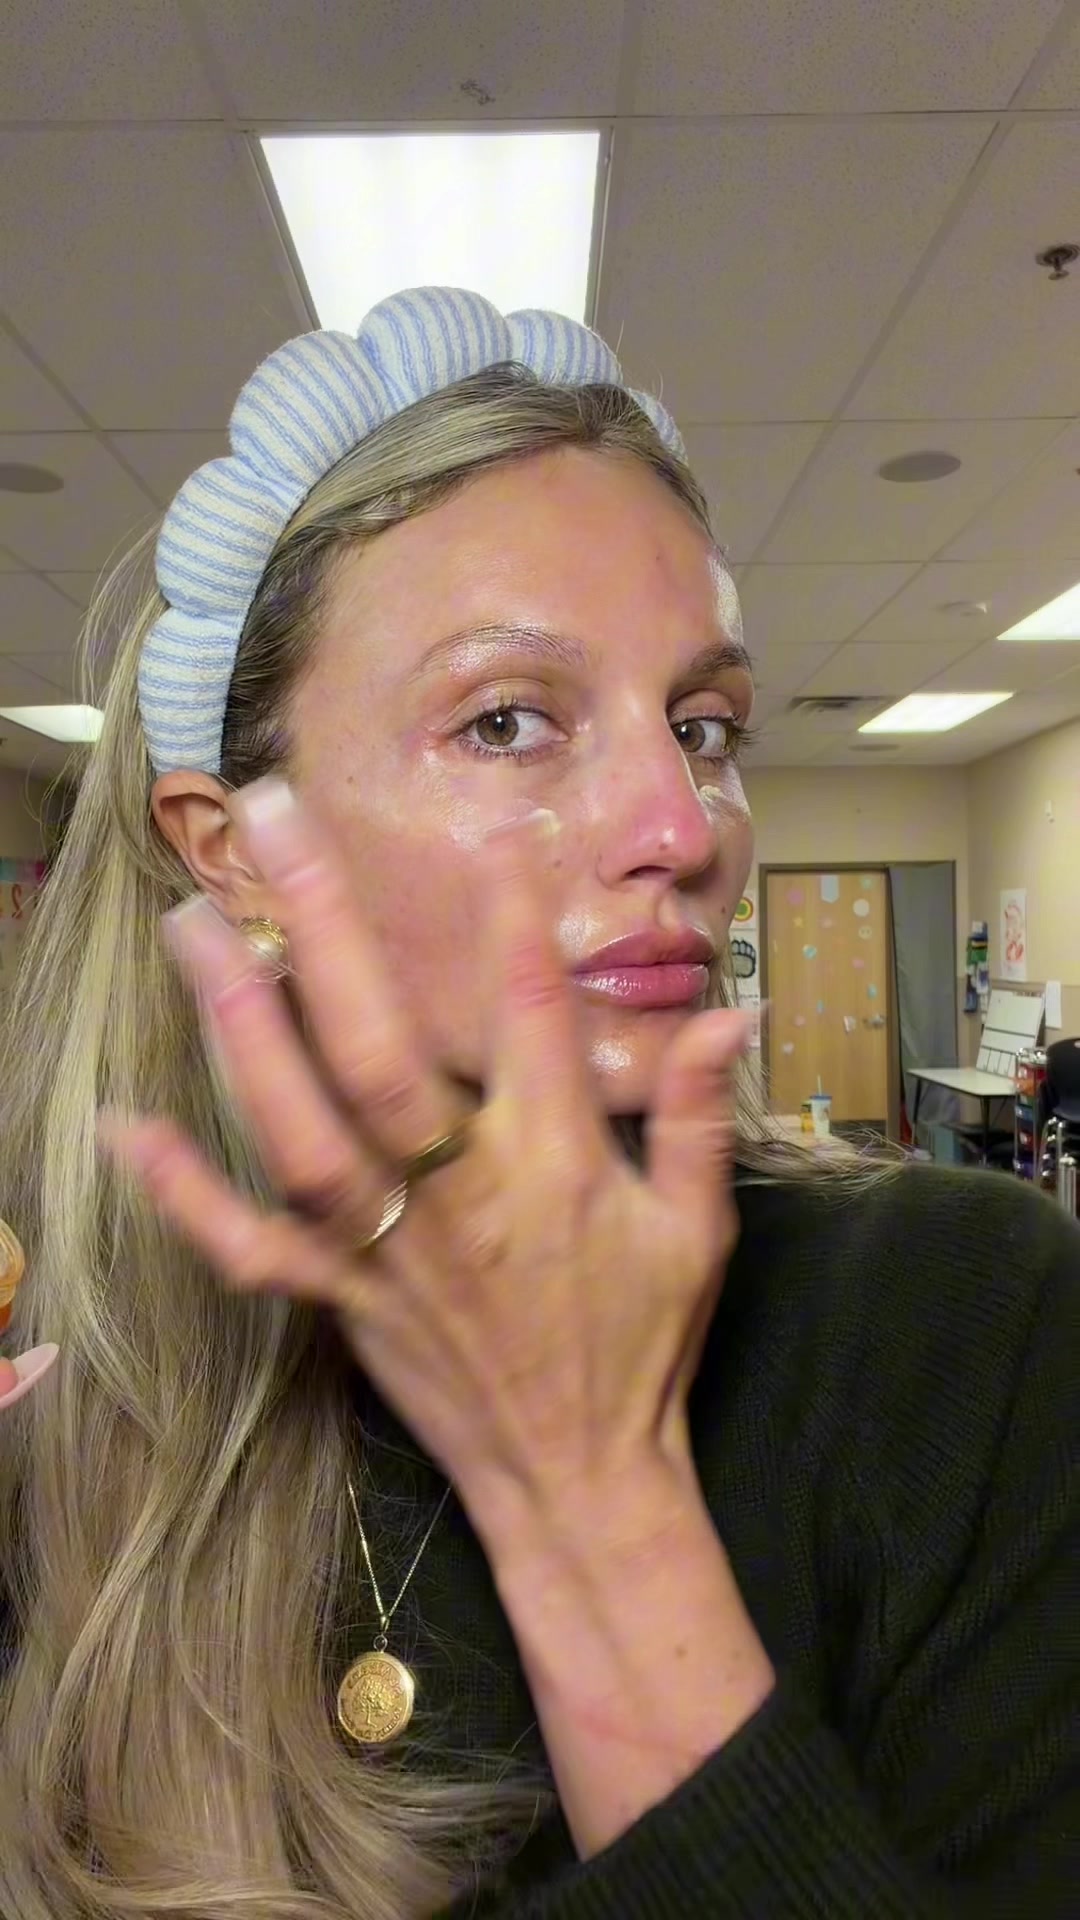
Influencer bio
Utah 📍 4th grade teacher, skincare, makeup 💌teamrebecca@linkcreatormgmt.com
Collaboration metrics
Get a free trial to find more data on influencer audiences, performance, and collaborations.
Sananas x OLEHENRIKSEN
![YouTube post by @Sananas for OLEHENRIKSEN. Caption reads: [...] rewind pro-grade 0.3% retinol serum....](https://images.od.modash.io/feae789a45480702f90cb3680d94937ba7f1b58a)
Influencer bio
Des conseils et astuces Mode, Beauté et Lifestyle ? Welcome dans la Sananas Family ! -Abonnez-vous pour plus de facilité à me suivre c'est gratuit et ça fait plaisir :-) http://www.youtube.com/subscription_center?add_user=sananas2106 -Pour tout contact professionnel UNIQUEMENT : sananas@po.agency -For business inquiries only, please email me : sananas@po.agency Vous pouvez me suivre ici aussi ! ❤Instagram : http://instagram.com/sananas2106 ❤Tiktok : https://www.tiktok.com/@sananas ❤Ma page LTK avec tous mes looks ❤Twitter : https://twitter.com/sananas2106 ❤Ma page facebook : https://www.facebook.com/Sananas2106 ❤Ma boutique Amazon : https://www.amazon.fr/shop/sananas
Collaboration metrics
Get a free trial to find more data on influencer audiences, performance, and collaborations.
If you break this down further by content type on TikTok, this is what it looks like:
- Videos: 95.8%
- Carousels: 4.2%
💡 Related resource: How To Find TikTok Influencers.
Influencer audience size breakdown (by views)
For their top social platform (TikTok), here is a breakdown of the type of influencers OLEHENRIKSEN are collaborating with, by audience size.
Note: this breakdown is based on each influencer's average views (not follower/subscriber count), because views typically correlate more closely with influencer pricing and impact.
OLEHENRIKSEN's influencers average views (TikTok)
Based on each influencer's average views per post
With 56.2% of partnerships featuring creators averaging <1K views, OLEHENRIKSEN's strategy suggests niche targeting and authenticity, likely leveraging collaboration models like gifting and affiliates to work with smaller creators.
Here is an example of a sponsored collaboration with a larger-audience creator on TikTok (903.1k avg views/post):
whor3chata_ x OLEHENRIKSEN
Influencer bio
INSTA: @la.palomasanchez 📧: shelby.marra@thedigitalbrandarchitects.com 🇲🇽
Collaboration metrics
Get a free trial to find more data on influencer audiences, performance, and collaborations.
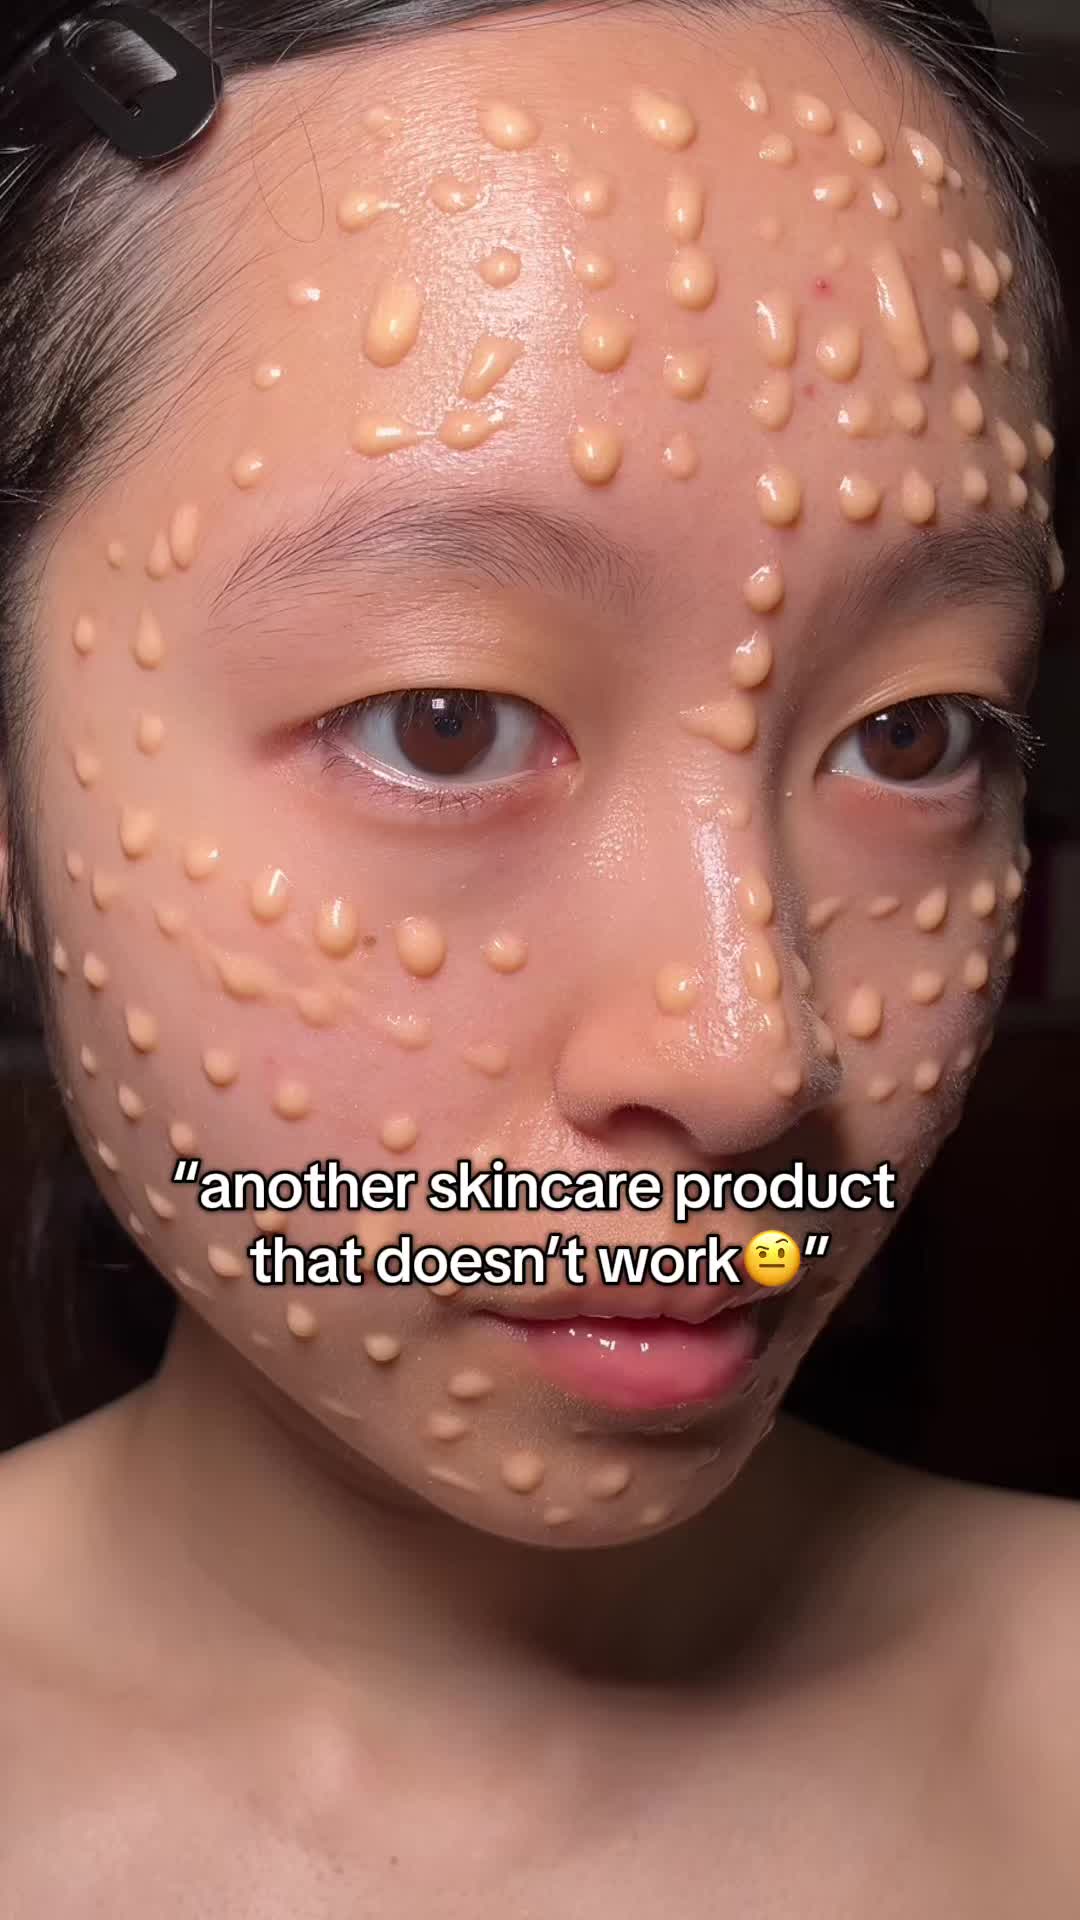
And here is another example with a smaller creator on TikTok (9.8k avg views/post):
mayrajflores x OLEHENRIKSEN
![TikTok post by @mayrajflores for OLEHENRIKSEN. Caption reads: [...] they all smelled amazing too ✨ @Olehenriksen....](https://images.od.modash.io/d8cfad232756958e7474a72249a8ecd501eddd74)
Influencer bio
📍utah from beauty to foodie & everything in between ☁️ ✨ 💌 mayrafloresj@gmail.com
Collaboration metrics
Get a free trial to find more data on influencer audiences, performance, and collaborations.
OLEHENRIKSEN's repeat partnerships
Out of 7.7k unique influencers in our dataset, 646 of them (8%) posted content for OLEHENRIKSEN in 3 or more separate calendar months. The most consistent partner is @daniellamagee, who has collaborated across 13 months with 121 total posts.
Here are 3 examples of OLEHENRIKSEN's repeat influencer partnerships, with links to the sponsored content.
daniellamagee x OLEHENRIKSEN
![TikTok post by @daniellamagee for OLEHENRIKSEN. Caption reads: [...] while it’s in stock!💜💜💜 @Olehenriksen....](https://images.od.modash.io/0e9ca2b71669721bfdadc6831f9f366641d8e5aa)
![TikTok post by @daniellamagee for OLEHENRIKSEN. Caption reads: [...] you like the shade?!🍊👀✨ @Olehenriksen....](https://images.od.modash.io/4863a88d2e87915691b6f579301bb398909444eb)
![TikTok post by @daniellamagee for OLEHENRIKSEN. Caption reads: [...] Grab every single flavor💋 @Olehenriksen....](https://images.od.modash.io/243f1171baaef620e1993ac6e096a354fcff7c92)
isabellalearyy x OLEHENRIKSEN
![TikTok post by @isabellalearyy for OLEHENRIKSEN. Caption reads: [...] @Kiehl's Since 1851 @Olehenriksen @Caudalie....](https://images.od.modash.io/98e9cdacc87aeba7f7bd1cbfcf500f525c093a03)
![TikTok post by @isabellalearyy for OLEHENRIKSEN. Caption reads: [...] App Skincare mid shop....](https://images.od.modash.io/d797c5f965ae9623d011358f8af7beecef0d4126)
![TikTok post by @isabellalearyy for OLEHENRIKSEN. Caption reads: [...] App gifted Skincare @Olehenriksen @Paula’s....](https://images.od.modash.io/e4b7b537f60bcc929c8268bd60a60507c0caf6e3)
a_lifestyle_choice x OLEHENRIKSEN
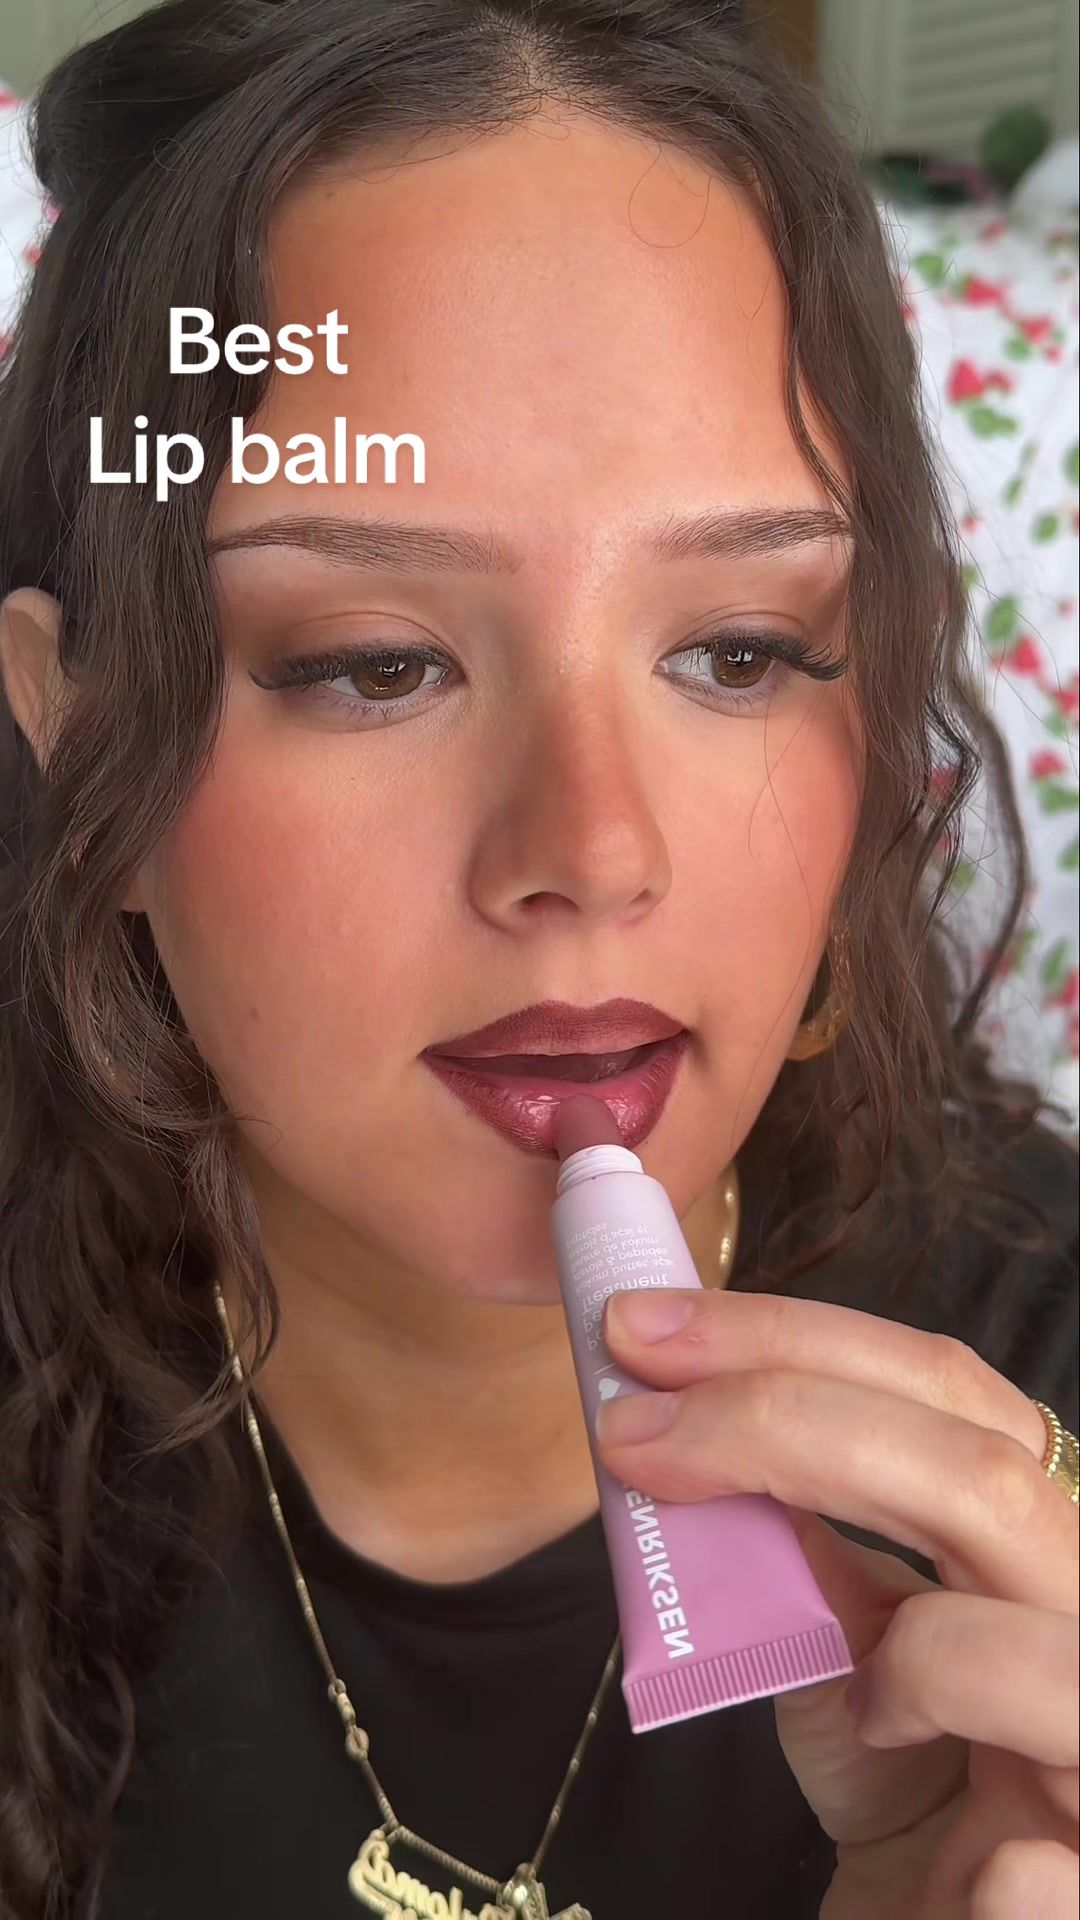
![TikTok post by @a_lifestyle_choice for OLEHENRIKSEN. Caption reads: [...] lip treatment BY @Oleh@Olehenriksen.](https://images.od.modash.io/223a37cc291974ad7d99f51308c557a023e22026)
![TikTok post by @a_lifestyle_choice for OLEHENRIKSEN. Caption reads: [...] lips here 🫦 Amd so does @Olehenriksen....](https://images.od.modash.io/22870523e1204f5d3e9936a7934512353d9dfdcf)
![TikTok post by @a_lifestyle_choice for OLEHENRIKSEN. Caption reads: [...] Coco crème BY @Ole@Olehenriksen.](https://images.od.modash.io/14e936a6d1a5e92dd640998beaec24131559341e)
💡 Related resource: Long-Term Influencer Partnerships: Pros, Cons & How The Pros Manage Them.
Geographical breakdown
In our dataset, United States is where OLEHENRIKSEN had the most influencer activity. 50.2% of their live influencer content in the last 12 months was posted by American influencers.
Based on the percentage of influencer content per market, other important markets include:
- United Kingdom (11%)
- France (6%)
- Australia (4.2%)
OLEHENRIKSEN's influencer activity by market
Here is another example of OLEHENRIKSEN collaborating with an influencer in United States.
milkydew x OLEHENRIKSEN
OLEHENRIKSEN's influencer activity vs. related brands
OLEHENRIKSEN competes with Summer Fridays and Glow Recipe in brightening, glow-focused skincare that performs well in social-first routines and “before/after” storytelling. All three brands are popular in Sephora-adjacent influencer content, making them natural peers for benchmarking.
Total influencer content
OLEHENRIKSEN vs. related brands influencer activity
Total sponsored posts tracked (last 12 months)
Glow Recipe leads with 23.7k sponsored posts, significantly outpacing OLEHENRIKSEN (16k posts) and Summer Fridays (15.4k posts). Across all three brands, the average volume is 18.4k posts, indicating mature, scaled influencer programs.
By social platform
OLEHENRIKSEN vs. related brands influencer activity (by social platform)
Sponsored posts by platform
Among these brands, Summer Fridays leads on Instagram and Glow Recipe leads on TikTok and YouTube. The gap is most notable on TikTok, with Glow Recipe at 20.1k, OLEHENRIKSEN at 14.2k, Summer Fridays at 9.8k posts. OLEHENRIKSEN's activity is particularly concentrated on TikTok. On Instagram, Summer Fridays has multiple times more posts than OLEHENRIKSEN and Glow Recipe.
By geographical market
OLEHENRIKSEN vs. related brands influencer activity (by country)
Estimated sponsored posts in OLEHENRIKSEN's top markets
Glow Recipe has the highest estimated sponsored-post volume in United States (13k posts, 53%), United Kingdom (2k posts, 8.6%), Brazil (1.6k posts, 6.6%), while Summer Fridays leads in France with 988 posts (6.4%). Looking at United States specifically, the split is Glow Recipe at 13k posts (53%), Summer Fridays at 8.5k posts (55.3%), OLEHENRIKSEN at 8k posts (50.2%).
Read more influencer strategy breakdowns
Looking for more like this? Here are 5 similar influencer marketing strategy breakdowns for other brands:
- Summer Fridays's Influencer Marketing Strategy
- Glow Recipe's Influencer Marketing Strategy
- EcoFlow's Influencer Marketing Strategy
- LAWLESS Beauty's Influencer Marketing Strategy
- Kodiak Cakes's Influencer Marketing Strategy
Or, if you want to access data like this for your own software or processes, take a look at Modash's API products:
Frequently asked questions
Scaling your influencer program?
When you outgrow your mishmash of spreadsheets & free tools, try Modash. Find & email influencers, track campaigns, ship products & more - all in one place.