Ninja Kitchen Influencer Marketing Strategy
(2026 Data & Insights)
We analyzed 37.2k pieces of influencer content sponsored by Ninja Kitchen over the last 12 months.
This report breaks down where & how Ninja Kitchen invests in influencer marketing, which social platforms they prioritize, top geographical markets, and more.
The data in this report comes from Modash's Brand Collaborations API.
P.S. for a simple list of influencers who have collaborated with Ninja Kitchen, see here: Ninja Kitchen influencers.
Influencer activity throughout the year
Ninja Kitchen's influencer campaigns are active year-round with notable month-to-month fluctuation. The chart below shows month-by-month data for total sponsored posts tracked.
Ninja Kitchen's influencer activity by month
Number of sponsored posts
Ninja Kitchen's influencer output appears relatively consistent throughout the year, averaging about 3.1k sponsored posts per month. June recorded the highest volume at 3.9k posts (26% above average), while July was the quietest at 2.3k posts.
Social platforms breakdown
In our dataset (which only includes Instagram, YouTube, and TikTok), this is how the volume of Ninja Kitchen's sponsored influencer collaborations break down by social platform:
- TikTok: 26.2k posts (70.4%)
- Instagram: 11.0k posts (29.6%)
Ninja Kitchen's influencer activity by platform
Share of sponsored content by social network
TikTok influencer marketing is a clear focus for Ninja Kitchen.
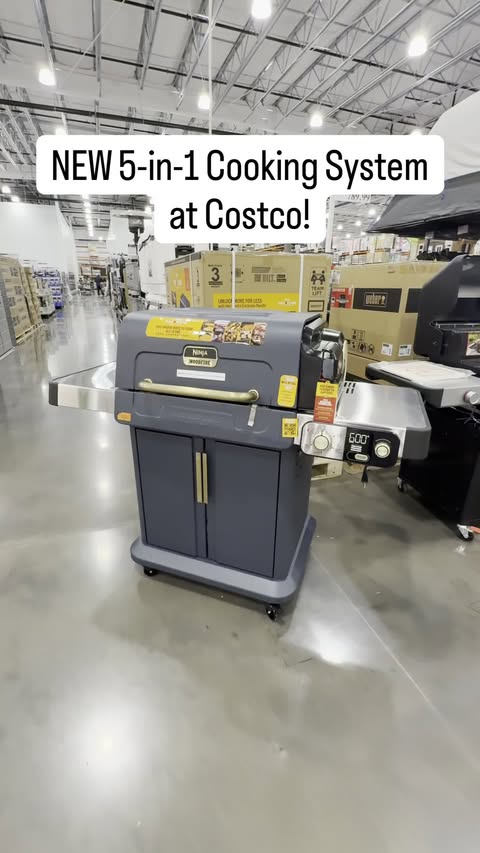
Here are 2 examples of Ninja Kitchen's recent sponsored collaborations (one each for Instagram, TikTok).
costcohotfinds x Ninja Kitchen
Influencer bio
Not Affiliated with Costco! 👱🏼♀️Your Costco support group! Mom👩👦and Costco Addict 💌 costcohotfinds@gmail.com @jayneknox Follow me there too!
Collaboration metrics
Get a free trial to find more data on influencer audiences, performance, and collaborations.
roy_mccarty x Ninja Kitchen
![TikTok post by @roy_mccarty for Ninja Kitchen. Caption reads: [...] #tiktokshopcreatorpicks @Ninja Kitchen.](https://images.od.modash.io/7268c28cd2fe50d2a71957367dffb36f3fc3d1fd)
Influencer bio
Roy McCarty Jr 2026 TikTok Shop Home Creator Of The Year. Backup account @Roy’s Real Reviews 2 other account @Roy’s Real Talk
Collaboration metrics
Get a free trial to find more data on influencer audiences, performance, and collaborations.
If you break this down further by content type on TikTok, this is what it looks like:
- Videos: 96.2%
- Carousels: 3.8%
💡 Related resource: How To Find TikTok Influencers.
Influencer audience size breakdown (by views)
For their top social platform (TikTok), here is a breakdown of the type of influencers Ninja Kitchen are collaborating with, by audience size.
Note: this breakdown is based on each influencer's average views (not follower/subscriber count), because views typically correlate more closely with influencer pricing and impact.
Ninja Kitchen's influencers average views (TikTok)
Based on each influencer's average views per post
Ninja Kitchen's creator selection appears relatively diversified across size tiers, with no single segment dominating. This suggests a balanced approach to influencer partnerships, spreading investment across different audience sizes.
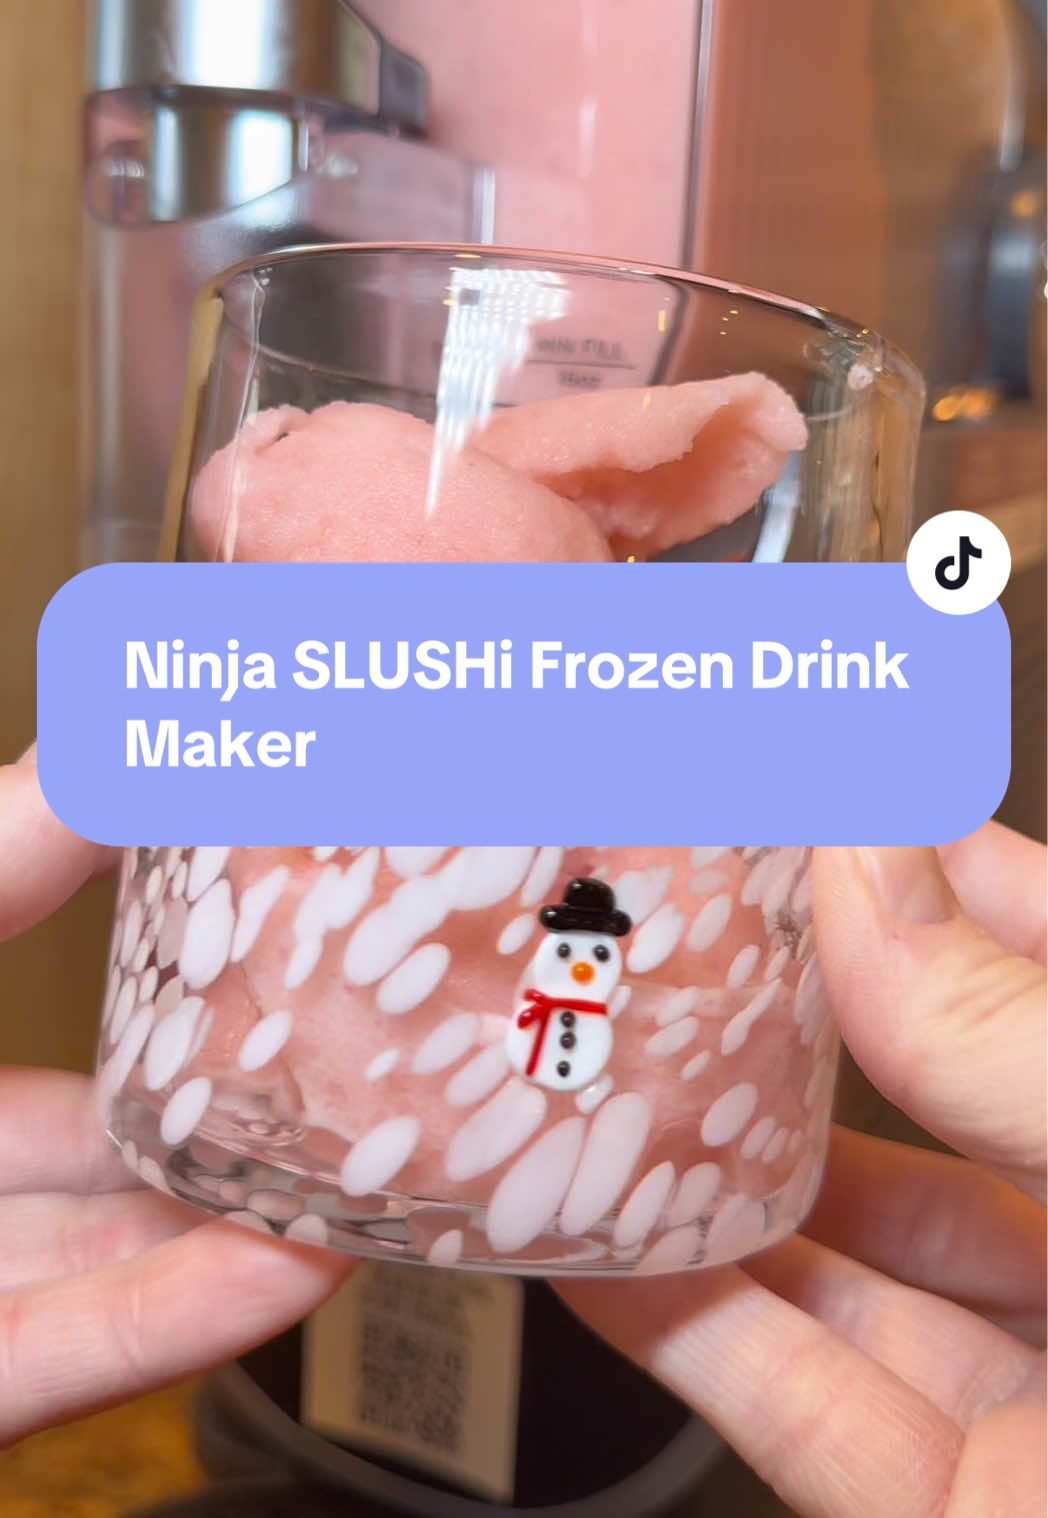
Here is an example of a sponsored collaboration with a larger-audience creator on TikTok (6.3M avg views/post):
corbinmillet x Ninja Kitchen
![TikTok post by @corbinmillet for Ninja Kitchen. Caption reads: [...] I sushi? #ninjapartner #ninjaslushi @Ninja....](https://images.od.modash.io/10da061059dcb1e82660b7acaab3db43a7e0d281)
Influencer bio
corbin@outliertalent.com Erie PA
Collaboration metrics
Get a free trial to find more data on influencer audiences, performance, and collaborations.
And here is another example with a smaller creator on TikTok (10.0k avg views/post):
itsabbyak x Ninja Kitchen
![TikTok post by @itsabbyak for Ninja Kitchen. Caption reads: [...] boiled water are my favorites @Ninja Kitchen....](https://images.od.modash.io/a79c137cd4ee4934fd7d9493fd33b56c3610ac8b)
Influencer bio
Skincare, makeup, self care for the girlies with maturing skin 🌟 no filter zone 🌟 🌟 true reviews only 🌟 📧 workwithabbyak@gmail.com
Collaboration metrics
Get a free trial to find more data on influencer audiences, performance, and collaborations.
Ninja Kitchen's repeat partnerships
Out of 15k unique influencers in our dataset, 1.3k of them (9%) posted content for Ninja Kitchen in 3 or more separate calendar months. The most consistent partner is @sharkninjaph, who has collaborated across 12 months with 313 total posts.
Here are 3 examples of Ninja Kitchen's repeat influencer partnerships, with links to the sponsored content.
sharkninjaph x Ninja Kitchen
![Instagram post by @sharkninjaph for Ninja Kitchen. Caption reads: [...] using the link in our bio! #NinjaKitchenPH....](https://images.od.modash.io/2a08d779f43de1282fb1c219f037d187efdffbf8)
![Instagram post by @sharkninjaph for Ninja Kitchen. Caption reads: [...] using the link in our bio! #NinjaKitchenPH....](https://images.od.modash.io/7a18592ce5661c3442faed227b5f4002b6eac244)
![Instagram post by @sharkninjaph for Ninja Kitchen. Caption reads: [...] the linkt.ree in bio! #NinjaKitchen....](https://images.od.modash.io/23d26113f39313b01cf81bb39b16285672b35e17)
brookeswate22 x Ninja Kitchen
![TikTok post by @brookeswate22 for Ninja Kitchen. Caption reads: @Ninja Kitchen #ninjacreami #ninjaswirl [...].](https://images.od.modash.io/dd05bcc329ba595006992668984481fd03a1de97)
![TikTok post by @brookeswate22 for Ninja Kitchen. Caption reads: @Ninja Kitchen #tiktokshopcybermonday [...].](https://images.od.modash.io/1f0738905604fcade5f0be4ef2ee653360f24d56)
![TikTok post by @brookeswate22 for Ninja Kitchen. Caption reads: @Ninja Kitchen #holidaygiftguide [...].](https://images.od.modash.io/5dccf87960bfe62dd418fcdd8e0c4f0cd4bf6c83)
kimberlymaule x Ninja Kitchen
![TikTok post by @kimberlymaule for Ninja Kitchen. Caption reads: [...] #tiktokshopcreatorpicks @Ninja Kitchen.](https://images.od.modash.io/5dc3fddcc05add60dcf39c3175dd5373611dcad3)
![TikTok post by @kimberlymaule for Ninja Kitchen. Caption reads: [...] #tiktokshopcreatorpicks @Ninja Kitchen.](https://images.od.modash.io/60fe8f86cf929c6dc222489d0045ee46a42ecbfc)
💡 Related resource: Long-Term Influencer Partnerships: Pros, Cons & How The Pros Manage Them.
Geographical breakdown
In our dataset, United States is where Ninja Kitchen had the most influencer activity. 43.3% of their live influencer content in the last 12 months was posted by American influencers.
Based on the percentage of influencer content per market, other important markets include:
- United Kingdom (13%)
- Germany (6.4%)
- France (4.7%)
Ninja Kitchen's influencer activity by market
Here is another example of Ninja Kitchen collaborating with an influencer in United States.
alixearle x Ninja Kitchen
![TikTok post by @alixearle for Ninja Kitchen. Caption reads: [...] this everyday with my BlendBoss 👏🏻 @Ninja....](https://images.od.modash.io/fb5155b272605a95b6fb66ddce9ddd69624a9445)
Ninja Kitchen's influencer activity vs. related brands
Ninja Kitchen overlaps with COSORI and Our Place in home cooking appliances/cookware that win customers via recipe content and product demonstrations. These brands compete for kitchen-focused audiences who discover new tools through TikTok/YouTube creator reviews and “cook with me” formats.
Total influencer content
Ninja Kitchen vs. related brands influencer activity
Total sponsored posts tracked (last 12 months)
Ninja Kitchen leads with 37.2k sponsored posts, significantly outpacing COSORI (7.6k posts) and from Our Place (2.4k posts). Across all three brands, the average volume is 15.7k posts, indicating mature, scaled influencer programs. Ninja Kitchen has multiple times more total posts than COSORI and from Our Place.
By social platform
Ninja Kitchen vs. related brands influencer activity (by social platform)
Sponsored posts by platform
Ninja Kitchen leads on Instagram and TikTok, while from Our Place leads on YouTube. The gap is most notable on TikTok, with Ninja Kitchen at 26.2k, COSORI at 2.5k, from Our Place at 769 posts. Ninja Kitchen's activity is particularly concentrated on TikTok. On TikTok, Ninja Kitchen has multiple times more posts than COSORI and from Our Place.
By geographical market
Ninja Kitchen vs. related brands influencer activity (by country)
Estimated sponsored posts in Ninja Kitchen's top markets
Ninja Kitchen has the highest estimated sponsored-post volume in United States (16k posts, 43.3%), United Kingdom (4.8k posts, 13%), Germany (2.4k posts, 6.4%), suggesting a Europe focus, while COSORI leads in Spain with 786 posts (10.3%), while from Our Place leads in Canada with 141 posts (5.9%). Looking at United States specifically, the split is Ninja Kitchen at 16k posts (43.3%), COSORI at 1.6k posts (20.8%), from Our Place at 1.5k posts (60.9%). Ninja Kitchen's strength in United States, United Kingdom, and Germany may indicate a home-market focus, while COSORI shows broader regional investment.
Read more influencer strategy breakdowns
Looking for more like this? Here are 5 similar influencer marketing strategy breakdowns for other brands:
- COSORI's Influencer Marketing Strategy
- from Our Place's Influencer Marketing Strategy
- Vessi's Influencer Marketing Strategy
- Camille Rose's Influencer Marketing Strategy
- Kulani Kinis's Influencer Marketing Strategy
Or, if you want to access data like this for your own software or processes, take a look at Modash's API products:
Frequently asked questions
Scaling your influencer program?
When you outgrow your mishmash of spreadsheets & free tools, try Modash. Find & email influencers, track campaigns, ship products & more - all in one place.