from Our Place Influencer Marketing Strategy
(2026 Data & Insights)
We analyzed 2.4k pieces of influencer content sponsored by from Our Place over the last 12 months.
This report breaks down where & how from Our Place invests in influencer marketing, which social platforms they prioritize, top geographical markets, and more.
The data in this report comes from Modash's Brand Collaborations API.
P.S. for a simple list of influencers who have collaborated with from Our Place, see here: from Our Place influencers.
Influencer activity throughout the year
from Our Place's influencer campaigns are active year-round with notable month-to-month fluctuation. The chart below shows month-by-month data for total sponsored posts tracked.
from Our Place's influencer activity by month
Number of sponsored posts
from Our Place's influencer output appears relatively consistent throughout the year, averaging about 201 sponsored posts per month. November recorded the highest volume at 276 posts (37% above average), while June was the quietest at 74 posts.
Social platforms breakdown
In our dataset (which only includes Instagram, YouTube, and TikTok), this is how the volume of from Our Place's sponsored influencer collaborations break down by social platform:
- Instagram: 1.4k posts (59.9%)
- TikTok: 745 posts (30.9%)
- YouTube: 220 posts (9.1%)
from Our Place's influencer activity by platform
Share of sponsored content by social network
Instagram influencer marketing is a clear focus for from Our Place.
Here are 3 examples of from Our Place's recent sponsored collaborations (one each for Instagram, TikTok, YouTube).
cozylifebysema x from Our Place
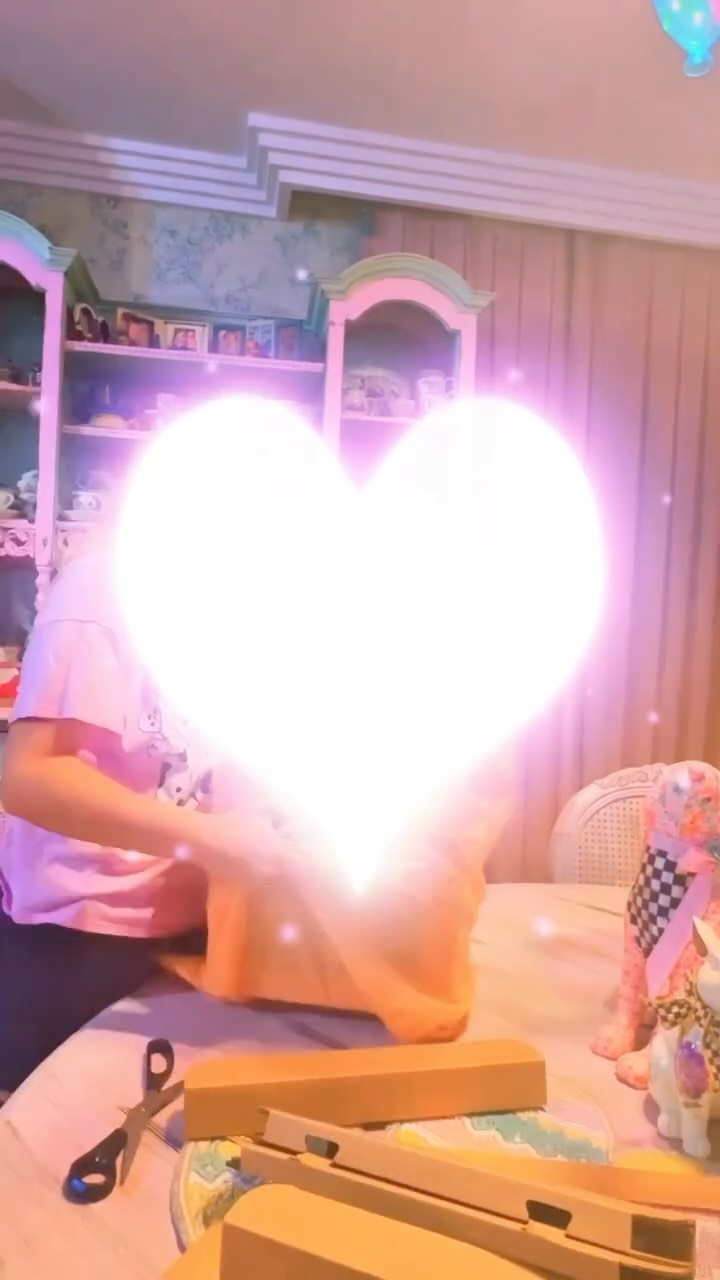
Influencer bio
Sema | Maison Cozy 🧸 Cozy Maximalist Home & Life ✨ Curating warmth in details 🧺 Romanticizing daily life 📩 Mgmt: tugba@dinamikiletisim.com.tr
Collaboration metrics
Get a free trial to find more data on influencer audiences, performance, and collaborations.
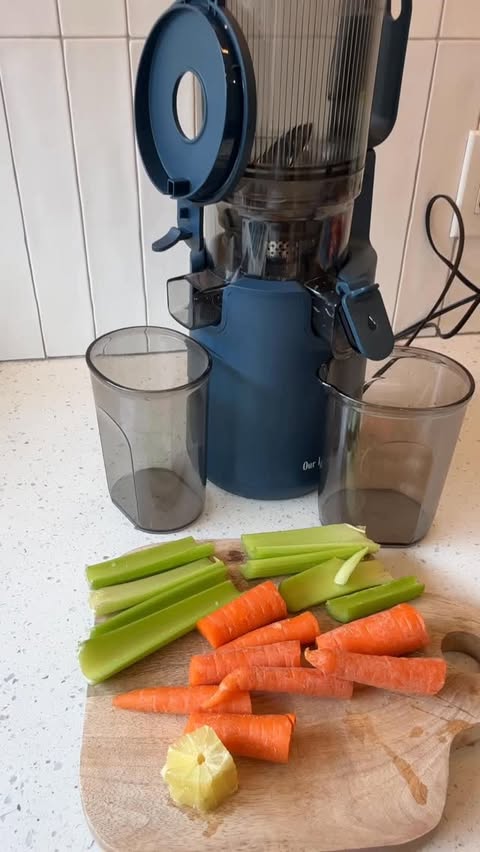
alliwalkerlifestyle x from Our Place
![TikTok post by @alliwalkerlifestyle for from Our Place. Caption reads: [...] that also fit all of my needs! The @From Our....](https://images.od.modash.io/fc2aaefe853404afd00a5950be8bbdaa4480c54e)
Influencer bio
Cleaning & Lifestyle gabie.vigneault@gmail.com 💚🍋🌍 ⬇ Amazon Stores ⬇
Collaboration metrics
Get a free trial to find more data on influencer audiences, performance, and collaborations.
TastingHistory x from Our Place
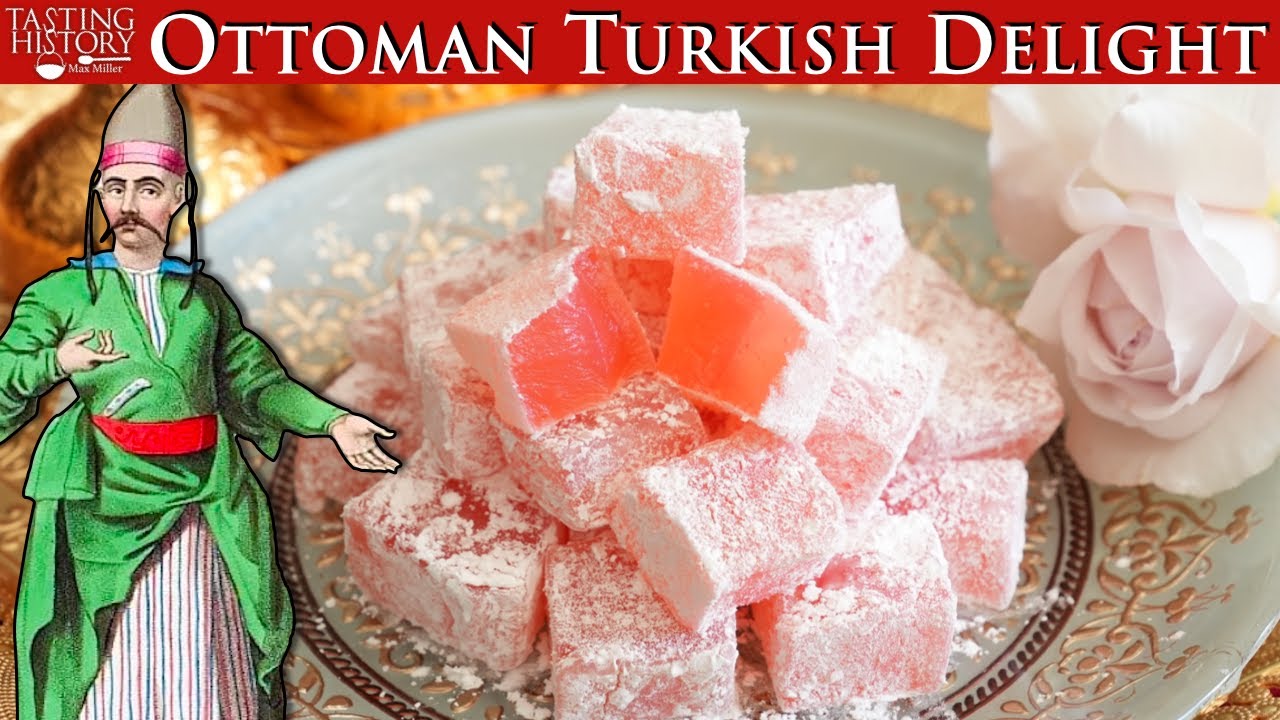
Influencer bio
Click for more Tasting History Every Tuesday, I show you how to make a different historic dish while exploring the history surrounding it. Subscribe and join me as we Taste a bit of History. Order the Tasting History Cookbook at https://bit.ly/3GHL7wC Support the channel at https://www.patreon.com/tastinghistory https://linktr.ee/Tastinghistory Instagram @tastinghistorywithmaxmiller Twitter @Tastinghistory1 Tasting History 22647 Ventura Blvd #323 Woodland Hills, CA 91364
Collaboration metrics
Get a free trial to find more data on influencer audiences, performance, and collaborations.
If you break this down further by content type on Instagram, this is what it looks like:
- Reels: 87.9%
- Posts: 12.1%
💡 Related resource: How To Find Instagram Influencers.
Influencer audience size breakdown (by views)
For their top social platform (Instagram), here is a breakdown of the type of influencers from Our Place are collaborating with, by audience size.
Note: this breakdown is based on each influencer's average views (not follower/subscriber count), because views typically correlate more closely with influencer pricing and impact.
from Our Place's influencers average views (Instagram)
Based on each influencer's average views per post
With 36.7% of partnerships featuring creators averaging 10K-50K views, from Our Place's strategy suggests cost-efficiency and engagement-focused partnerships.
Here is an example of a sponsored collaboration with a larger-audience creator on Instagram (214.3k avg views/post):
costco_doesitagain x from Our Place
Influencer bio
We are passionate about healthy living + feeding our families amazing food! Sharing our best Costco finds! #costcodoesitagain • ascothart@gmail.com
Collaboration metrics
Get a free trial to find more data on influencer audiences, performance, and collaborations.
And here is another example with a smaller creator on Instagram (7.0k avg views/post):
luxuryyforless__ x from Our Place
Influencer bio
🏡 Home Decor Ideas Daily ✨ Affordable Finds & Cozy Looks 📩 to collab : luxuriesforlesss@gmail.com
Collaboration metrics
Get a free trial to find more data on influencer audiences, performance, and collaborations.
from Our Place's repeat partnerships
Out of 1.3k unique influencers in our dataset, 29 of them (2%) posted content for from Our Place in 3 or more separate calendar months. The most consistent partner is @Realfoodology, who has collaborated across 11 months with 18 total posts.
Here are 3 examples of from Our Place's repeat influencer partnerships, with links to the sponsored content.
Realfoodology x from Our Place

hubermanlab x from Our Place
plantbasedbrandon1 x from Our Place
💡 Related resource: Long-Term Influencer Partnerships: Pros, Cons & How The Pros Manage Them.
Geographical breakdown
In our dataset, United States is where from Our Place had the most influencer activity. 62.2% of their live influencer content in the last 12 months was posted by American influencers.
Based on the percentage of influencer content per market, other important markets include:
- United Kingdom (12.4%)
- Canada (6.5%)
- Australia (3.8%)
from Our Place's influencer activity by market
Here is another example of from Our Place collaborating with an influencer in United States.
mythicalkitchen x from Our Place
from Our Place's influencer activity vs. related brands
from Our Place competes in design-forward cookware and home cooking, where product demos and recipe creators drive discovery. Ooni and Ninja Kitchen appeal to the same home-chef audience and are frequent benchmarks for kitchen-focused influencer marketing.
Total influencer content
from Our Place vs. related brands influencer activity
Total sponsored posts tracked (last 12 months)
Ninja Kitchen leads with 37.2k sponsored posts, significantly outpacing from Our Place (2.4k posts) and Ooni (1.8k posts). Across all three brands, the average volume is 13.8k posts, indicating mature, scaled influencer programs. Ninja Kitchen has far more total posts than from Our Place and Ooni.
By social platform
from Our Place vs. related brands influencer activity (by social platform)
Sponsored posts by platform
from Our Place leads on YouTube, while Ninja Kitchen has the most activity on Instagram and TikTok. The gap is most notable on TikTok, with Ninja Kitchen at 26.2k, from Our Place at 745, Ooni at 277 posts. Ooni's activity is particularly concentrated on Instagram. On TikTok, Ninja Kitchen has far more posts than from Our Place and Ooni.
By geographical market
from Our Place vs. related brands influencer activity (by country)
Estimated sponsored posts in from Our Place's top markets
Ninja Kitchen has the highest estimated sponsored-post volume in United States (16k posts, 43.3%), United Kingdom (4.8k posts, 13%), Germany (2.4k posts, 6.4%), suggesting a Europe focus, while from Our Place leads in Canada with 157 posts (6.5%). Looking at United States specifically, the split is Ninja Kitchen at 16k posts (43.3%), from Our Place at 1.5k posts (62.2%), Ooni at 730 posts (41.6%).
Read more influencer strategy breakdowns
Looking for more like this? Here are 5 similar influencer marketing strategy breakdowns for other brands:
- Ooni's Influencer Marketing Strategy
- Ninja Kitchen's Influencer Marketing Strategy
- Juicy Couture's Influencer Marketing Strategy
- Sweet Sweat's Influencer Marketing Strategy
- KARL LAGERFELD's Influencer Marketing Strategy
Or, if you want to access data like this for your own software or processes, take a look at Modash's API products:
Frequently asked questions
Scaling your influencer program?
When you outgrow your mishmash of spreadsheets & free tools, try Modash. Find & email influencers, track campaigns, ship products & more - all in one place.