Kulani Kinis Influencer Marketing Strategy
(2026 Data & Insights)
We analyzed 1.5k pieces of influencer content sponsored by Kulani Kinis over the last 12 months.
This report breaks down where & how Kulani Kinis invests in influencer marketing, which social platforms they prioritize, top geographical markets, and more.
The data in this report comes from Modash's Brand Collaborations API.
P.S. for a simple list of influencers who have collaborated with Kulani Kinis, see here: Kulani Kinis influencers.
Influencer activity throughout the year
Kulani Kinis's influencer campaigns are active year-round with notable month-to-month fluctuation. The chart below shows month-by-month data for total sponsored posts tracked.
Kulani Kinis's influencer activity by month
Number of sponsored posts
Kulani Kinis's influencer activity appears to have tapered over the year, from 111 posts in January down to 82 in December. March was the busiest month at 189 posts, 51% above the monthly average.
Social platforms breakdown
In our dataset (which only includes Instagram, YouTube, and TikTok), this is how the volume of Kulani Kinis's sponsored influencer collaborations break down by social platform:
- Instagram: 1.0k posts (66.5%)
- TikTok: 501 posts (33.2%)
- YouTube: 4 posts (0.3%)
Kulani Kinis's influencer activity by platform
Share of sponsored content by social network
Instagram influencer marketing is a clear focus for Kulani Kinis.
Here are 3 examples of Kulani Kinis's recent sponsored collaborations (one each for Instagram, TikTok, YouTube).
iampresleefaith x Kulani Kinis
Influencer bio
Hi, it’s PresLee Faith👋🏼 Business: preslee@tiddle.io Jesus Loves You! 🤍
Collaboration metrics
Get a free trial to find more data on influencer audiences, performance, and collaborations.
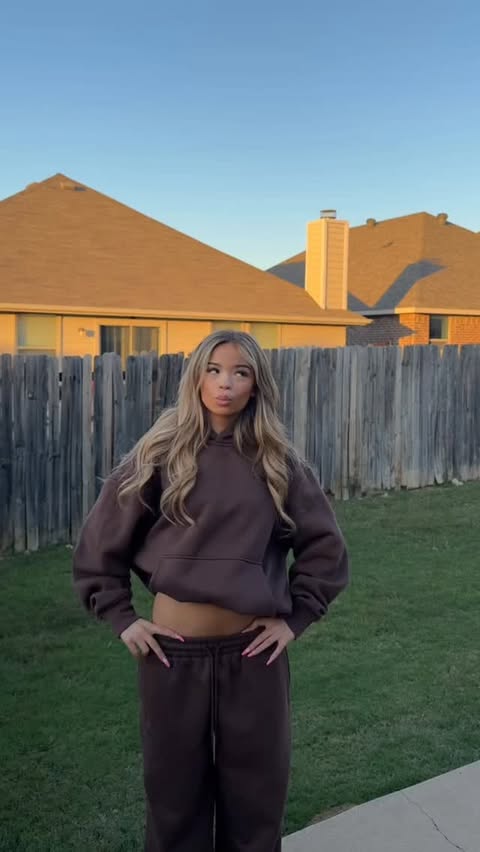
mckinley_paige x Kulani Kinis
![TikTok post by @mckinley_paige for Kulani Kinis. Caption reads: [...] night🌺🫶🏻 #beach #sunset #foryou @Kulani....](https://images.od.modash.io/e7c558da3e000c1ee81864825659d9d3d8d9d82b)
Influencer bio
FL🌴🌅 mckinleydimitras08@gmail.com
Collaboration metrics
Get a free trial to find more data on influencer audiences, performance, and collaborations.
BrittanyLupton x Kulani Kinis
![YouTube post by @BrittanyLupton for Kulani Kinis. Caption reads: [...] Bikini Haul & My Top Summer Picks!! Kulani....](https://images.od.modash.io/6e71a5ae2245195d20b1aafa3619d210c7fef7a3)
Influencer bio
your go-to gym girl. reminding you that you aren’t alone in your fitness journey & that each day is a fresh start. let's lift, find balance and fall in love with the process. i'm so glad you're here Xx
Collaboration metrics
Get a free trial to find more data on influencer audiences, performance, and collaborations.
If you break this down further by content type on Instagram, this is what it looks like:
- Posts: 75.2%
- Reels: 24.8%
💡 Related resource: How To Find Instagram Influencers.
Influencer audience size breakdown (by views)
For their top social platform (Instagram), here is a breakdown of the type of influencers Kulani Kinis are collaborating with, by audience size.
Note: this breakdown is based on each influencer's average views (not follower/subscriber count), because views typically correlate more closely with influencer pricing and impact.
Kulani Kinis's influencers average views (Instagram)
Based on each influencer's average views per post
With 32.4% of partnerships featuring creators averaging 10K-50K views, Kulani Kinis's strategy suggests cost-efficiency and engagement-focused partnerships. The 1K-5K views segment is also prominent at 23.1%, indicating investment across adjacent tiers.
Here is an example of a sponsored collaboration with a larger-audience creator on Instagram (24.6k avg views/post):
katelynsroom x Kulani Kinis
![Instagram post by @katelynsroom for Kulani Kinis. Caption reads: [...] @amika @cocokind @drinkolipop @kulanikinis....](https://images.od.modash.io/8051eb30dffbe71d5fcdd0a19f8a51831b306985)
Influencer bio
Hawaii content creator 🌺🌴 TikTok @katelynsroom1 💌katelyn@select.co
Collaboration metrics
Get a free trial to find more data on influencer audiences, performance, and collaborations.
And here is another example with a smaller creator on Instagram (8.0k avg views/post):
taliyaeilers x Kulani Kinis
Influencer bio
19 | Florida Girl 🌺🥥🏄🏻♀️🌊🌴🌞 💌: taliyaeilers@gmail.com owner of @thesaltwoodtide Shop my handcrafted jewelry ↓ 🐚
Collaboration metrics
Get a free trial to find more data on influencer audiences, performance, and collaborations.
Kulani Kinis's repeat partnerships
Out of 1k unique influencers in our dataset, 12 of them (1%) posted content for Kulani Kinis in 3 or more separate calendar months. The most consistent partner is @katelynsroom, who has collaborated across 6 months with 7 total posts.
Here are 2 examples of Kulani Kinis's repeat influencer partnerships, with links to the sponsored content.
allisonvallerand x Kulani Kinis
![TikTok post by @allisonvallerand for Kulani Kinis. Caption reads: [...] hawaii inspired 🌴🍍🌈 @Kulani Kinis 🌺....](https://images.od.modash.io/c22cf2a5ab2d2bf6cd54f1f9b29762c42899614f)
![TikTok post by @allisonvallerand for Kulani Kinis. Caption reads: [...] for festival season ☕️🏝️@Kulani Kinis 🌺....](https://images.od.modash.io/1bcae9bc7ef6b95598c606c25e807f1edf6a01bf)
![TikTok post by @allisonvallerand for Kulani Kinis. Caption reads: [...] #mensclothing #mensfashion @Kulani Kinis 🌺....](https://images.od.modash.io/f240294dd6153ce3ba1307137ef6fa57c076663c)
josiefitz x Kulani Kinis
![TikTok post by @josiefitz for Kulani Kinis. Caption reads: @Kulani Kinis 🌺 use code SUN10 for 10% [...].](https://images.od.modash.io/b045bd5c8ff0c8d4ff28a8f5fc948b2336cbc57a)
![TikTok post by @josiefitz for Kulani Kinis. Caption reads: [...] for 20% off your order @Kulani Kinis 🌺 link....](https://images.od.modash.io/004dc483e62e9cad224f52c7bdcc0da6f4bd0dbf)
💡 Related resource: Long-Term Influencer Partnerships: Pros, Cons & How The Pros Manage Them.
Geographical breakdown
In our dataset, United States is where Kulani Kinis had the most influencer activity. 62.2% of their live influencer content in the last 12 months was posted by American influencers.
Based on the percentage of influencer content per market, other important markets include:
- Australia (10.4%)
- United Kingdom (8.6%)
- Canada (3.5%)
Kulani Kinis's influencer activity by market
Here is another example of Kulani Kinis collaborating with an influencer in United States.
ashleyyjordann08 x Kulani Kinis
![TikTok post by @ashleyyjordann08 for Kulani Kinis. Caption reads: [...] you use the code SUN10 for 10% off @Kulani....](https://images.od.modash.io/fb2d629ef3a060244c55cd6f3c9afdb1743444b3)
Kulani Kinis's influencer activity vs. related brands
Kulani Kinis competes with Cupshe and Monday Swimwear in swimwear for style-conscious shoppers, spanning bold prints to influencer-friendly resort looks. All three rely on seasonal drops, try-ons, and vacation content to drive demand.
Total influencer content
Kulani Kinis vs. related brands influencer activity
Total sponsored posts tracked (last 12 months)
Cupshe leads with 11.3k sponsored posts, significantly outpacing Monday Swimwear (2.7k posts) and Kulani Kinis (1.5k posts). Across all three brands, the average volume is 5.2k posts, indicating mature, scaled influencer programs. Cupshe has several times more total posts than Kulani Kinis and Monday Swimwear.
By social platform
Kulani Kinis vs. related brands influencer activity (by social platform)
Sponsored posts by platform
Among these brands, Cupshe leads on Instagram, TikTok, and YouTube. The gap is most notable on TikTok, with Cupshe at 6.9k, Monday Swimwear at 562, Kulani Kinis at 501 posts. Monday Swimwear's activity is particularly concentrated on Instagram. On TikTok, Cupshe has several times more posts than Kulani Kinis and Monday Swimwear.
By geographical market
Kulani Kinis vs. related brands influencer activity (by country)
Estimated sponsored posts in Kulani Kinis's top markets
Cupshe has the highest estimated sponsored-post volume in United States (6.2k posts, 54.5%), United Kingdom (1k posts, 8.9%), France (725 posts, 6.4%), suggesting a Europe focus, while Monday Swimwear leads in Australia with 188 posts (7%). Looking at United States specifically, the split is Cupshe at 6.2k posts (54.5%), Monday Swimwear at 1.4k posts (52.2%), Kulani Kinis at 938 posts (62.2%).
Read more influencer strategy breakdowns
Looking for more like this? Here are 5 similar influencer marketing strategy breakdowns for other brands:
- Cupshe's Influencer Marketing Strategy
- Monday Swimwear's Influencer Marketing Strategy
- Adanola's Influencer Marketing Strategy
- The Frankie Shop's Influencer Marketing Strategy
- IGK Hair's Influencer Marketing Strategy
Or, if you want to access data like this for your own software or processes, take a look at Modash's API products:
Frequently asked questions
Scaling your influencer program?
When you outgrow your mishmash of spreadsheets & free tools, try Modash. Find & email influencers, track campaigns, ship products & more - all in one place.