Olfactory NYC Influencer Marketing Strategy
(2026 Data & Insights)
We analyzed 988 pieces of influencer content sponsored by Olfactory NYC over the last 12 months.
This report breaks down where & how Olfactory NYC invests in influencer marketing, which social platforms they prioritize, top geographical markets, and more.
The data in this report comes from Modash's Brand Collaborations API.
P.S. for a simple list of influencers who have collaborated with Olfactory NYC, see here: Olfactory NYC influencers.
Influencer activity throughout the year
Olfactory NYC's influencer campaigns are active year-round with notable month-to-month fluctuation. The chart below shows month-by-month data for total sponsored posts tracked.
Olfactory NYC's influencer activity by month
Number of sponsored posts
Olfactory NYC's influencer output appears relatively consistent throughout the year, averaging about 82 sponsored posts per month. April recorded the highest volume at 111 posts (35% above average), while June was the quietest at 54 posts.
Social platforms breakdown
In our dataset (which only includes Instagram, YouTube, and TikTok), this is how the volume of Olfactory NYC's sponsored influencer collaborations break down by social platform:
- Instagram: 681 posts (68.9%)
- TikTok: 307 posts (31.1%)
Olfactory NYC's influencer activity by platform
Share of sponsored content by social network
Instagram influencer marketing is a clear focus for Olfactory NYC.
Here are 2 examples of Olfactory NYC's recent sponsored collaborations (one each for Instagram, TikTok).
eyerize x Olfactory NYC
![Instagram post by @eyerize for Olfactory NYC. Caption reads: [...] home. Our kind of Valentine’s with....](https://images.od.modash.io/00dc1191cd79c8774c915e5de8610f9ff0726388)
Influencer bio
📍 los angeles 💌 iris@select.co 🪽 servant of God. survivor. philanthropist.
Collaboration metrics
Get a free trial to find more data on influencer audiences, performance, and collaborations.
rllycierra x Olfactory NYC
![TikTok post by @rllycierra for Olfactory NYC. Caption reads: [...] might just become a new hobbie 👀💐✨....](https://images.od.modash.io/61173759f21e52a0ce4350c8766851eaa9b8675c)
Influencer bio
⋆. 𐙚 atlanta | detroit 💌: cierrawalker421@gmail.com
Collaboration metrics
Get a free trial to find more data on influencer audiences, performance, and collaborations.
If you break this down further by content type on Instagram, this is what it looks like:
- Reels: 91.5%
- Posts: 8.5%
💡 Related resource: How To Find Instagram Influencers.
Influencer audience size breakdown (by views)
For their top social platform (Instagram), here is a breakdown of the type of influencers Olfactory NYC are collaborating with, by audience size.
Note: this breakdown is based on each influencer's average views (not follower/subscriber count), because views typically correlate more closely with influencer pricing and impact.
Olfactory NYC's influencers average views (Instagram)
Based on each influencer's average views per post
With 57.3% of partnerships featuring creators averaging 1K-5K views, Olfactory NYC's strategy suggests niche targeting and authenticity, likely leveraging collaboration models like gifting and affiliates to work with smaller creators. Notably, there appears to be minimal activity in the 500K+ segment.
Here is an example of a sponsored collaboration with a larger-audience creator on Instagram (15.3k avg views/post):
beanimartinis x Olfactory NYC
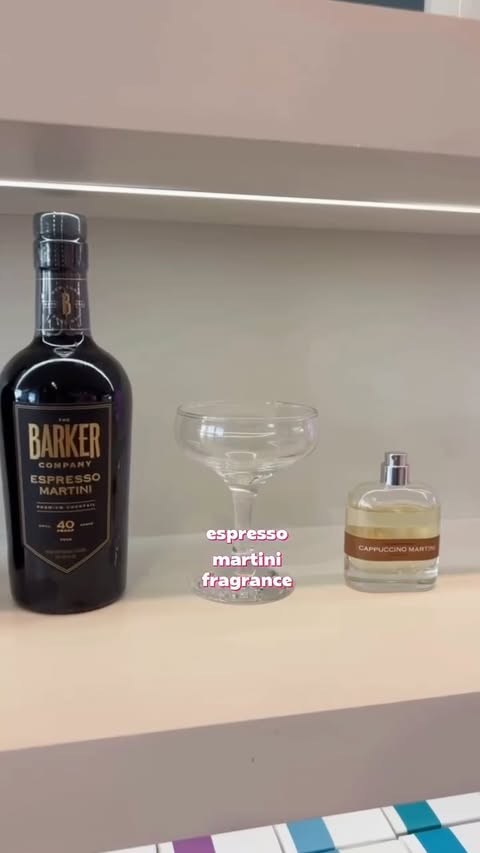
Influencer bio
The leading espresso martini page 🍸☕️ (21+) 💌Inquiries: BeaniMartinis@gmail.com Eat with us 👉 @tinibithungry
Collaboration metrics
Get a free trial to find more data on influencer audiences, performance, and collaborations.
And here is another example with a smaller creator on Instagram (4.0k avg views/post):
heyitshriyaa x Olfactory NYC
![Instagram post by @heyitshriyaa for Olfactory NYC. Caption reads: [...] time creating my own perfume 🫶🏼....](https://images.od.modash.io/dc78796ab7fa76b88d976ca486cab76d0bc06247)
Influencer bio
boston romanticizing the little things ✨ collabs 📧: shriyapandita09@gmail.com @illustrationsbyshriya @cookwithshriya
Collaboration metrics
Get a free trial to find more data on influencer audiences, performance, and collaborations.
Olfactory NYC's repeat partnerships
Out of 908 unique influencers in our dataset, 1 of them (0%) posted content for Olfactory NYC in 3 or more separate calendar months. The most consistent partner is @beanimartinis, who has collaborated across 3 months with 4 total posts.
💡 Related resource: Long-Term Influencer Partnerships: Pros, Cons & How The Pros Manage Them.
Geographical breakdown
In our dataset, United States is where Olfactory NYC had the most influencer activity. 78.8% of their live influencer content in the last 12 months was posted by American influencers.
Based on the percentage of influencer content per market, other important markets include:
- India (3.1%)
- Brazil (2.6%)
- United Kingdom (2.6%)
Olfactory NYC's influencer activity by market
Here is another example of Olfactory NYC collaborating with an influencer in United States.
londonmcbridee x Olfactory NYC
Olfactory NYC's influencer activity vs. related brands
Olfactory NYC competes with Snif and Dossier in DTC fragrance discovery where sampling, reviews, and recommendation content drive conversion. These brands target similar fragrance communities and rely on creator-led scent storytelling and comparison formats.
Total influencer content
Olfactory NYC vs. related brands influencer activity
Total sponsored posts tracked (last 12 months)
Dossier leads with 21.5k sponsored posts, significantly outpacing Snif (5.8k posts) and Olfactory NYC (988 posts). Across all three brands, the average volume is 9.4k posts, indicating mature, scaled influencer programs. Dossier has far more total posts than Olfactory NYC and Snif.
By social platform
Olfactory NYC vs. related brands influencer activity (by social platform)
Sponsored posts by platform
Among these brands, Dossier leads on Instagram, TikTok, and YouTube. The gap is most notable on Instagram, with Dossier at 7.8k, Olfactory NYC at 681, Snif at 0 posts. Snif's activity is particularly concentrated on TikTok. On Instagram, Snif has no posts, while Dossier and Olfactory NYC have hundreds to thousands.
By geographical market
Olfactory NYC vs. related brands influencer activity (by country)
Estimated sponsored posts in Olfactory NYC's top markets
Dossier has the highest estimated sponsored-post volume in United States (8.7k posts, 40.7%), Mexico (2.8k posts, 13.2%), United Kingdom (1.8k posts, 8.5%), suggesting a North America focus, while Snif leads in Canada with 466 posts (8%), while Olfactory NYC has the highest estimated sponsored-post volume in India (31 posts, 3.1%), Brazil (26 posts, 2.6%). Looking at United States specifically, the split is Dossier at 8.7k posts (40.7%), Snif at 4.3k posts (74.1%), Olfactory NYC at 779 posts (78.8%).
Read more influencer strategy breakdowns
Looking for more like this? Here are 5 similar influencer marketing strategy breakdowns for other brands:
- Snif's Influencer Marketing Strategy
- Dossier's Influencer Marketing Strategy
- Sunday Riley's Influencer Marketing Strategy
- Love Wellness's Influencer Marketing Strategy
- Baby Brezza's Influencer Marketing Strategy
Or, if you want to access data like this for your own software or processes, take a look at Modash's API products:
Frequently asked questions
Scaling your influencer program?
When you outgrow your mishmash of spreadsheets & free tools, try Modash. Find & email influencers, track campaigns, ship products & more - all in one place.