Beyond Yoga Influencer Marketing Strategy
(2026 Data & Insights)
We analyzed 1.2k pieces of influencer content sponsored by Beyond Yoga over the last 12 months.
This report breaks down where & how Beyond Yoga invests in influencer marketing, which social platforms they prioritize, top geographical markets, and more.
The data in this report comes from Modash's Brand Collaborations API.
P.S. for a simple list of influencers who have collaborated with Beyond Yoga, see here: Beyond Yoga influencers.
Influencer activity throughout the year
Beyond Yoga's influencer campaigns are active year-round with notable month-to-month fluctuation. The chart below shows month-by-month data for total sponsored posts tracked.
Beyond Yoga's influencer activity by month
Number of sponsored posts
Beyond Yoga's sponsored post volume appears to trend upward over the 12-month period, rising from 103 posts in January to 77 in December. The peak month, August, reached 173 posts, 78% higher than the monthly average of 97.
Social platforms breakdown
In our dataset (which only includes Instagram, YouTube, and TikTok), this is how the volume of Beyond Yoga's sponsored influencer collaborations break down by social platform:
- Instagram: 826 posts (70.4%)
- TikTok: 340 posts (29%)
- YouTube: 7 posts (0.6%)
Beyond Yoga's influencer activity by platform
Share of sponsored content by social network
Instagram influencer marketing is a clear focus for Beyond Yoga.
Here are 3 examples of Beyond Yoga's recent sponsored collaborations (one each for Instagram, TikTok, YouTube).
lanitonnu x Beyond Yoga
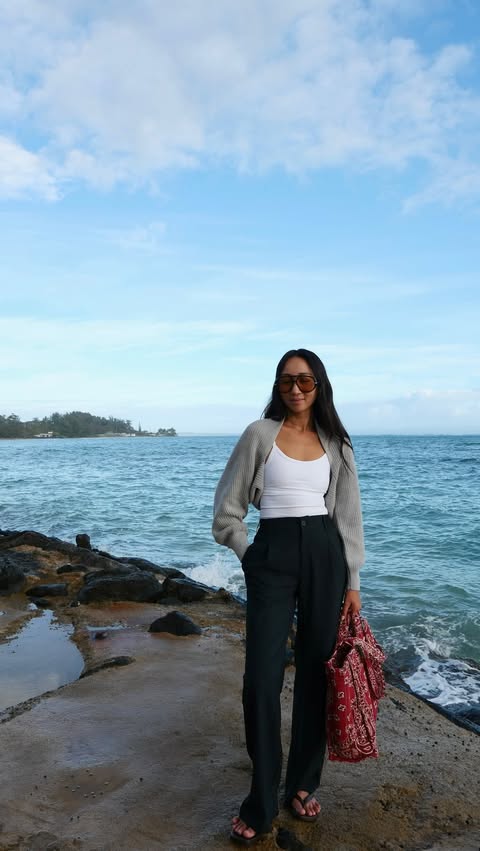
Influencer bio
city roots, southern california living brand marketing @studiomcgee @mcgeeandco sharing my daily outfits + all current obsessions
Collaboration metrics
Get a free trial to find more data on influencer audiences, performance, and collaborations.
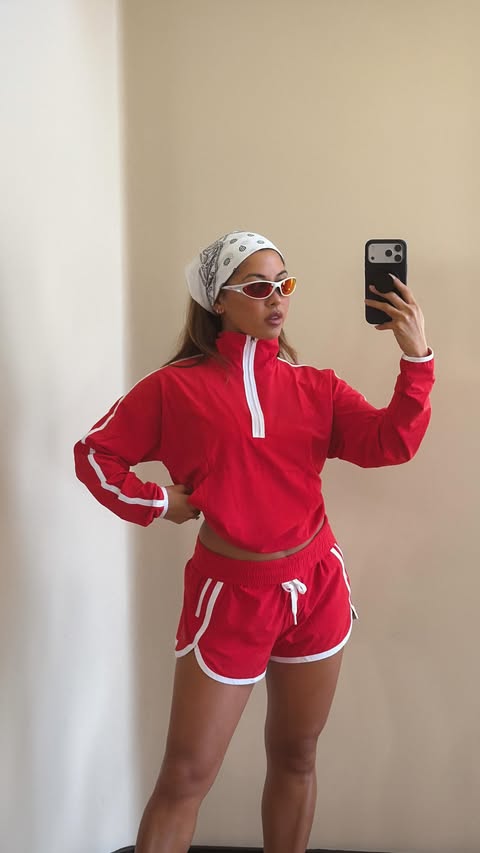
carrie.bankston x Beyond Yoga

Influencer bio
Life + outfits!!! Midwest! shelby.marra@thedigitalbrandarchitects.com
Collaboration metrics
Get a free trial to find more data on influencer audiences, performance, and collaborations.
viallfiles x Beyond Yoga
![YouTube post by @viallfiles for Beyond Yoga. Caption reads: [...] ASPCA - To explore coverage, visit Beyond....](https://images.od.modash.io/d242b21c4311bf4fbc2d81a9f1667efe1bea2e4f)
Influencer bio
Welcome to my podcast The Viall Files! My name is Nick Viall and I host The Viall Files, a podcast that one anonymous reviewer called “surprisingly insightful and substantive.” The Viall Files explores all things dating and love - from post-breakup healing to salacious texts - in our three (and sometimes four) weekly episodes. Celebrity host Nick Viall has found his niche in podcasting. The Viall Files is a weekly multi- episode program that takes a hard look at all types of relationships. On Mondays we connect with our audience as callers “Ask Nick” for advice on all aspects of their lives. On Wednesdays, his one on one interviews with celebrity, pop culture, & expert guests, challenge the way he looks at the world as he dives deep on a variety of topics. Nothing is off limits as Nick gets intimate talking inspiration, friendship, family, dating, & sex with his guests & audience. Email questions to: asknick@theviallfiles.com
Collaboration metrics
Get a free trial to find more data on influencer audiences, performance, and collaborations.
If you break this down further by content type on Instagram, this is what it looks like:
- Reels: 66.2%
- Posts: 33.8%
💡 Related resource: How To Find Instagram Influencers.
Influencer audience size breakdown (by views)
For their top social platform (Instagram), here is a breakdown of the type of influencers Beyond Yoga are collaborating with, by audience size.
Note: this breakdown is based on each influencer's average views (not follower/subscriber count), because views typically correlate more closely with influencer pricing and impact.
Beyond Yoga's influencers average views (Instagram)
Based on each influencer's average views per post
With 32.1% of partnerships featuring creators averaging 10K-50K views, Beyond Yoga's strategy suggests cost-efficiency and engagement-focused partnerships. The 1K-5K views segment is also prominent at 30.7%, indicating investment across adjacent tiers.
Here is an example of a sponsored collaboration with a larger-audience creator on Instagram (220.6k avg views/post):
sparkandpepper x Beyond Yoga
![Instagram post by @sparkandpepper for Beyond Yoga. Caption reads: [...] walks to simple GRWM moments, these....](https://images.od.modash.io/d5f22a50e75337eb1b47cca8104e68af2eae90b7)
Influencer bio
Wear what I want, when I want, and how. BRAND + CREATIVE DIRECTOR Co-Founder @hey.oomi WORK→@meredithpeckdesign
Collaboration metrics
Get a free trial to find more data on influencer audiences, performance, and collaborations.
And here is another example with a smaller creator on Instagram (9.2k avg views/post):
cococuenco x Beyond Yoga
Influencer bio
LA 🇵🇭 creator & co-founder @nowemedia_ family · beauty · figuring it out Mgmt: coco@select.co production: justine@nowemedia.co
Collaboration metrics
Get a free trial to find more data on influencer audiences, performance, and collaborations.
Beyond Yoga's repeat partnerships
Out of 678 unique influencers in our dataset, 39 of them (6%) posted content for Beyond Yoga in 3 or more separate calendar months. The most consistent partner is @lanitonnu, who has collaborated across 10 months with 12 total posts.
Here are 3 examples of Beyond Yoga's repeat influencer partnerships, with links to the sponsored content.
lanitonnu x Beyond Yoga
![Instagram post by @lanitonnu for Beyond Yoga. Caption reads: [...] layer for every day! @beyondyoga’s new En....](https://images.od.modash.io/7f265e8d9a32795b9f1bf232aff916ef17a71012)
pilateswithadrien x Beyond Yoga
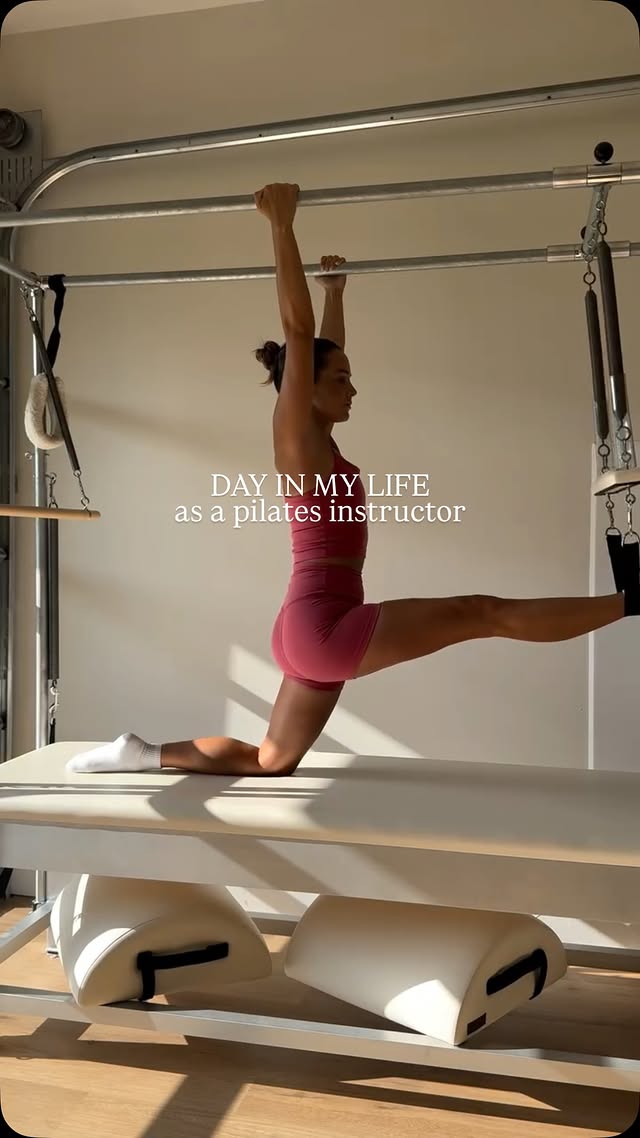
![Instagram post by @pilateswithadrien for Beyond Yoga. Caption reads: [...] coffee ☕️ 2. choosing my @beyondyoga fit 🤭....](https://images.od.modash.io/1a397c3315269a96afb00e5c9753c90cf47a8e2f)
flowgogirl x Beyond Yoga
![Instagram post by @flowgogirl for Beyond Yoga. Caption reads: [...] and enjoy the f l o w 🙂↕️ @beyondyoga....](https://images.od.modash.io/a1458e3a6ad1db2f1ad4354d6c071700c1a1e3b3)
![Instagram post by @flowgogirl for Beyond Yoga. Caption reads: [...] always soft & smooth in @beyondyoga....](https://images.od.modash.io/80e15f34398d77867626d4487d8f0eb902634e1d)
💡 Related resource: Long-Term Influencer Partnerships: Pros, Cons & How The Pros Manage Them.
Geographical breakdown
In our dataset, United States is where Beyond Yoga had the most influencer activity. 78.4% of their live influencer content in the last 12 months was posted by American influencers.
Based on the percentage of influencer content per market, other important markets include:
- United Kingdom (4.1%)
- Canada (3.7%)
- Brazil (3.5%)
Beyond Yoga's influencer activity by market
Here is another example of Beyond Yoga collaborating with an influencer in United States.
danielleburnett__ x Beyond Yoga
![Instagram post by @danielleburnett__ for Beyond Yoga. Caption reads: [...] shorts are curvy runner friendly ✔️....](https://images.od.modash.io/ab040ceb8c2429f1ccd2a7f70a34508e96a7a1cb)
Beyond Yoga's influencer activity vs. related brands
Beyond Yoga competes directly with Alo Yoga and lululemon in premium yoga/athleisure driven by fit, softness, and lifestyle branding. Their influencer ecosystems overlap across yoga instructors, wellness creators, and outfit styling content.
Total influencer content
Beyond Yoga vs. related brands influencer activity
Total sponsored posts tracked (last 12 months)
Alo Yoga leads with 29.8k sponsored posts, marginally ahead of lululemon (29.4k posts) and Beyond Yoga (1.2k posts). Across all three brands, the average volume is 20.1k posts, indicating mature, scaled influencer programs. Alo Yoga and lululemon each have many more total posts than Beyond Yoga.
By social platform
Beyond Yoga vs. related brands influencer activity (by social platform)
Sponsored posts by platform
Among these brands, Alo Yoga leads on Instagram and YouTube and lululemon leads on TikTok. The gap is most notable on Instagram, with Alo Yoga at 25.3k, lululemon at 16.8k, Beyond Yoga at 826 posts. Beyond Yoga's activity is particularly concentrated on Instagram. On Instagram and TikTok, Alo Yoga and lululemon have many more posts than Beyond Yoga.
By geographical market
Beyond Yoga vs. related brands influencer activity (by country)
Estimated sponsored posts in Beyond Yoga's top markets
lululemon has the highest estimated sponsored-post volume in United States (15k posts, 51.8%), United Kingdom (2.6k posts, 8.9%), Japan (1.6k posts, 5.5%), while Alo Yoga has the highest estimated sponsored-post volume in Brazil (2.5k posts, 8.4%), India (1.4k posts, 4.7%), while Beyond Yoga leads in Canada with 43 posts (3.7%). Looking at United States specifically, the split is lululemon at 15k posts (51.8%), Alo Yoga at 12k posts (38.7%), Beyond Yoga at 920 posts (78.4%).
Read more influencer strategy breakdowns
Looking for more like this? Here are 5 similar influencer marketing strategy breakdowns for other brands:
- Alo Yoga's Influencer Marketing Strategy
- lululemon's Influencer Marketing Strategy
- The Lip Bar's Influencer Marketing Strategy
- ELIE SAAB's Influencer Marketing Strategy
- Collection Cosmetics's Influencer Marketing Strategy
Or, if you want to access data like this for your own software or processes, take a look at Modash's API products:
Frequently asked questions
Scaling your influencer program?
When you outgrow your mishmash of spreadsheets & free tools, try Modash. Find & email influencers, track campaigns, ship products & more - all in one place.