OLIPOP Influencer Marketing Strategy
(2026 Data & Insights)
We analyzed 5.9k pieces of influencer content sponsored by OLIPOP over the last 12 months.
This report breaks down where & how OLIPOP invests in influencer marketing, which social platforms they prioritize, top geographical markets, and more.
The data in this report comes from Modash's Brand Collaborations API.
P.S. for a simple list of influencers who have collaborated with OLIPOP, see here: OLIPOP influencers.
Influencer activity throughout the year
OLIPOP's influencer campaigns are active year-round with notable month-to-month fluctuation. The chart below shows month-by-month data for total sponsored posts tracked.
OLIPOP's influencer activity by month
Number of sponsored posts
OLIPOP's influencer output appears relatively consistent throughout the year, averaging about 491 sponsored posts per month. February recorded the highest volume at 646 posts (32% above average), while June was the quietest at 309 posts.
Social platforms breakdown
In our dataset (which only includes Instagram, YouTube, and TikTok), this is how the volume of OLIPOP's sponsored influencer collaborations break down by social platform:
- Instagram: 2.8k posts (46.8%)
- TikTok: 2.7k posts (45.4%)
- YouTube: 462 posts (7.8%)
OLIPOP's influencer activity by platform
Share of sponsored content by social network
Instagram influencer marketing is a clear focus for OLIPOP.
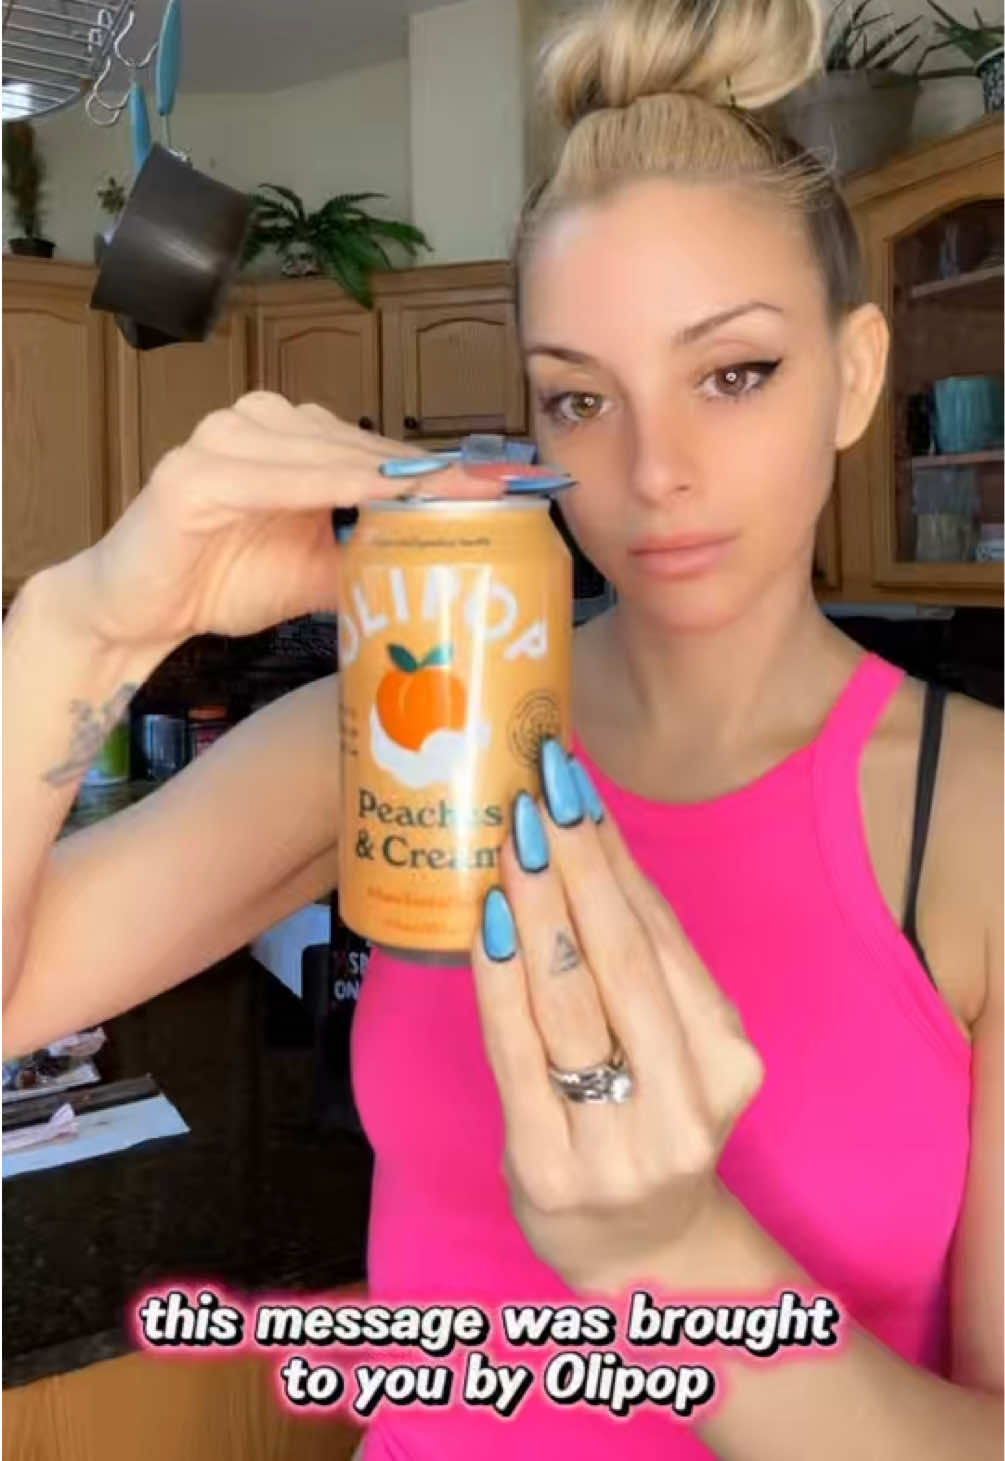
Here are 3 examples of OLIPOP's recent sponsored collaborations (one each for Instagram, TikTok, YouTube).
kie.eats x OLIPOP
![Instagram post by @kie.eats for OLIPOP. Caption reads: [...] Also trying the Strawberry Vanilla....](https://images.od.modash.io/035df2b7ef42a4658ea1291e7b20db4b12a69b21)
Influencer bio
Foodie Page 🍦🌮🍕🍔🍜 For Collabs please email 📧 official.kieanna@gmail.com
Collaboration metrics
Get a free trial to find more data on influencer audiences, performance, and collaborations.
k0uvr x OLIPOP
Influencer bio
Married to the best musician...
Collaboration metrics
Get a free trial to find more data on influencer audiences, performance, and collaborations.
Sambucha x OLIPOP

Influencer bio
I enjoy making content :) Inquiries: sambuchalul@gmail.com
Collaboration metrics
Get a free trial to find more data on influencer audiences, performance, and collaborations.
If you break this down further by content type on Instagram, this is what it looks like:
- Reels: 80.6%
- Posts: 19.4%
💡 Related resource: How To Find Instagram Influencers.
Influencer audience size breakdown (by views)
For their top social platform (Instagram), here is a breakdown of the type of influencers OLIPOP are collaborating with, by audience size.
Note: this breakdown is based on each influencer's average views (not follower/subscriber count), because views typically correlate more closely with influencer pricing and impact.
OLIPOP's influencers average views (Instagram)
Based on each influencer's average views per post
OLIPOP's creator selection appears relatively diversified across size tiers, with no single segment dominating. This suggests a balanced approach to influencer partnerships, spreading investment across different audience sizes.
Here is an example of a sponsored collaboration with a larger-audience creator on Instagram (2.3M avg views/post):
vancityjax x OLIPOP
![Instagram post by @vancityjax for OLIPOP. Caption reads: [...] yes, it’s giving 90s nostalgia. @drinkolipop....](https://images.od.modash.io/a92d35248df592e8e0820e92725eec453b4e8e90)
Influencer bio
Dr. Odyssey premiering Sept. 26th. 9pm EST on ABC #drodyssey
Collaboration metrics
Get a free trial to find more data on influencer audiences, performance, and collaborations.
And here is another example with a smaller creator on Instagram (7.7k avg views/post):
farmacyrevolution_ x OLIPOP
![Instagram post by @farmacyrevolution_ for OLIPOP. Caption reads: [...] Cream Dirty Soda Ingredients • 1 can OLIPOP....](https://images.od.modash.io/fee9679a43b0cfcccc1193e3b4e2181301fb7b9e)
Influencer bio
🌾 Farm life + food creator ✨ Brand localization specialist → Making products feel natural 📩 Collabs: Farmacy_Revolution@comcast.net Bleiblerville, TX
Collaboration metrics
Get a free trial to find more data on influencer audiences, performance, and collaborations.
OLIPOP's repeat partnerships
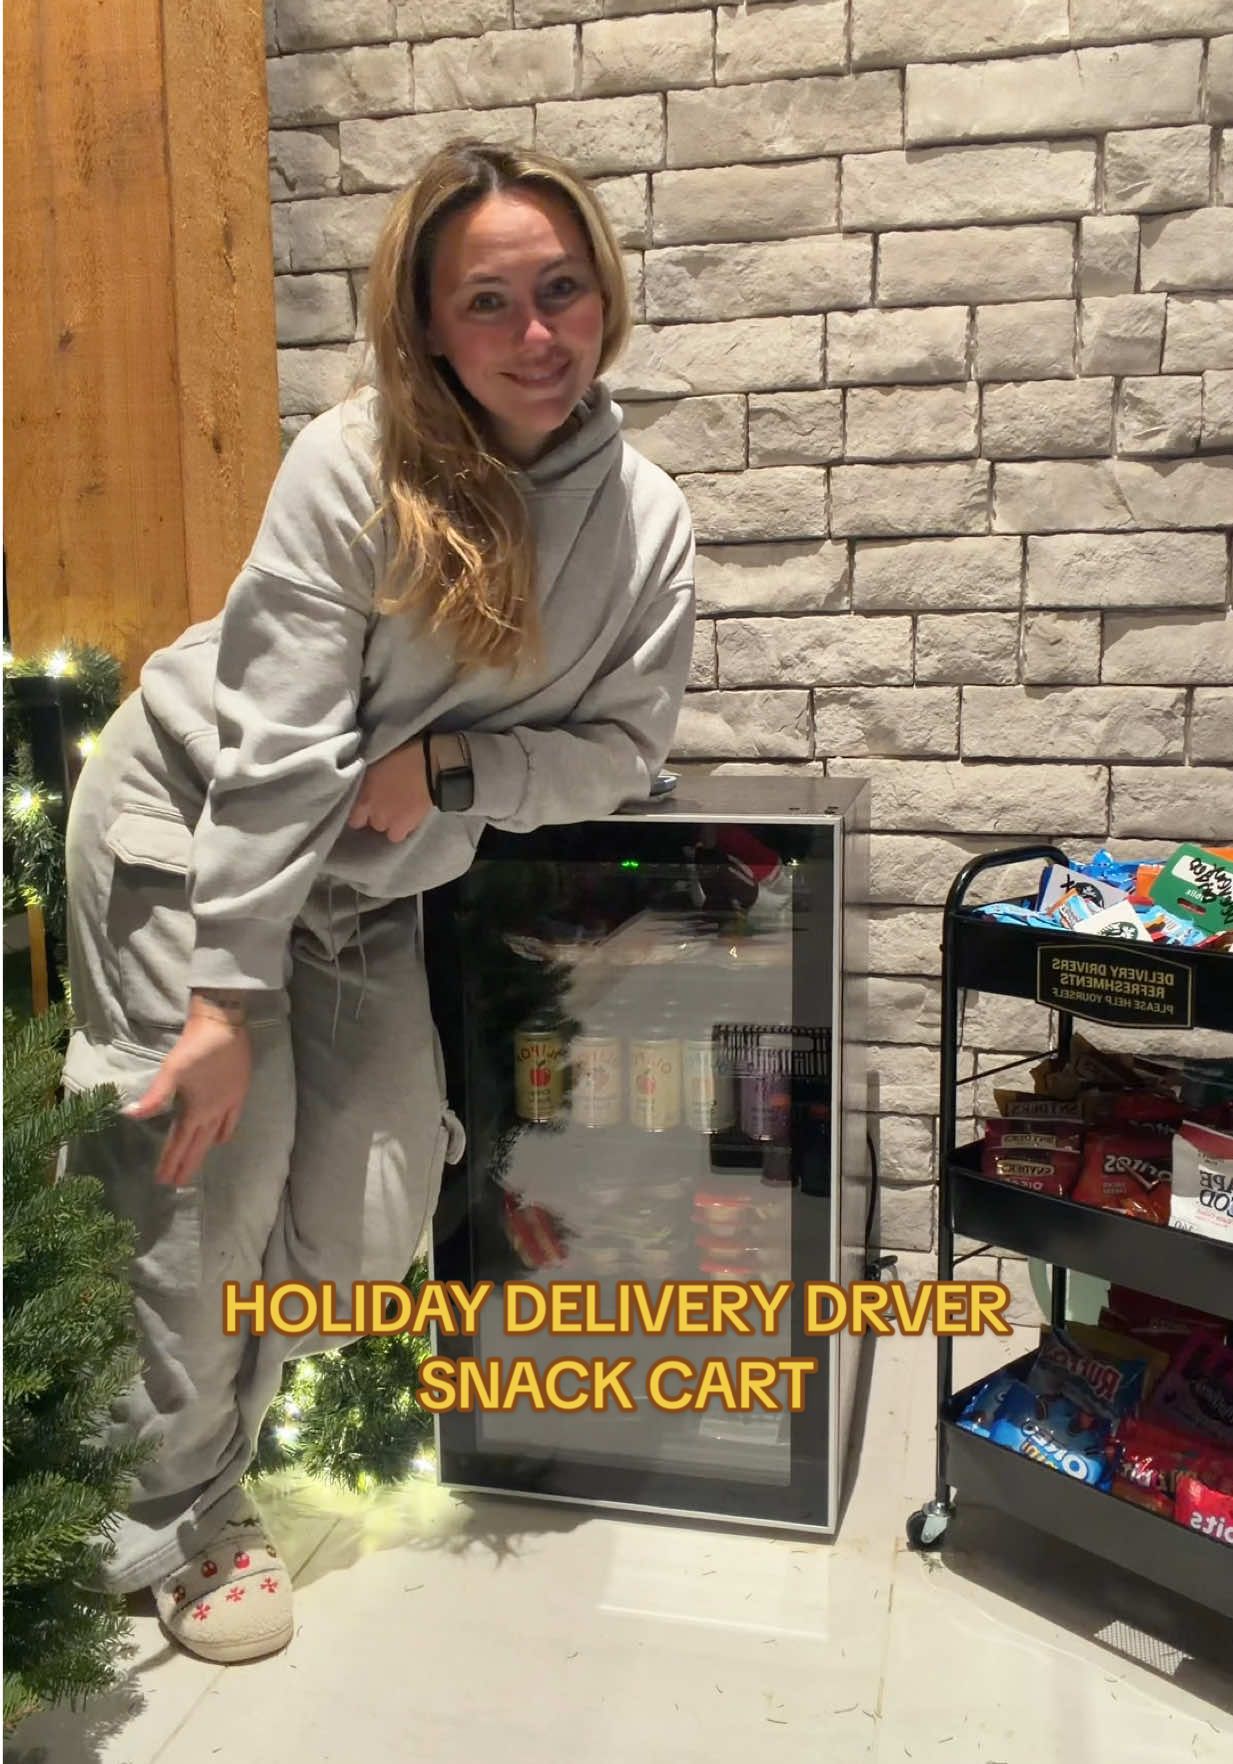
Out of 3.8k unique influencers in our dataset, 165 of them (4%) posted content for OLIPOP in 3 or more separate calendar months. The most consistent partner is @ChiefConcerns, who has collaborated across 12 months with 155 total posts.
Here are 3 examples of OLIPOP's repeat influencer partnerships, with links to the sponsored content.
ChiefConcerns x OLIPOP
![YouTube post by @ChiefConcerns for OLIPOP. Caption reads: [...] Dunn Jersey: 🥤 Get 15% off OLIPOP: Use....](https://images.od.modash.io/c72feaea088d19f25779973a80602c7b2c366884)
![YouTube post by @ChiefConcerns for OLIPOP. Caption reads: [...] Dunn Jersey: 🥤 Get 15% off OLIPOP: Use....](https://images.od.modash.io/6a7e667fddcd56dd86b437a8c6baf01d64992938)
![YouTube post by @ChiefConcerns for OLIPOP. Caption reads: [...] Dunn Jersey: 🥤 Get 15% off OLIPOP: Use....](https://images.od.modash.io/935bdf1fd303f6839c14eb9fe78f695048141f21)
royalerachele x OLIPOP
![TikTok post by @royalerachele for OLIPOP. Caption reads: OLIPOP + food @OLIPOP #bestsoda [...].](https://images.od.modash.io/2f45dcf292d12f38a90bb7403b2e2af9c257be8d)
![TikTok post by @royalerachele for OLIPOP. Caption reads: OLIPOP + ice cream float @OLIPOP [...].](https://images.od.modash.io/df44eed8feaf1942aef579dc1e0bf42f6d7ba25f)
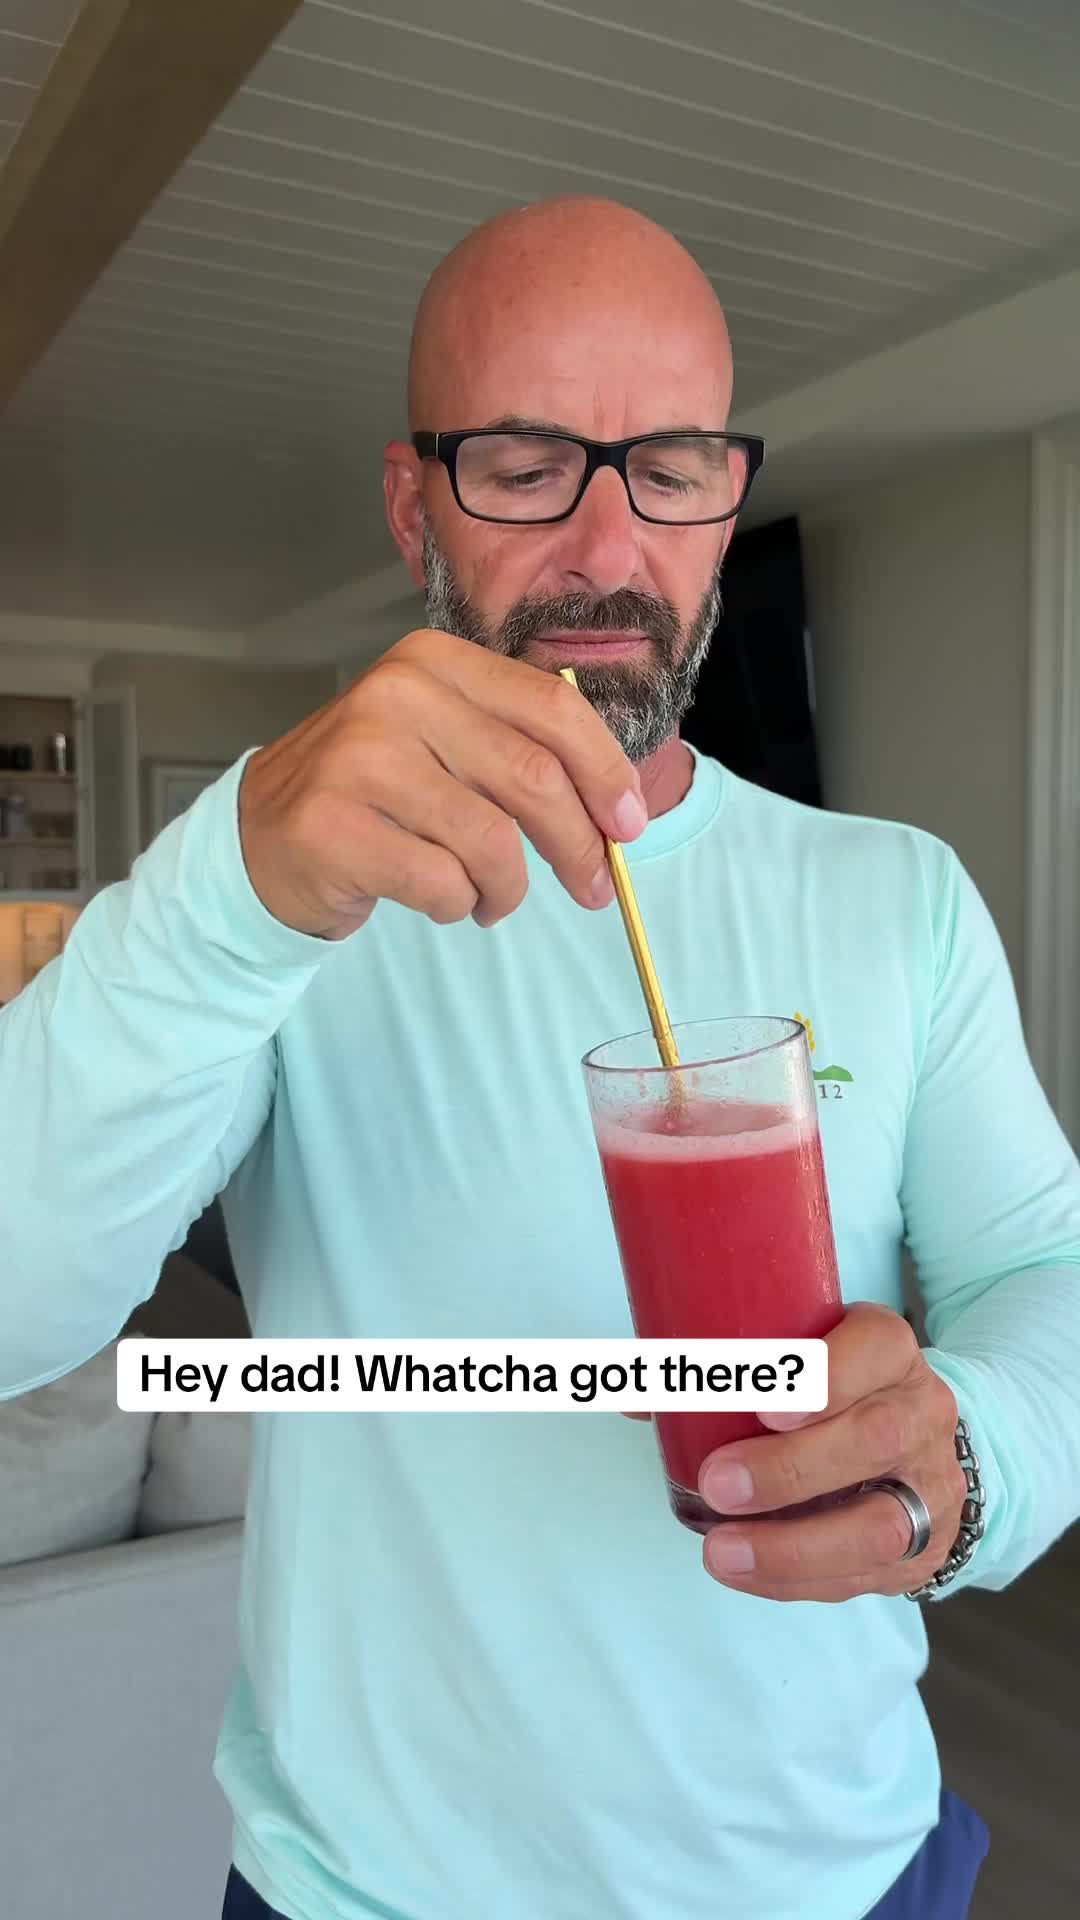
johnrondi x OLIPOP
![TikTok post by @johnrondi for OLIPOP. Caption reads: [...] Bulldog Cocktail 🥛 🥤 @OLIPOP....](https://images.od.modash.io/7e1e3510da1c8bbd68afcca9fd3c1b38547194b2)
![TikTok post by @johnrondi for OLIPOP. Caption reads: [...] 🥤 root beer floats with dad @OLIPOP....](https://images.od.modash.io/91b2c4589fa60894949663f0658f73a09a598aa4)
💡 Related resource: Long-Term Influencer Partnerships: Pros, Cons & How The Pros Manage Them.
Geographical breakdown
In our dataset, United States is where OLIPOP had the most influencer activity. 81.9% of their live influencer content in the last 12 months was posted by American influencers.
Based on the percentage of influencer content per market, other important markets include:
- United Kingdom (3.2%)
- Canada (2.7%)
- Brazil (2.3%)
OLIPOP's influencer activity by market
Here is another example of OLIPOP collaborating with an influencer in United States.
shhhhimeating x OLIPOP
OLIPOP's influencer activity vs. related brands
OLIPOP competes with Poppi and Liquid Death in modern beverage brands built through culture and influencer-driven virality. They target overlapping consumers looking for better alternatives to conventional drinks and are differentiated through strong brand voice and social content.
Total influencer content
OLIPOP vs. related brands influencer activity
Total sponsored posts tracked (last 12 months)
Poppi leads with 9.5k sponsored posts, significantly outpacing OLIPOP (5.9k posts) and Liquid Death (1.2k posts). Across all three brands, the average volume is 5.5k posts, indicating mature, scaled influencer programs. Poppi has notably more total posts than OLIPOP and Liquid Death.
By social platform
OLIPOP vs. related brands influencer activity (by social platform)
Sponsored posts by platform
OLIPOP leads on YouTube, while Poppi has the most activity on Instagram and TikTok. The gap is most notable on TikTok, with Poppi at 6.7k, OLIPOP at 2.7k, Liquid Death at 501 posts. Poppi's activity is particularly concentrated on TikTok. On TikTok, Poppi has far more posts than OLIPOP and Liquid Death, while on YouTube OLIPOP has more posts than Poppi.
By geographical market
OLIPOP vs. related brands influencer activity (by country)
Estimated sponsored posts in OLIPOP's top markets
Poppi has the highest estimated sponsored-post volume in United States (7.4k posts, 77.4%), Canada (630 posts, 6.6%), United Kingdom (420 posts, 4.4%), suggesting a North America focus, while Liquid Death leads in Brazil with 54 posts (4.6%). Looking at United States specifically, the split is Poppi at 7.4k posts (77.4%), OLIPOP at 4.8k posts (81.9%), Liquid Death at 873 posts (73.7%).
Read more influencer strategy breakdowns
Looking for more like this? Here are 5 similar influencer marketing strategy breakdowns for other brands:
- Poppi's Influencer Marketing Strategy
- Liquid Death's Influencer Marketing Strategy
- PARFUMS de MARLY's Influencer Marketing Strategy
- Juvia’s Place's Influencer Marketing Strategy
- Sweet Sweat's Influencer Marketing Strategy
Or, if you want to access data like this for your own software or processes, take a look at Modash's API products:
Frequently asked questions
Scaling your influencer program?
When you outgrow your mishmash of spreadsheets & free tools, try Modash. Find & email influencers, track campaigns, ship products & more - all in one place.