PUMIEY Influencer Marketing Strategy
(2026 Data & Insights)
We analyzed 7.1k pieces of influencer content sponsored by PUMIEY over the last 12 months.
This report breaks down where & how PUMIEY invests in influencer marketing, which social platforms they prioritize, top geographical markets, and more.
The data in this report comes from Modash's Brand Collaborations API.
P.S. for a simple list of influencers who have collaborated with PUMIEY, see here: PUMIEY influencers.
Influencer activity throughout the year
PUMIEY's influencer campaigns are active year-round with notable month-to-month fluctuation. The chart below shows month-by-month data for total sponsored posts tracked.
PUMIEY's influencer activity by month
Number of sponsored posts
PUMIEY's sponsored post volume appears to trend upward over the 12-month period, rising from 701 posts in January to 732 in December. The peak month, September, reached 904 posts, 53% higher than the monthly average of 591.
Social platforms breakdown
In our dataset (which only includes Instagram, YouTube, and TikTok), this is how the volume of PUMIEY's sponsored influencer collaborations break down by social platform:
- TikTok: 6.6k posts (93%)
- Instagram: 495 posts (7%)
PUMIEY's influencer activity by platform
Share of sponsored content by social network
TikTok influencer marketing is a clear focus for PUMIEY.
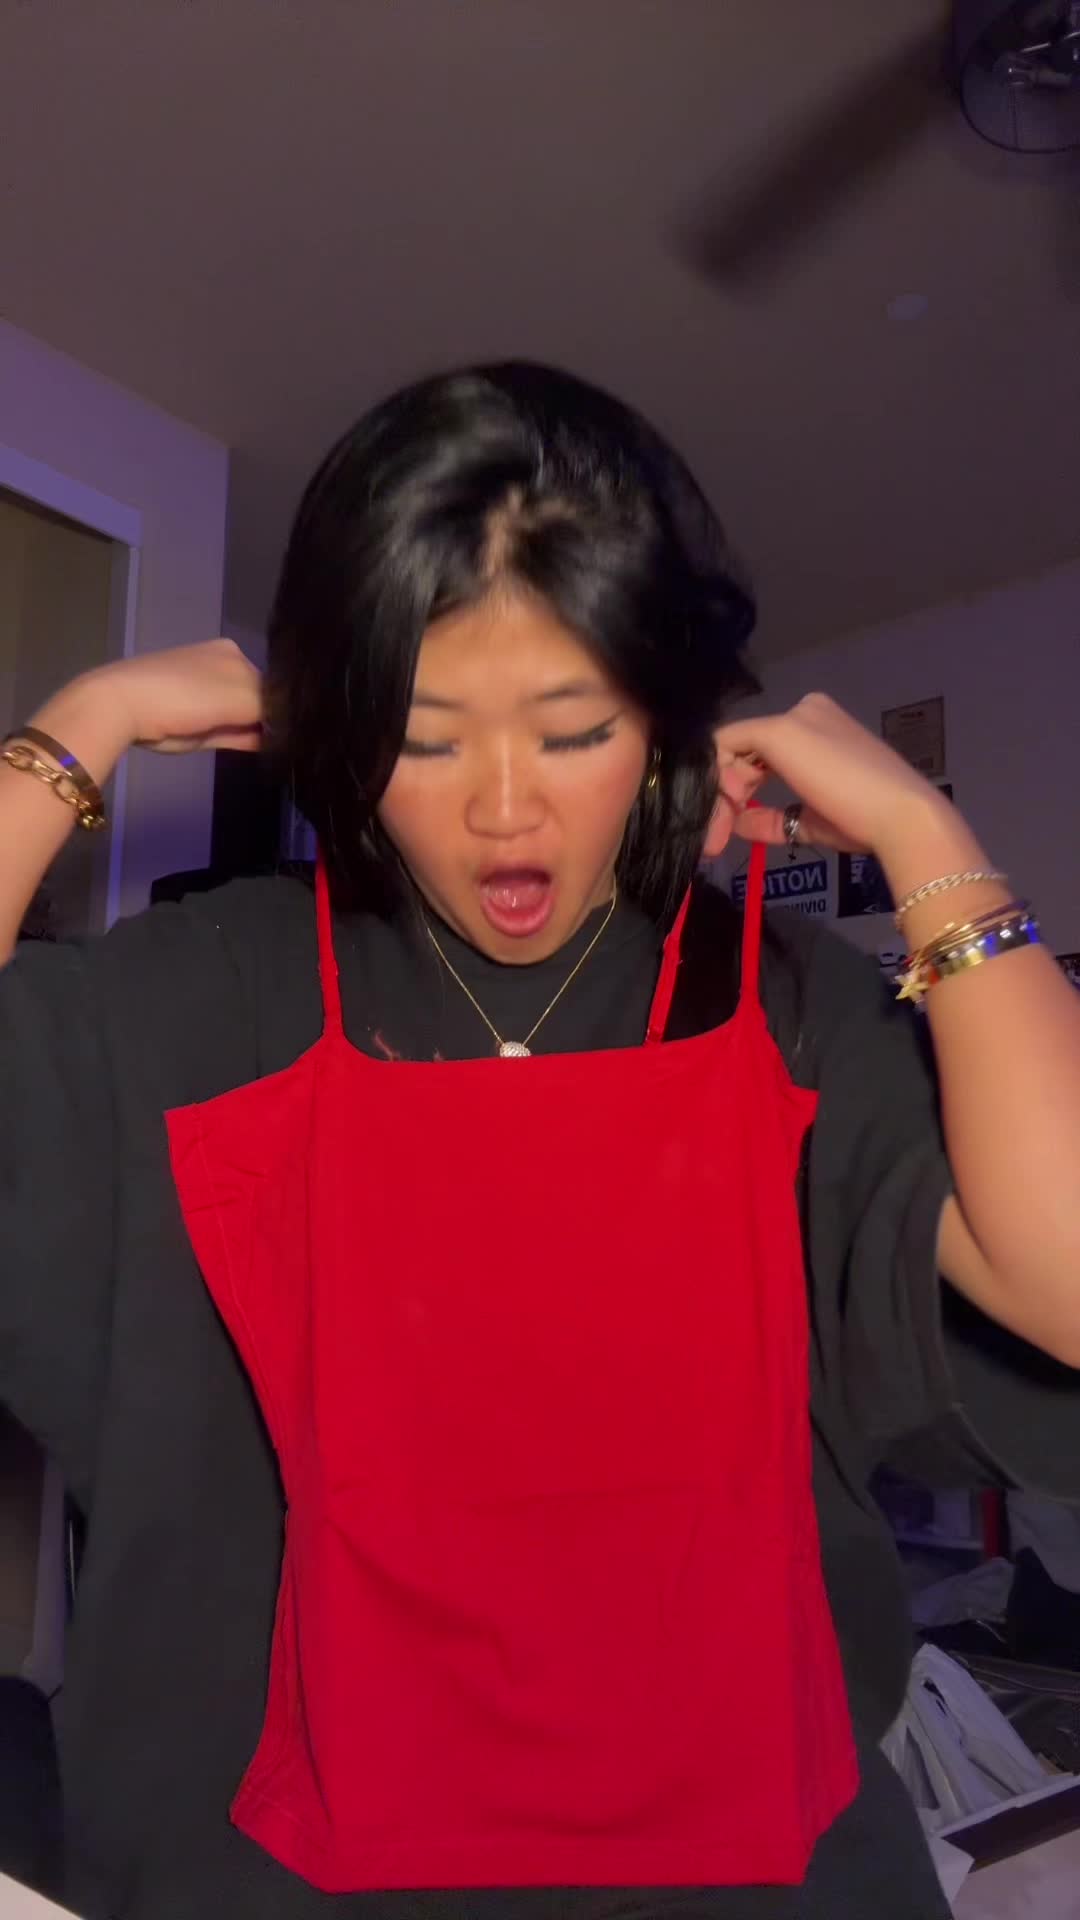
Here are 2 examples of PUMIEY's recent sponsored collaborations (one each for Instagram, TikTok).
merricksart x PUMIEY
![Instagram post by @merricksart for PUMIEY. Caption reads: [...] and I’ll send you a DM with the link ❤️....](https://images.od.modash.io/be504ffb87023c64ac939d5e0c3e43079449816a)
Influencer bio
🧍🏻♀️Outfit ideas you’ll actually wear from a midwest mom 🛒 Elevated basics • affordable finds • style help 💌: orooney@parkertalentmanagement.com
Collaboration metrics
Get a free trial to find more data on influencer audiences, performance, and collaborations.
celesteoutfits x PUMIEY
Influencer bio
sexy funny amazing talented beautiful tiktok shopper depop: @luvnos 💌dj.celeste.booking@gmail.com 3/6
Collaboration metrics
Get a free trial to find more data on influencer audiences, performance, and collaborations.
If you break this down further by content type on TikTok, this is what it looks like:
- Videos: 94.9%
- Carousels: 5.1%
💡 Related resource: How To Find TikTok Influencers.
Influencer audience size breakdown (by views)
For their top social platform (TikTok), here is a breakdown of the type of influencers PUMIEY are collaborating with, by audience size.
Note: this breakdown is based on each influencer's average views (not follower/subscriber count), because views typically correlate more closely with influencer pricing and impact.
PUMIEY's influencers average views (TikTok)
Based on each influencer's average views per post
With 57% of partnerships featuring creators averaging <1K views, PUMIEY's strategy suggests niche targeting and authenticity, likely leveraging collaboration models like gifting and affiliates to work with smaller creators.
Here is an example of a sponsored collaboration with a larger-audience creator on TikTok (524.5k avg views/post):
pantrymints x PUMIEY

Influencer bio
ig pantrymints hawaii D🤍
Collaboration metrics
Get a free trial to find more data on influencer audiences, performance, and collaborations.
And here is another example with a smaller creator on TikTok (10.0k avg views/post):
jeeyahhhh_ x PUMIEY

Influencer bio
📧 : Jeeyahj@yahoo.com @Jee💜 @JTD🍪
Collaboration metrics
Get a free trial to find more data on influencer audiences, performance, and collaborations.
PUMIEY's repeat partnerships
Out of 3k unique influencers in our dataset, 311 of them (10%) posted content for PUMIEY in 3 or more separate calendar months. The most consistent partner is @nessa19930, who has collaborated across 11 months with 63 total posts.
Here are 3 examples of PUMIEY's repeat influencer partnerships, with links to the sponsored content.
nessa19930 x PUMIEY
![TikTok post by @nessa19930 for PUMIEY. Caption reads: [...] form fitting everyday tshirt😍#pumiey....](https://images.od.modash.io/d79edfe75be4b1af3ab26e7c444669f4985172b3)
![TikTok post by @nessa19930 for PUMIEY. Caption reads: [...] | comfy basics you’ll rewear😍#pumiey....](https://images.od.modash.io/8c6a9416987ed60f2f9d39ede932386e090d8fc1)
![TikTok post by @nessa19930 for PUMIEY. Caption reads: [...] #undershirt #basictops #pumiey @PUMIEY.](https://images.od.modash.io/3cad789729e26028b3d7587ce7d02a1e203d0766)
faythemariefree x PUMIEY
![TikTok post by @faythemariefree for PUMIEY. Caption reads: [...] dress is a whole vibe 👏🥰👀 @PUMIEY....](https://images.od.modash.io/22b77e8d35e3ab887a0b4f47af56bebe1e3f5178)
![TikTok post by @faythemariefree for PUMIEY. Caption reads: [...] waistband = made for you ✨ @PUMIEY....](https://images.od.modash.io/3dc37a809e48b9d1cf1f68f89c4d0abee6795fe1)
![TikTok post by @faythemariefree for PUMIEY. Caption reads: [...] 🥹🩷 BIG PROUD OF HER. @PUMIEY....](https://images.od.modash.io/31be9f118ce7afa37e7c9d71534948926046203e)
3_sister_vibes x PUMIEY
![TikTok post by @3_sister_vibes for PUMIEY. Caption reads: [...] #longsleevetop #ootdinspo @PUMIEY.](https://images.od.modash.io/f541f8f0b3faf786eba2d57140f655a1f318ceff)
![TikTok post by @3_sister_vibes for PUMIEY. Caption reads: [...] #bodysuit #christma @PUMIEY.](https://images.od.modash.io/fe454a6156a9dcf5289b9ff9e3b26d32ffa8ca3a)
![TikTok post by @3_sister_vibes for PUMIEY. Caption reads: [...] #longsleeveshirt #OOTD @PUMIEY.](https://images.od.modash.io/ebfafd2657c3a9f64c8c03af7490f5dba38abb80)
💡 Related resource: Long-Term Influencer Partnerships: Pros, Cons & How The Pros Manage Them.
Geographical breakdown
In our dataset, United States is where PUMIEY had the most influencer activity. 78.4% of their live influencer content in the last 12 months was posted by American influencers.
Based on the percentage of influencer content per market, other important markets include:
- Brazil (4.1%)
- United Kingdom (3.8%)
- Canada (3.4%)
PUMIEY's influencer activity by market
Here is another example of PUMIEY collaborating with an influencer in United States.
yur.not x PUMIEY

PUMIEY's influencer activity vs. related brands
PUMIEY competes with Popilush and Shapermint in shapewear-adjacent women’s basics where sculpting fit and comfort are primary purchase drivers. These brands commonly use influencer try-ons, sizing guidance, and outfit styling to convert shoppers.
Total influencer content
PUMIEY vs. related brands influencer activity
Total sponsored posts tracked (last 12 months)
Popilush leads with 12k sponsored posts, significantly outpacing PUMIEY (7.1k posts) and Shapermint (1.9k posts). Across all three brands, the average volume is 7k posts, indicating mature, scaled influencer programs. Popilush has nearly twice as many total posts as PUMIEY and more than six times as many as Shapermint.
By social platform
PUMIEY vs. related brands influencer activity (by social platform)
Sponsored posts by platform
Among these brands, Popilush leads on Instagram and TikTok and Shapermint leads on YouTube. The gap is most notable on TikTok, with Popilush at 9.7k, PUMIEY at 6.6k, Shapermint at 1k posts. PUMIEY's activity is particularly concentrated on TikTok. On Instagram, Popilush has more than four times as many posts as PUMIEY, and on YouTube PUMIEY has no posts while Shapermint has 55.
By geographical market
PUMIEY vs. related brands influencer activity (by country)
Estimated sponsored posts in PUMIEY's top markets
Popilush has the highest estimated sponsored-post volume in United States (7.7k posts, 64.3%), United Kingdom (963 posts, 8%), Brazil (517 posts, 4.3%), while Shapermint leads in Canada with 110 posts (5.7%). Looking at United States specifically, the split is Popilush at 7.7k posts (64.3%), PUMIEY at 5.6k posts (78.4%), Shapermint at 1.4k posts (70.5%).
Read more influencer strategy breakdowns
Looking for more like this? Here are 5 similar influencer marketing strategy breakdowns for other brands:
- Popilush's Influencer Marketing Strategy
- Shapermint's Influencer Marketing Strategy
- Lull's Influencer Marketing Strategy
- Reebok's Influencer Marketing Strategy
- Nike's Influencer Marketing Strategy
Or, if you want to access data like this for your own software or processes, take a look at Modash's API products:
Frequently asked questions
Scaling your influencer program?
When you outgrow your mishmash of spreadsheets & free tools, try Modash. Find & email influencers, track campaigns, ship products & more - all in one place.