Comfrt Influencer Marketing Strategy
(2026 Data & Insights)
We analyzed 61.0k pieces of influencer content sponsored by Comfrt over the last 12 months.
This report breaks down where & how Comfrt invests in influencer marketing, which social platforms they prioritize, top geographical markets, and more.
The data in this report comes from Modash's Brand Collaborations API.
P.S. for a simple list of influencers who have collaborated with Comfrt, see here: Comfrt influencers.
Influencer activity throughout the year
Comfrt's influencer campaigns are active year-round with notable month-to-month fluctuation. The chart below shows month-by-month data for total sponsored posts tracked.
Comfrt's influencer activity by month
Number of sponsored posts
Comfrt's sponsored post volume peaks in January with 9.7k posts, 90% higher than the monthly average of 5.1k. March recorded the lowest activity at 2.4k posts, 54% below average. This could reflect a holiday-focused influencer strategy.
Social platforms breakdown
In our dataset (which only includes Instagram, YouTube, and TikTok), this is how the volume of Comfrt's sponsored influencer collaborations break down by social platform:
- TikTok: 59.5k posts (97.5%)
- Instagram: 1.3k posts (2.1%)
- YouTube: 232 posts (0.4%)
Comfrt's influencer activity by platform
Share of sponsored content by social network
TikTok influencer marketing is a clear focus for Comfrt.
Here are 3 examples of Comfrt's recent sponsored collaborations (one each for Instagram, TikTok, YouTube).
therusticrosebud x Comfrt
![Instagram post by @therusticrosebud for Comfrt. Caption reads: [...] the product link! Do not disturb 👋🏼✈️....](https://images.od.modash.io/9be7dfacce37645ad84a0ae2fd35547568fca228)
Influencer bio
Mom of 4 ▪️Home Products | Kids Toys ▪️TikTok 183k COLLABS 💌 therusticrosebud@gmail.com
Collaboration metrics
Get a free trial to find more data on influencer audiences, performance, and collaborations.
brookechello x Comfrt
Influencer bio
@Comfrt fashion & beauty jersey girl 💌Brookechirichello16@icloud.com💌
Collaboration metrics
Get a free trial to find more data on influencer audiences, performance, and collaborations.
RachhLoves x Comfrt
![YouTube post by @RachhLoves for Comfrt. Caption reads: [...] Airbrush Concealer 03:35 Earrings 07:10....](https://images.od.modash.io/d30494c46322c893e069dd296dd38524920c8831)
Influencer bio
Welcome! We test a ton of popular, overhyped beauty/style products to see what's actually worth buying.
Collaboration metrics
Get a free trial to find more data on influencer audiences, performance, and collaborations.
If you break this down further by content type on TikTok, this is what it looks like:
- Videos: 93.2%
- Carousels: 6.8%
💡 Related resource: How To Find TikTok Influencers.
Influencer audience size breakdown (by views)
For their top social platform (TikTok), here is a breakdown of the type of influencers Comfrt are collaborating with, by audience size.
Note: this breakdown is based on each influencer's average views (not follower/subscriber count), because views typically correlate more closely with influencer pricing and impact.
Comfrt's influencers average views (TikTok)
Based on each influencer's average views per post
With 56.4% of partnerships featuring creators averaging <1K views, Comfrt's strategy suggests niche targeting and authenticity, likely leveraging collaboration models like gifting and affiliates to work with smaller creators.
Here is an example of a sponsored collaboration with a larger-audience creator on TikTok (1.7M avg views/post):
pico.de.golden x Comfrt

Influencer bio
📍Chicago Come navigate puppyhood with Pico 🦴 💌picodegolden@gmail.com
Collaboration metrics
Get a free trial to find more data on influencer audiences, performance, and collaborations.
And here is another example with a smaller creator on TikTok (2.9k avg views/post):
a.butler17 x Comfrt
Influencer bio
Mom | Outfit Inspo | Lifestyle | Beauty 💌 ally.butler1723@gmail.com Links 🔗
Collaboration metrics
Get a free trial to find more data on influencer audiences, performance, and collaborations.
Comfrt's repeat partnerships
Out of 9k unique influencers in our dataset, 1.6k of them (18%) posted content for Comfrt in 3 or more separate calendar months. The most consistent partner is @heylianawood, who has collaborated across 12 months with 686 total posts.
Here are 3 examples of Comfrt's repeat influencer partnerships, with links to the sponsored content.
heylianawood x Comfrt
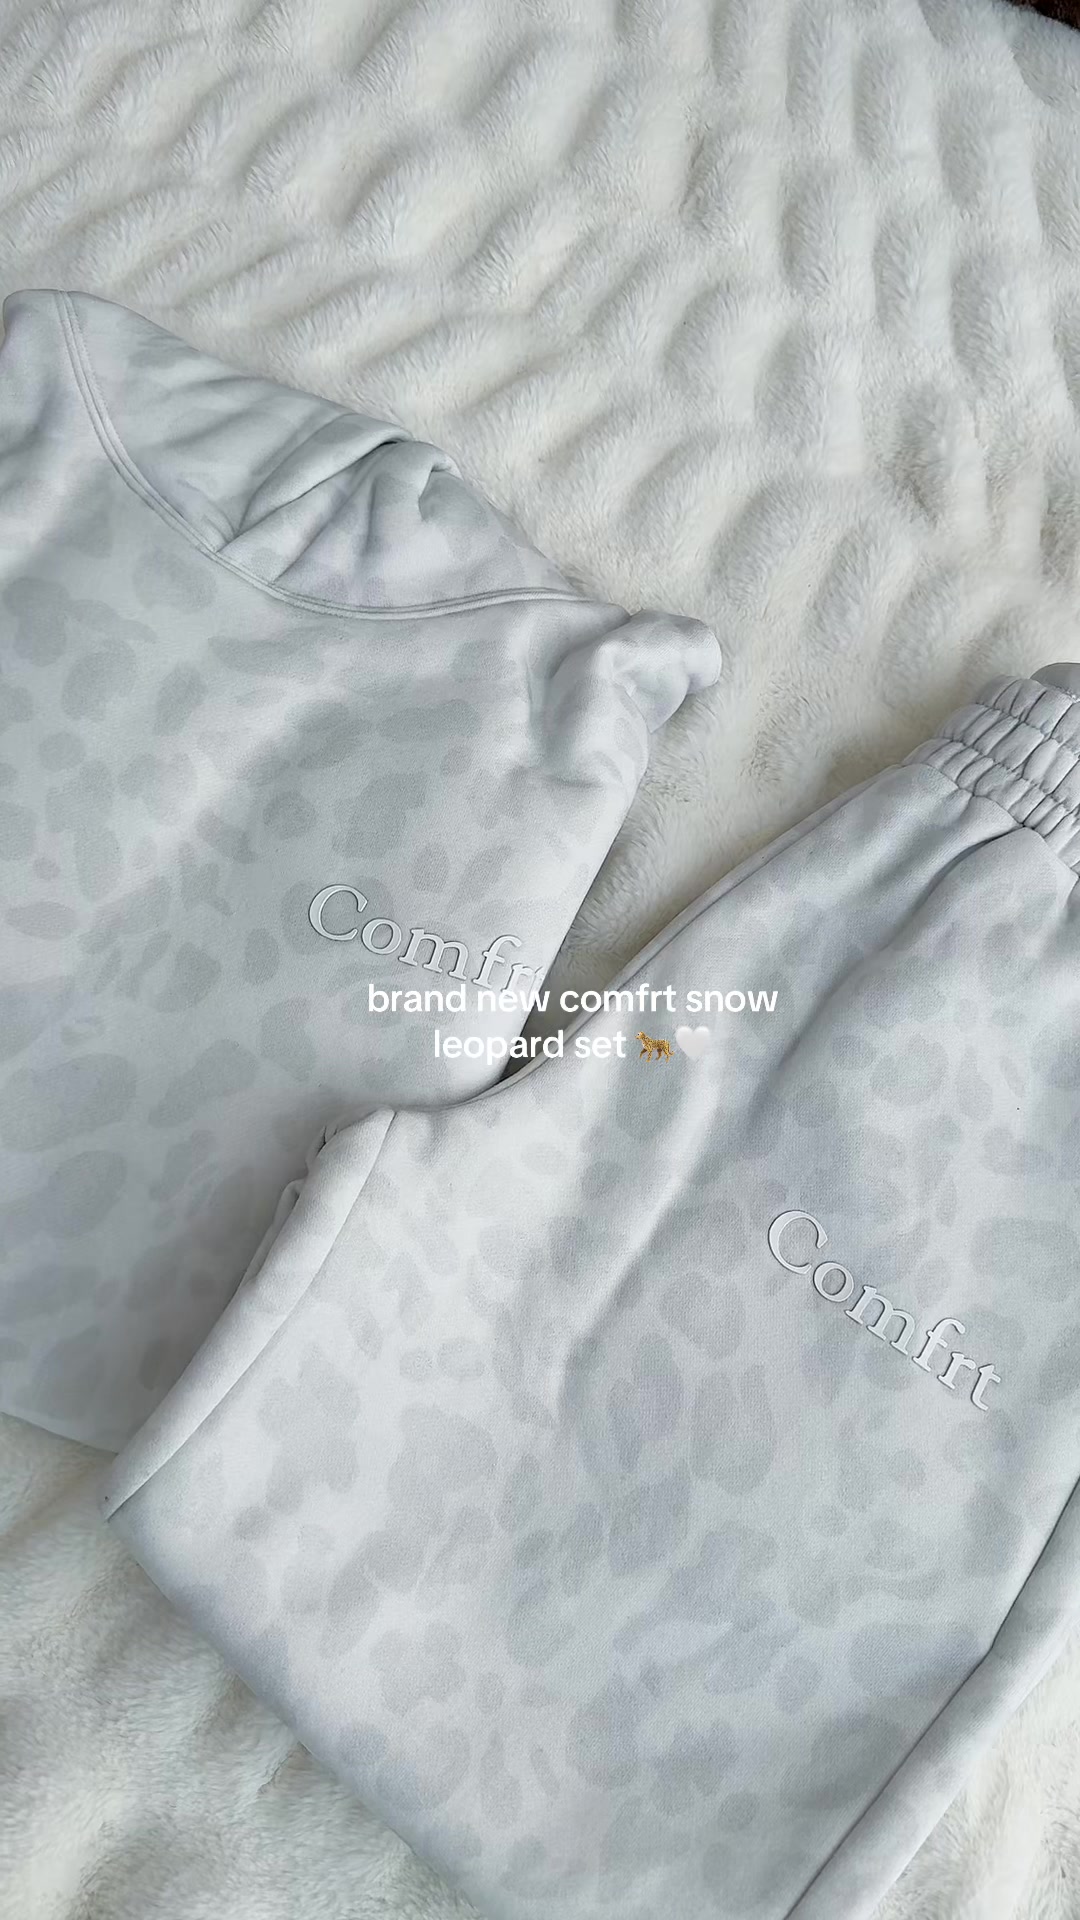
![TikTok post by @heylianawood for Comfrt. Caption reads: [...] THIS HOODIE IS GENIUS @Comfrt.](https://images.od.modash.io/1e3b865c297cad797da5b822f1f3891a687e6a90)
![TikTok post by @heylianawood for Comfrt. Caption reads: [...] to @JERSEY KOLASA OBSESSED 😍 @Comfrt.](https://images.od.modash.io/bdbdafbfc5fc132bf8bfc2c8ad5b24eeb2a461f6)
![TikTok post by @heylianawood for Comfrt. Caption reads: [...] these blankets are a need 😍 @Comfrt.](https://images.od.modash.io/7abb200399ca9151be9f9ff85632eab3e8e985c5)
tanyaasurjan x Comfrt
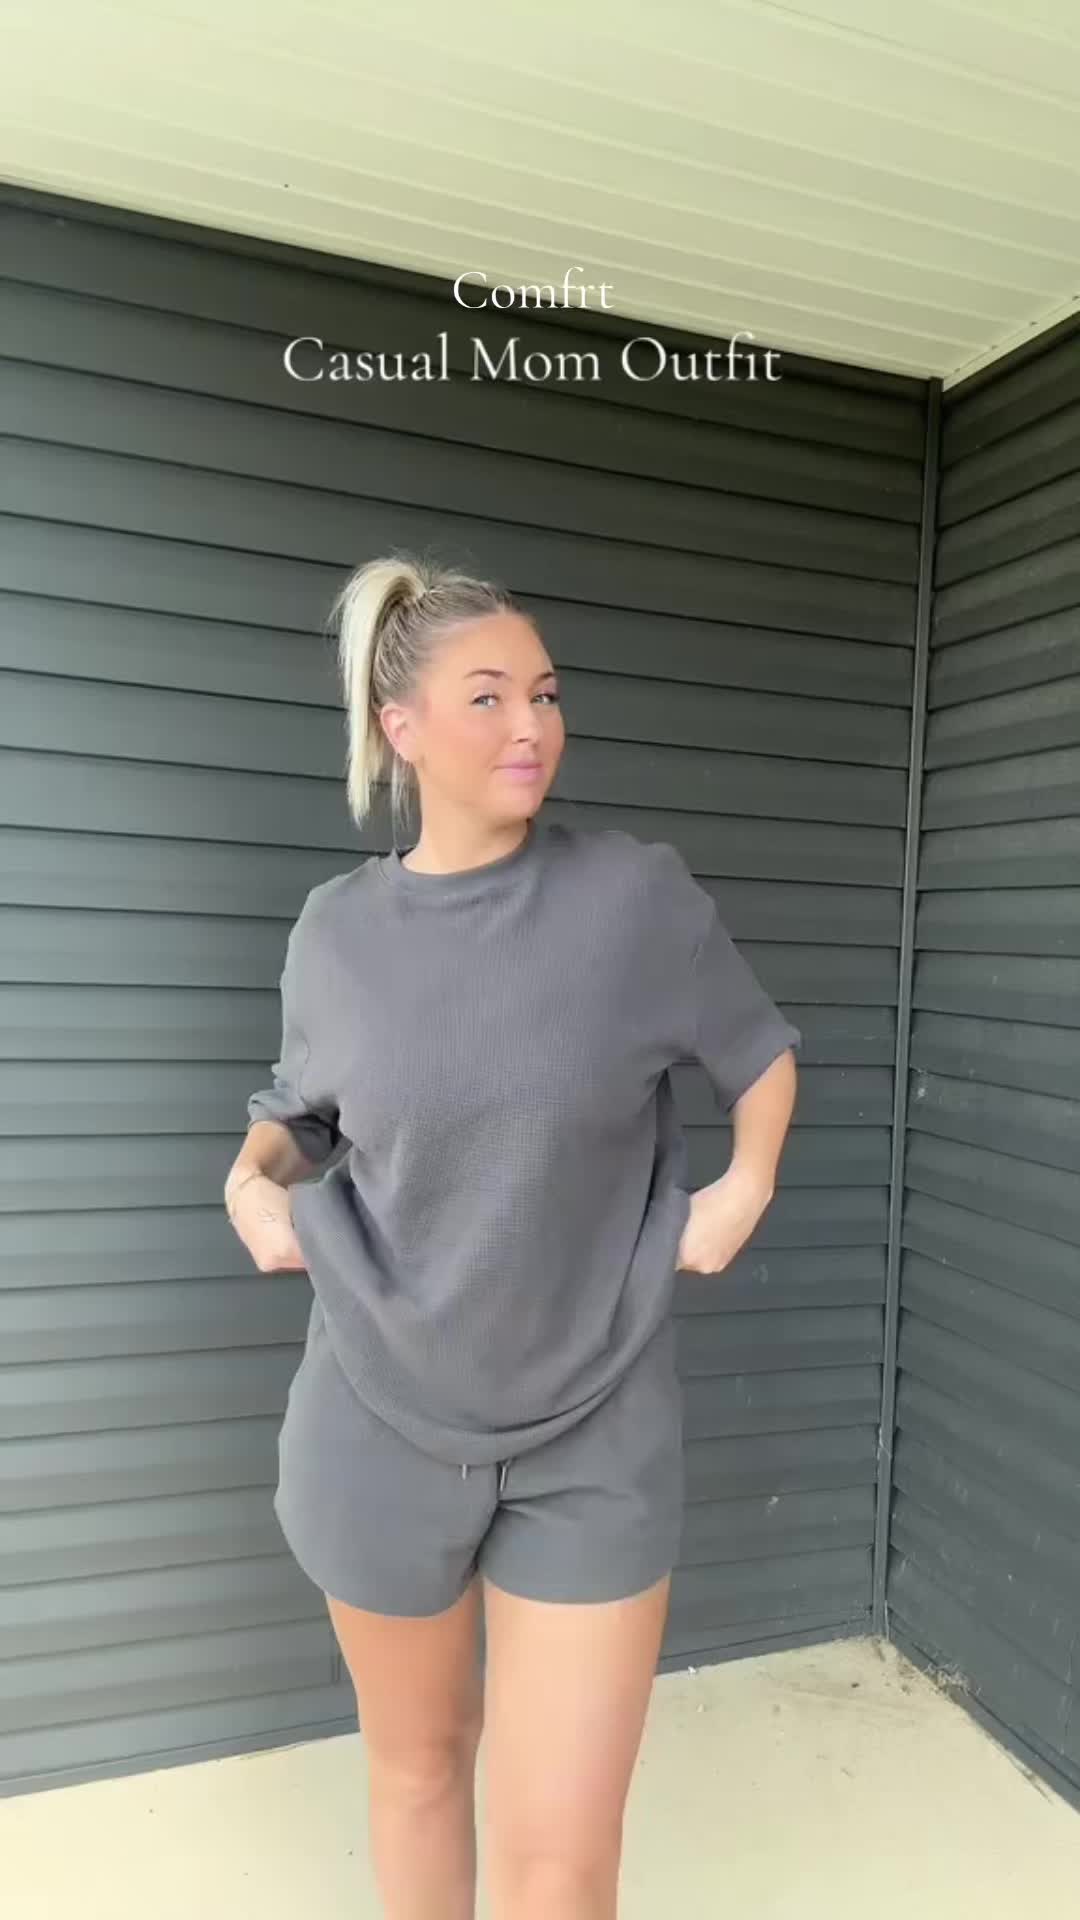
![TikTok post by @tanyaasurjan for Comfrt. Caption reads: [...] is an understatement 🧸☁️🖤 @Comfrt.](https://images.od.modash.io/10785699422fe5a4156102bf69a2700381f8a08f)
![TikTok post by @tanyaasurjan for Comfrt. Caption reads: [...] ever felt in my life 🧸☁️💙 @Comfrt #comfrt....](https://images.od.modash.io/e090fb4ac71ab050f4db7d9eab0bed5e821b3e40)
![TikTok post by @tanyaasurjan for Comfrt. Caption reads: [...] it’s 50% off right now 🧸☁️ @Comfrt #comfrt....](https://images.od.modash.io/6f19c0507824addd258c9c02cea1d59b77012510)
taytighe x Comfrt
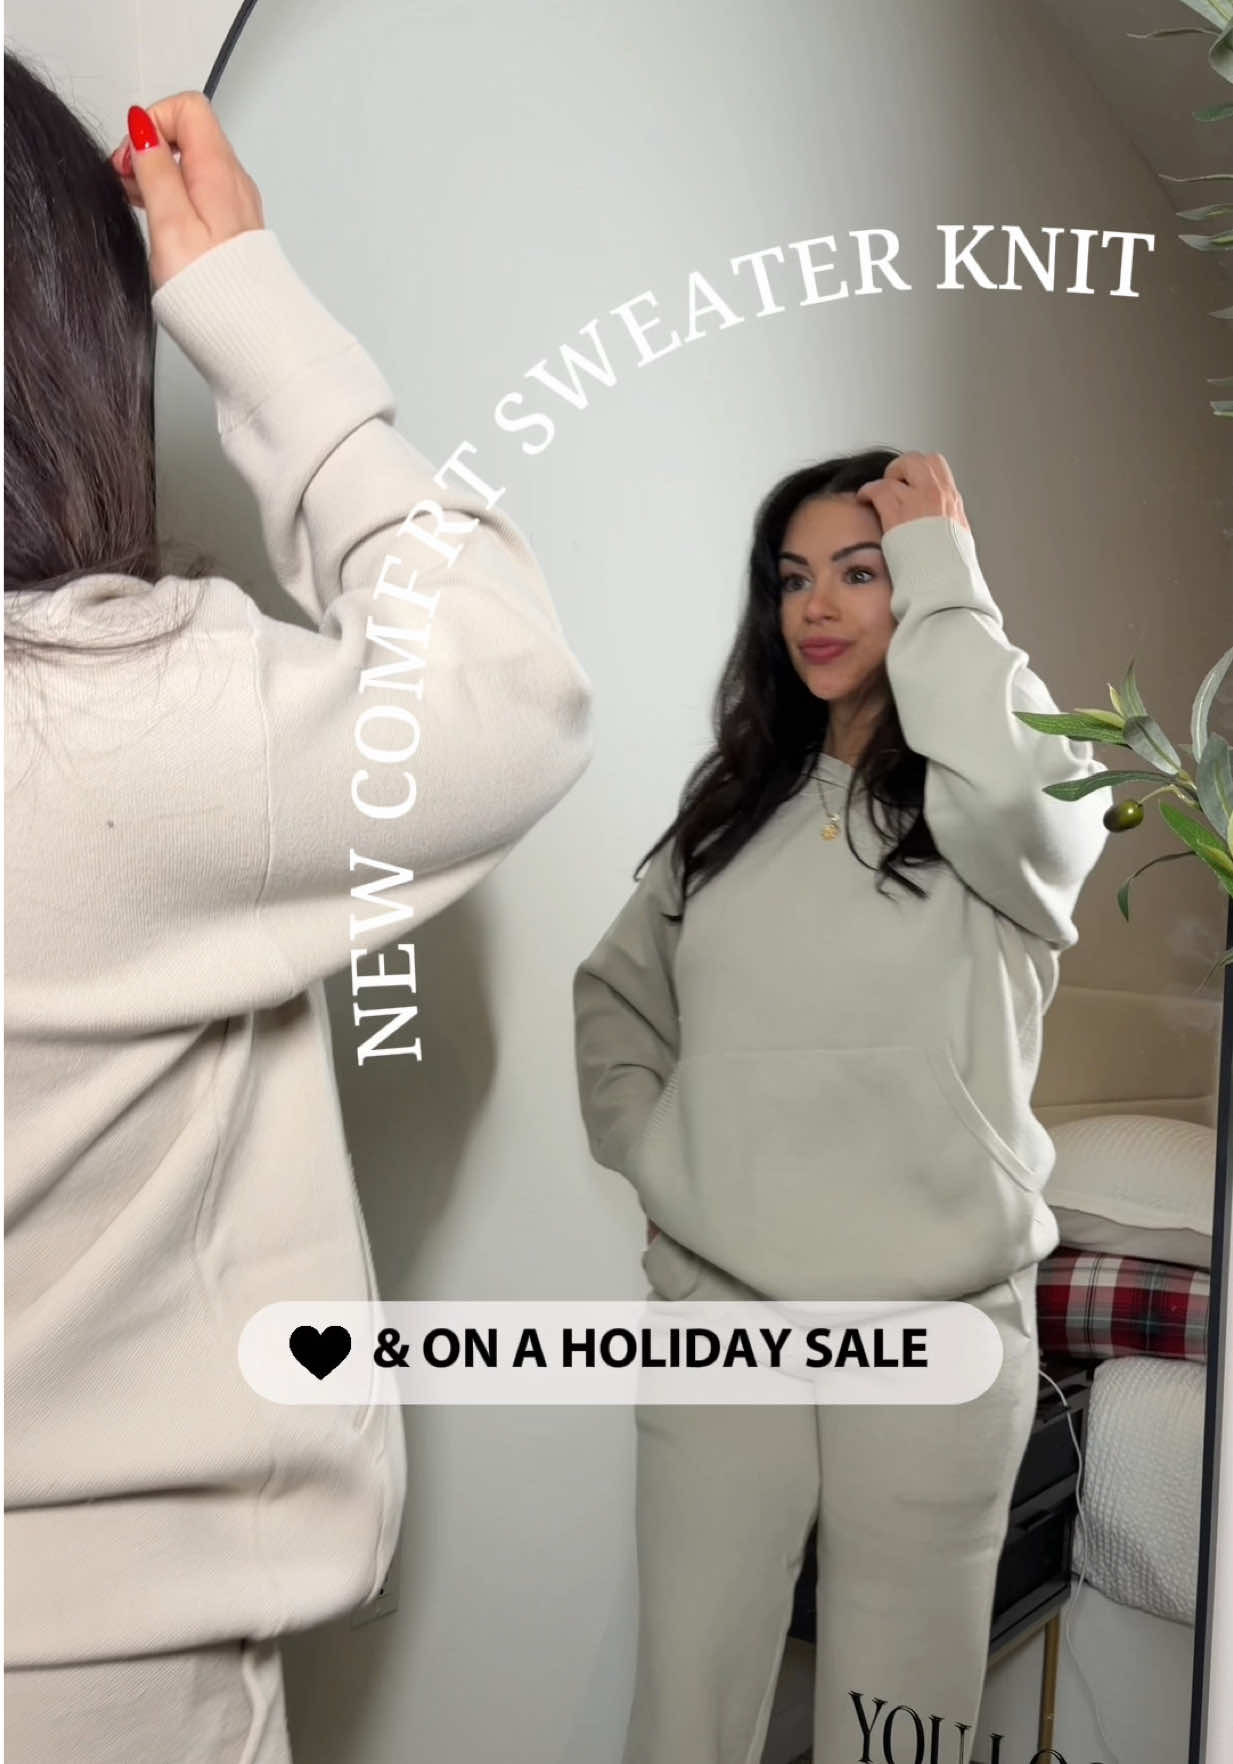

![TikTok post by @taytighe for Comfrt. Caption reads: [...] CANT BELIEVE THIS DROP 😭🥰🤩 @Comfrt.](https://images.od.modash.io/9b8311736c63bd5dee26c998bd5fee4e08e28f92)
💡 Related resource: Long-Term Influencer Partnerships: Pros, Cons & How The Pros Manage Them.
Geographical breakdown
In our dataset, United States is where Comfrt had the most influencer activity. 81.6% of their live influencer content in the last 12 months was posted by American influencers.
Based on the percentage of influencer content per market, other important markets include:
- Brazil (3.8%)
- Canada (3.2%)
- United Kingdom (3%)
Comfrt's influencer activity by market
Here is another example of Comfrt collaborating with an influencer in United States.
delanacrook x Comfrt

Comfrt's influencer activity vs. related brands
Comfrt overlaps with The Oodie and SKIMS in comfort-first apparel and loungewear where softness, fit, and everyday wearability drive purchase decisions. Influencer content for all three often centers on cozy try-ons, styling, and lifestyle integration.
Total influencer content
Comfrt vs. related brands influencer activity
Total sponsored posts tracked (last 12 months)
Comfrt leads with 61k sponsored posts, significantly outpacing Skims (15.5k posts) and The Oodie (1k posts). Across all three brands, the average volume is 25.9k posts, indicating mature, scaled influencer programs. Comfrt has far more total posts than The Oodie and Skims.
By social platform
Comfrt vs. related brands influencer activity (by social platform)
Sponsored posts by platform
Comfrt leads on TikTok, while Skims has the most activity on Instagram and YouTube. The gap is most notable on TikTok, with Comfrt at 59.5k, Skims at 7.9k, The Oodie at 279 posts. Comfrt's activity is particularly concentrated on TikTok. On TikTok, Comfrt has far more posts than The Oodie and Skims.
By geographical market
Comfrt vs. related brands influencer activity (by country)
Estimated sponsored posts in Comfrt's top markets
Comfrt has the highest estimated sponsored-post volume in United States (50k posts, 81.6%), Brazil (2.3k posts, 3.8%), Canada (2k posts, 3.2%), suggesting a North America focus, while Skims leads in United Kingdom with 964 posts (6.2%), while The Oodie leads in Australia with 186 posts (17.7%). Looking at United States specifically, the split is Comfrt at 50k posts (81.6%), Skims at 9.6k posts (61.6%), The Oodie at 342 posts (32.6%). Comfrt's strength in United States may indicate a home-market focus, while The Oodie shows broader regional investment.
Read more influencer strategy breakdowns
Looking for more like this? Here are 5 similar influencer marketing strategy breakdowns for other brands:
- The Oodie's Influencer Marketing Strategy
- Skims's Influencer Marketing Strategy
- Triquetra Health's Influencer Marketing Strategy
- Momcozy's Influencer Marketing Strategy
- Shaperx's Influencer Marketing Strategy
Or, if you want to access data like this for your own software or processes, take a look at Modash's API products:
Frequently asked questions
Scaling your influencer program?
When you outgrow your mishmash of spreadsheets & free tools, try Modash. Find & email influencers, track campaigns, ship products & more - all in one place.