EHPlabs Influencer Marketing Strategy
(2026 Data & Insights)
We analyzed 13.2k pieces of influencer content sponsored by EHPlabs over the last 12 months.
This report breaks down where & how EHPlabs invests in influencer marketing, which social platforms they prioritize, top geographical markets, and more.
The data in this report comes from Modash's Brand Collaborations API.
P.S. for a simple list of influencers who have collaborated with EHPlabs, see here: EHPlabs influencers.
Influencer activity throughout the year
EHPlabs's influencer campaigns are active year-round with notable month-to-month fluctuation. The chart below shows month-by-month data for total sponsored posts tracked.
EHPlabs's influencer activity by month
Number of sponsored posts
EHPlabs's influencer activity appears to have tapered over the year, from 1.4k posts in January down to 876 in December. April was the busiest month at 1.8k posts, 59% above the monthly average.
Social platforms breakdown
In our dataset (which only includes Instagram, YouTube, and TikTok), this is how the volume of EHPlabs's sponsored influencer collaborations break down by social platform:
- TikTok: 9.1k posts (68.5%)
- Instagram: 4.2k posts (31.5%)
EHPlabs's influencer activity by platform
Share of sponsored content by social network
TikTok influencer marketing is a clear focus for EHPlabs.
Here are 2 examples of EHPlabs's recent sponsored collaborations (one each for Instagram, TikTok).
jadentysonlaing x EHPlabs

Influencer bio
ɪ’ᴍ ɴᴏᴛ ᴀɴ ɪɴꜰʟᴜᴇɴᴄᴇʀ, ɪ’ᴍ ᴀ ꜰᴏʟʟᴏᴡᴇʀ ᴏꜰ ɢᴏᴅ 📈 ʙʀᴀɴᴅ • @laingstrong 🎥 ʏᴏᴜᴛᴜʙᴇ • @jadenlaingyoutube 🔋@oxyshred • ᴄᴏᴅᴇ: ʟᴀɪɴɢ
Collaboration metrics
Get a free trial to find more data on influencer audiences, performance, and collaborations.
teebodiedme x EHPlabs
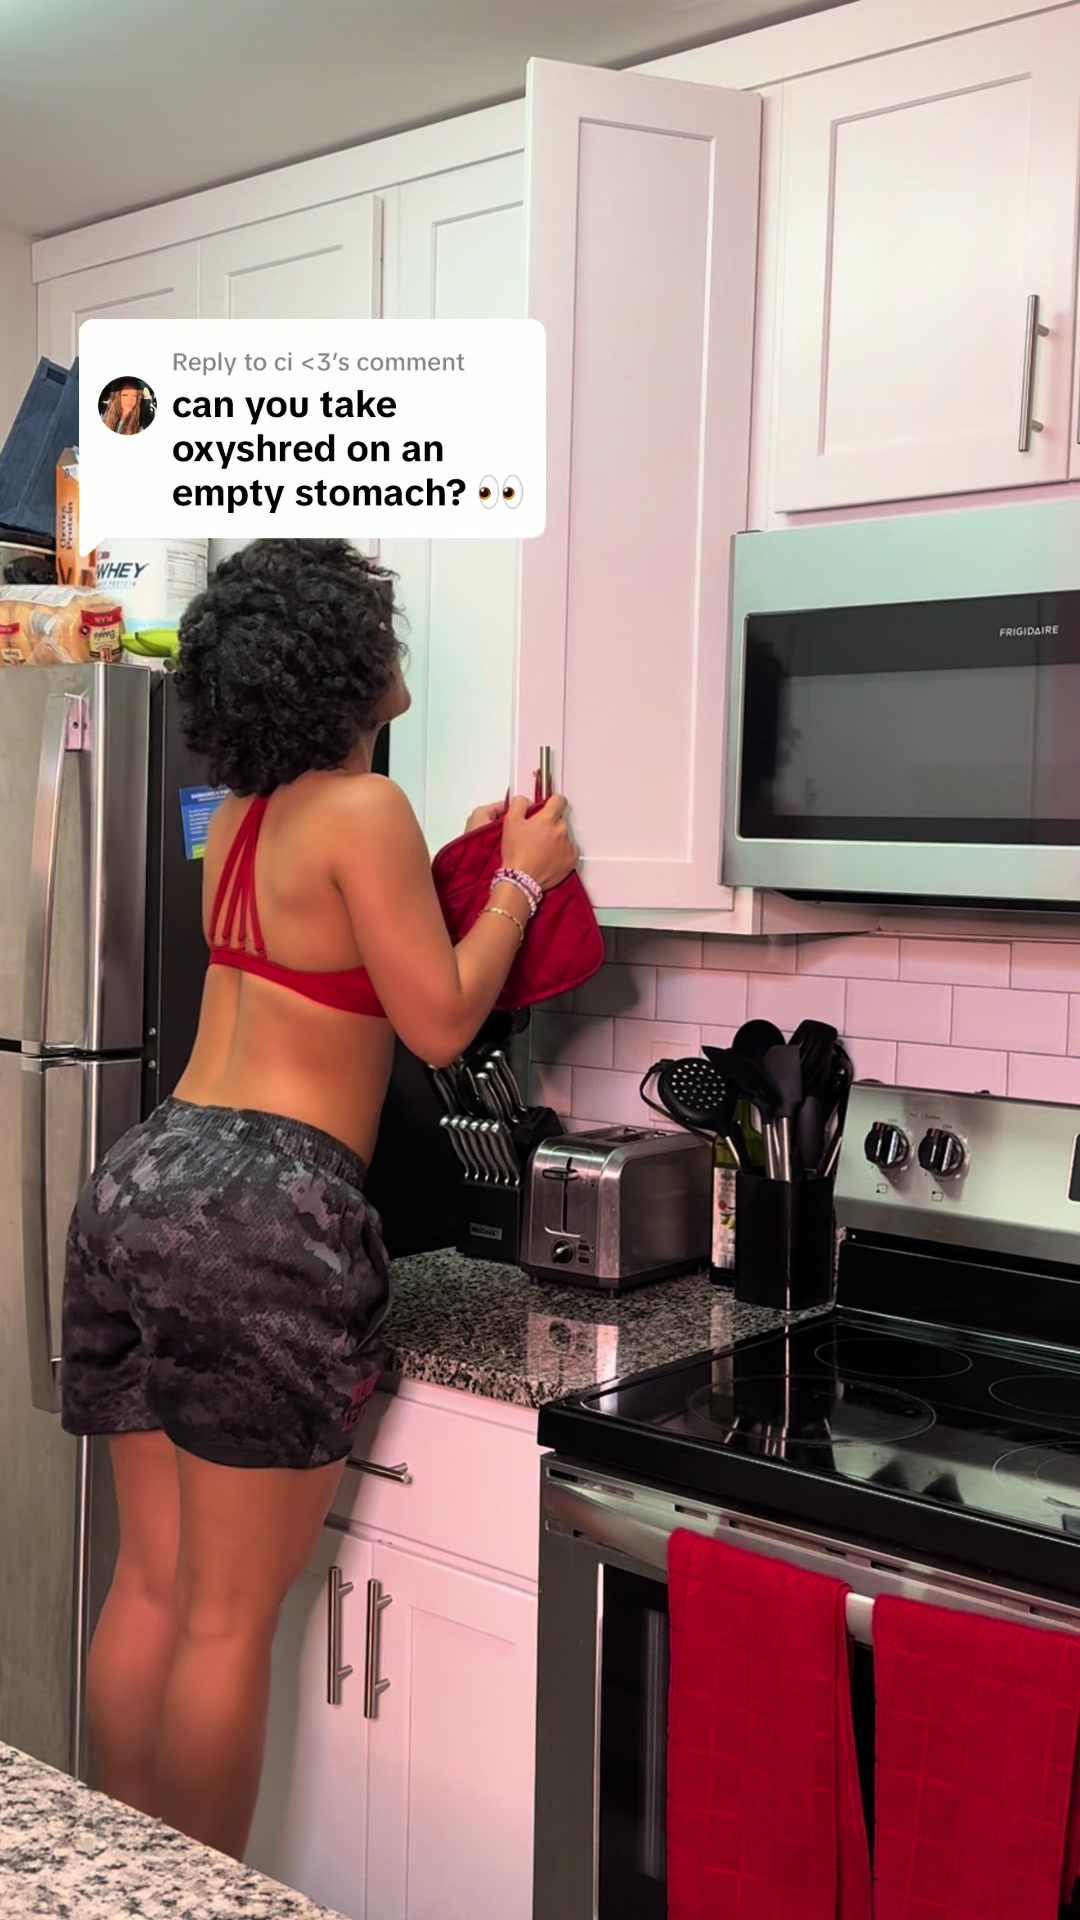
Influencer bio
Trainer & Braider🦋 For the gworls ✨ @Gymshark @ehplabs code TALIYAH 1:1 online coaching, meal plans, workout guides⬇️
Collaboration metrics
Get a free trial to find more data on influencer audiences, performance, and collaborations.
If you break this down further by content type on TikTok, this is what it looks like:
- Videos: 96.6%
- Carousels: 3.4%
💡 Related resource: How To Find TikTok Influencers.
Influencer audience size breakdown (by views)
For their top social platform (TikTok), here is a breakdown of the type of influencers EHPlabs are collaborating with, by audience size.
Note: this breakdown is based on each influencer's average views (not follower/subscriber count), because views typically correlate more closely with influencer pricing and impact.
EHPlabs's influencers average views (TikTok)
Based on each influencer's average views per post
With 38.7% of partnerships featuring creators averaging 1K-5K views, EHPlabs's strategy suggests niche targeting and authenticity, likely leveraging collaboration models like gifting and affiliates to work with smaller creators. The <1K views segment is also prominent at 29.5%, indicating investment across adjacent tiers.
Here is an example of a sponsored collaboration with a larger-audience creator on TikTok (1.3M avg views/post):
maddyrazza x EHPlabs
![TikTok post by @maddyrazza for EHPlabs. Caption reads: [...] 👀#oxyshredbiggercan @OxyShred Energy....](https://images.od.modash.io/24f328a192c8ea57709e936eeb9286a66d392c0a)
Influencer bio
A girl doing both 🏃🏽♀️🏋🏽♀️ IG: maddyranzolin 📧 maddyrazza@icloud.com
Collaboration metrics
Get a free trial to find more data on influencer audiences, performance, and collaborations.
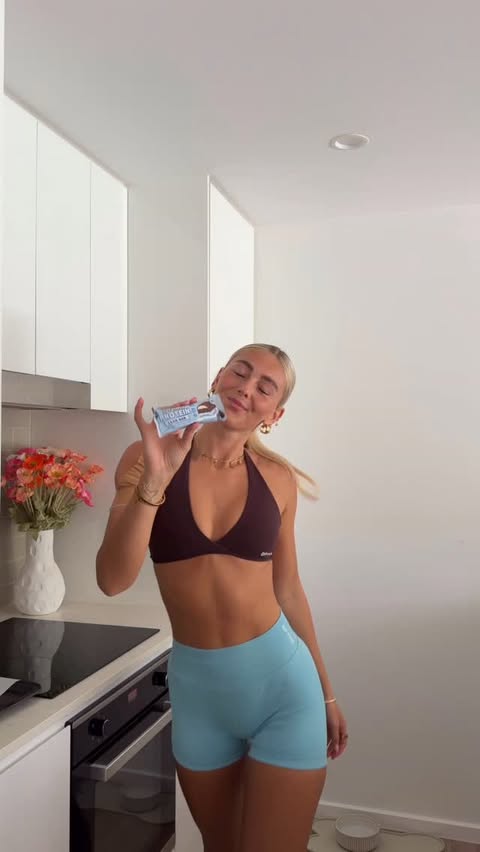
And here is another example with a smaller creator on TikTok (9.5k avg views/post):
honeymai.xxx x EHPlabs
Influencer bio
Bit of this🤱🏼🦕🪐bit of that💅🏻👩⚕️✨ life in my 20's x 💌holly6860@gmail.com
Collaboration metrics
Get a free trial to find more data on influencer audiences, performance, and collaborations.
EHPlabs's repeat partnerships
Out of 2.9k unique influencers in our dataset, 458 of them (16%) posted content for EHPlabs in 3 or more separate calendar months. The most consistent partner is @lexbulll, who has collaborated across 12 months with 50 total posts.
Here are 3 examples of EHPlabs's repeat influencer partnerships, with links to the sponsored content.
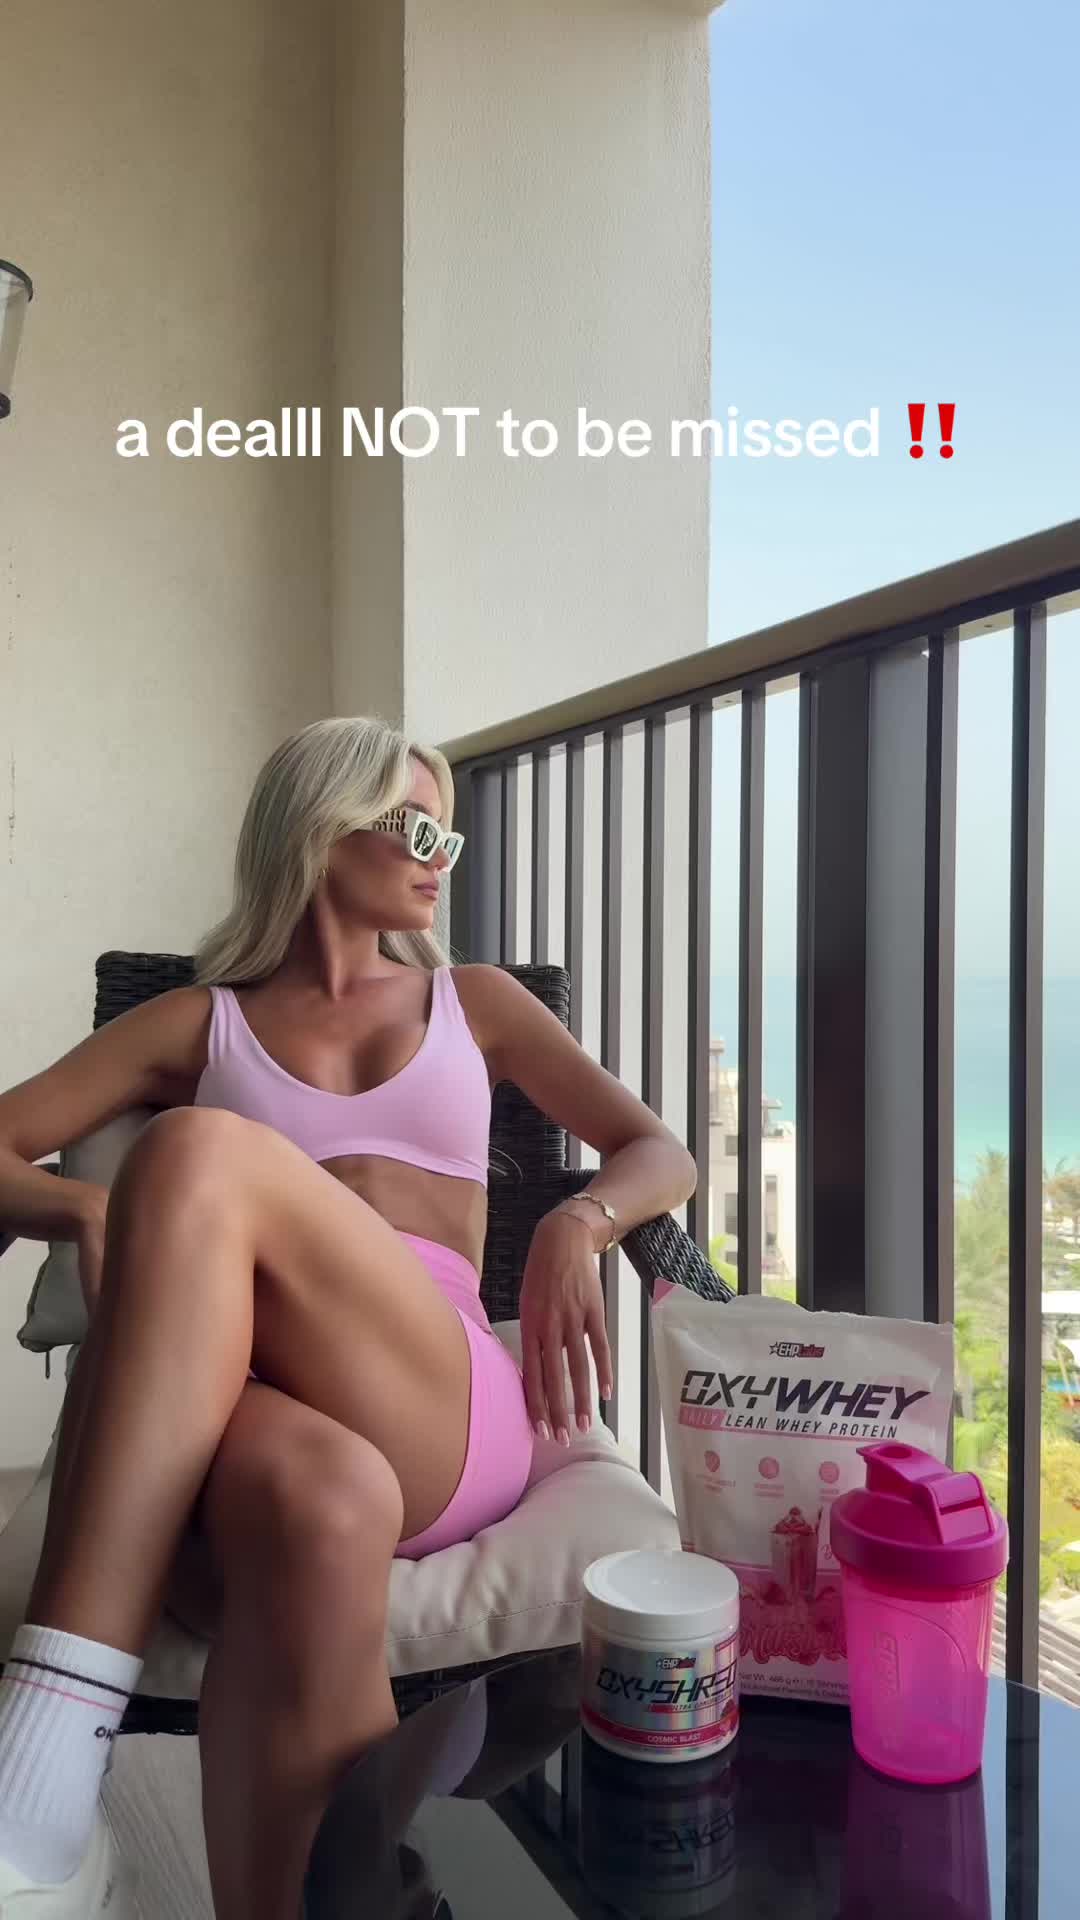
lexbulll x EHPlabs
![Instagram post by @lexbulll for EHPlabs. Caption reads: [...] Supplements from @oxyshred @ehplabs_ausnz ......](https://images.od.modash.io/f34158d559f24ba445cb66ea39b12e7390888112)
![Instagram post by @lexbulll for EHPlabs. Caption reads: @ehplabs_ausnz EOFY Sale is still live [...].](https://images.od.modash.io/194e556a41852d0b427d9f3327d59a5d557eaea8)
kelsiefaithhthomas x EHPlabs
![Instagram post by @kelsiefaithhthomas for EHPlabs. Caption reads: [...] • @gymshark code / KELSIE10 @ehplabs_ausnz....](https://images.od.modash.io/4afc2bb3757dc8c52c3068d3648e4326347c9202)
![Instagram post by @kelsiefaithhthomas for EHPlabs. Caption reads: [...] your goals a breeze 🤍🎯 @ehplabs code /....](https://images.od.modash.io/e7a6f2d28e49d5ad52b0837cca05a428c2f37cbc)
![Instagram post by @kelsiefaithhthomas for EHPlabs. Caption reads: [...] w/ coconut water All supps @ehplabs_ausnz....](https://images.od.modash.io/ad65ff09da793823566aaa3710eb47b6b57a6281)
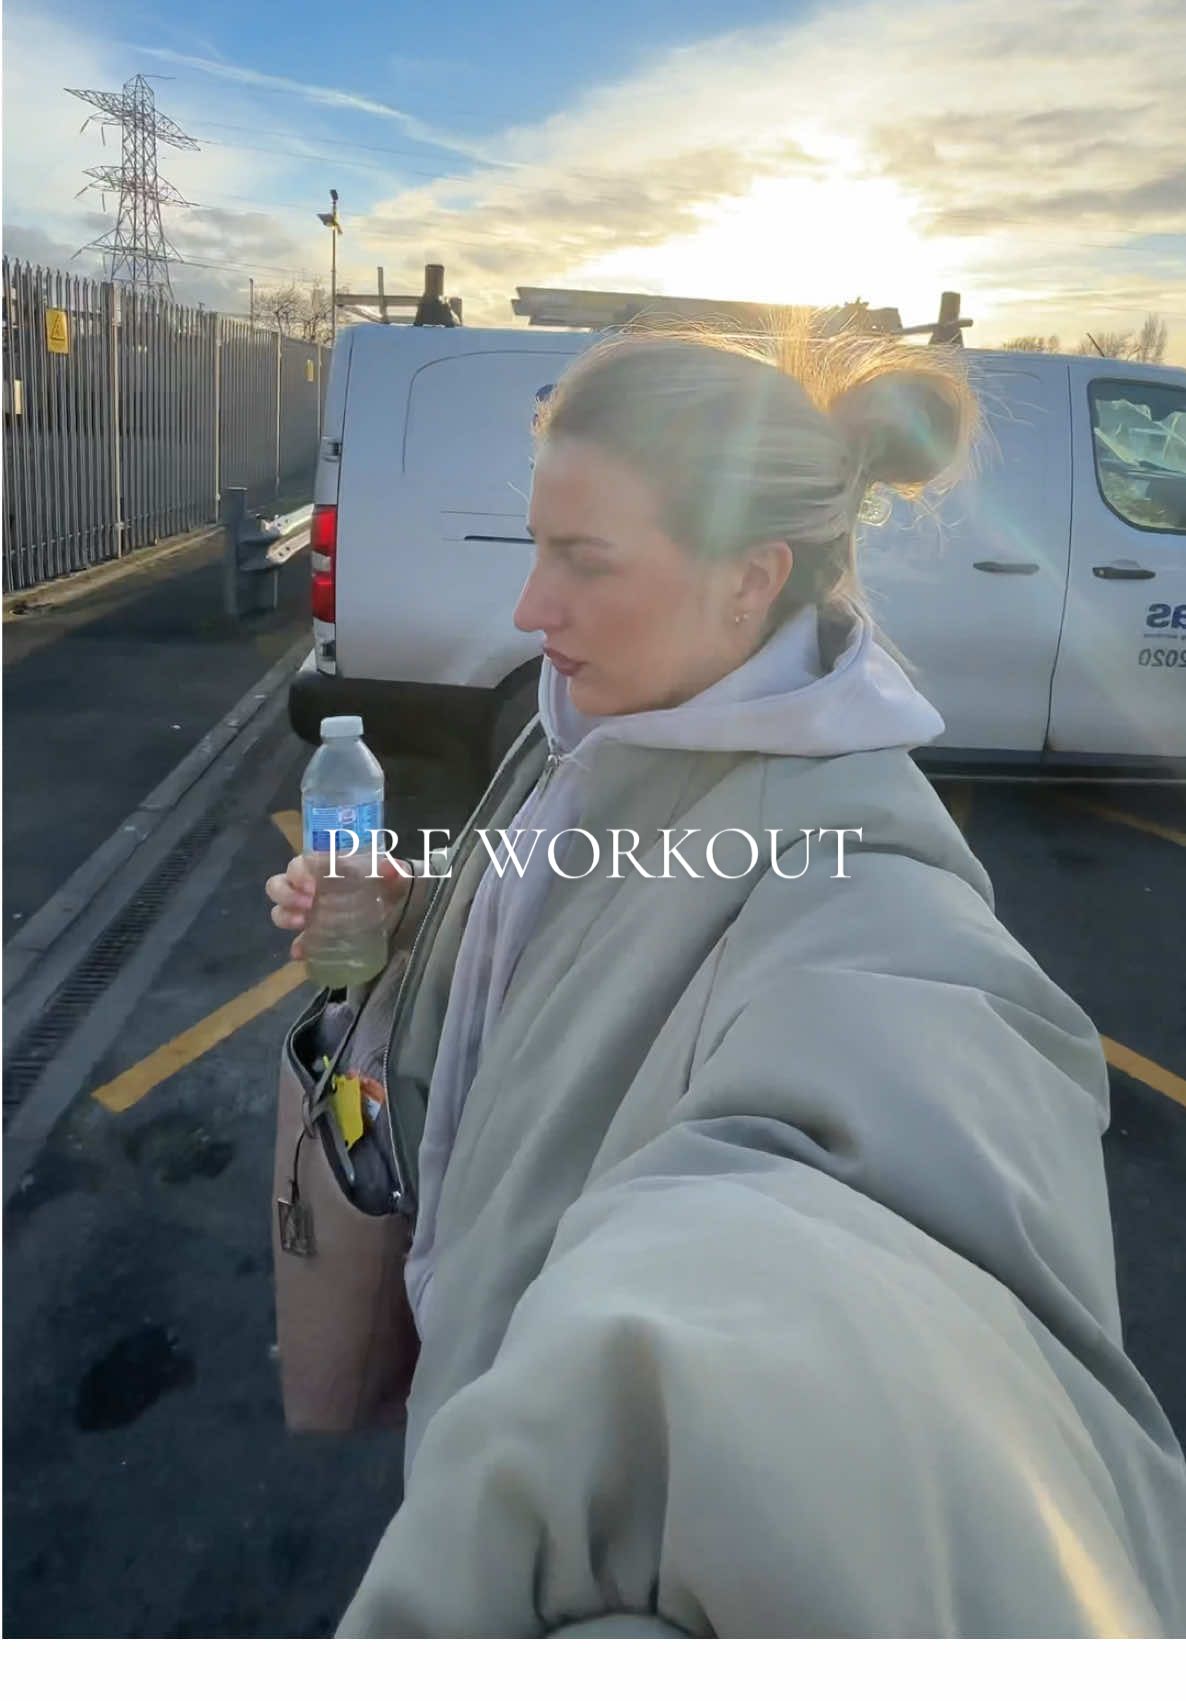
mollysmith19 x EHPlabs
![TikTok post by @mollysmith19 for EHPlabs. Caption reads: [...] well, consistently with @ehplabsuk 🤝🤍 ad....](https://images.od.modash.io/8e8e325b4346a936cb774382b760d49da47c0fbc)
![TikTok post by @mollysmith19 for EHPlabs. Caption reads: [...] + electrolytes done right @ehplabsuk #ad.](https://images.od.modash.io/64392b2d6d4d7994c5869167c5c4ca4d93e8f78f)
💡 Related resource: Long-Term Influencer Partnerships: Pros, Cons & How The Pros Manage Them.
Geographical breakdown
In our dataset, United States is where EHPlabs had the most influencer activity. 48.2% of their live influencer content in the last 12 months was posted by American influencers.
Based on the percentage of influencer content per market, other important markets include:
- Australia (24.1%)
- United Kingdom (7.2%)
- Canada (5.3%)
EHPlabs's influencer activity by market
Here is another example of EHPlabs collaborating with an influencer in United States.
kay_lucia x EHPlabs
![TikTok post by @kay_lucia for EHPlabs. Caption reads: [...] each direction) #gym #glutes #workout....](https://images.od.modash.io/50801fb853c710e03c344940fa92e013092bee4c)
EHPlabs's influencer activity vs. related brands
EHPlabs competes with Women’s Best and 1st Phorm in fitness supplements where community, transformations, and ambassador programs drive customer acquisition. All three rely heavily on fitness creators to validate products and build lifestyle credibility.
Total influencer content
EHPlabs vs. related brands influencer activity
Total sponsored posts tracked (last 12 months)
Women's Best leads with 13.5k sponsored posts, marginally ahead of EHPlabs (13.2k posts) and 1st Phorm (8.4k posts). Across all three brands, the average volume is 11.7k posts, indicating mature, scaled influencer programs.
By social platform
EHPlabs vs. related brands influencer activity (by social platform)
Sponsored posts by platform
EHPlabs leads on TikTok, while Women's Best has the most activity on Instagram and 1st Phorm has the most activity on YouTube. The gap is most notable on TikTok, with EHPlabs at 9.1k, Women's Best at 2.9k, 1st Phorm at 1k posts. Women's Best's activity is particularly concentrated on Instagram. On TikTok, EHPlabs has several times more posts than Women’s Best and 1st Phorm, while on Instagram Women’s Best has several times more posts than EHPlabs.
By geographical market
EHPlabs vs. related brands influencer activity (by country)
Estimated sponsored posts in EHPlabs's top markets
1st Phorm has the highest estimated sponsored-post volume in United States (6.8k posts, 80.9%), Brazil (394 posts, 4.7%), Canada (235 posts, 2.8%), suggesting a North America focus, while EHPlabs leads in Australia with 3.2k posts (24.1%), while Women's Best has the highest estimated sponsored-post volume in United Kingdom (1.9k posts, 14.3%), France (825 posts, 6.1%), suggesting a Europe focus. Looking at United States specifically, the split is 1st Phorm at 6.8k posts (80.9%), Women's Best at 6.4k posts (47.3%), EHPlabs at 6.4k posts (48.2%).
Read more influencer strategy breakdowns
Looking for more like this? Here are 5 similar influencer marketing strategy breakdowns for other brands:
- Women's Best's Influencer Marketing Strategy
- 1st Phorm's Influencer Marketing Strategy
- BLUETTI's Influencer Marketing Strategy
- OH POLLY's Influencer Marketing Strategy
- TATTI LASHES's Influencer Marketing Strategy
Or, if you want to access data like this for your own software or processes, take a look at Modash's API products:
Frequently asked questions
Scaling your influencer program?
When you outgrow your mishmash of spreadsheets & free tools, try Modash. Find & email influencers, track campaigns, ship products & more - all in one place.