The Oodie Influencer Marketing Strategy (2026 Data & Insights)
We analyzed 934 pieces of influencer content sponsored by The Oodie over the last 12 months.
This report breaks down where & how The Oodie invests in influencer marketing, which social platforms they prioritize, top geographical markets, and more.
P.S. for a simple list of influencers who have collaborated with The Oodie, see here: The Oodie influencers.
Influencer activity throughout the year
The Oodie's influencer campaigns are active year-round with notable month-to-month fluctuation. The chart below shows month-by-month data for total sponsored posts tracked.
powered by
The Oodie's influencer activity by month
Number of sponsored posts
The Oodie's sponsored post volume appears to trend upward over the 12-month period, rising from 44 posts in January to 80 in December. The peak month, October, reached 184 posts, 136% higher than the monthly average of 78.
Social platforms breakdown
In our dataset (which only includes Instagram, YouTube, and TikTok), this is how the volume of The Oodie's sponsored influencer collaborations break down by social platform:
For their top social platform (Instagram), here is a breakdown of the type of influencers The Oodie are collaborating with, by audience size.
Note: this breakdown is based on each influencer's average views (not follower/subscriber count), because views typically correlate more closely with influencer pricing and impact.
powered by
The Oodie's influencers average views (Instagram)
Based on each influencer's average views per post
<1K21.6%
1K-5K41.7%
5K-10K16.2%
10K-50K16.2%
50K-100K2.9%
100K-500K1.0%
500K+0.5%
With 41.7% of partnerships featuring creators averaging 1K-5K views, The Oodie's strategy suggests niche targeting and authenticity, likely leveraging collaboration models like gifting and affiliates to work with smaller creators.
Here is an example of a sponsored collaboration with a larger-audience creator on Instagram (10.2k avg views/post):
kostagenaris x The Oodie
kostagenaris
@kostagenaris
01 Dec, 25
11.7k
231
[...] discount or follow link in bio #theoodie #oodie #australia
Influencer bio
Lifestyle, Pop culture, Dad Life
Tiktok: 215k+ | YT: 50k+
Australia 🇦🇺
Brand @worstgenco_
M: genarisk@gmail.com
Collaboration metrics
Post views11.7k
Post EMV $374
Get a free trial to find more data on influencer audiences, performance, and collaborations.
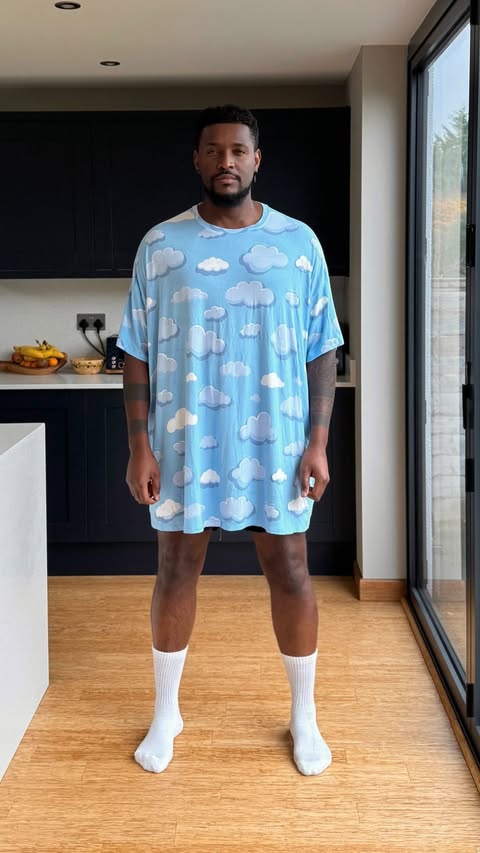
And here is another example with a smaller creator on Instagram (9.2k avg views/post):
rachelfionag x The Oodie
rachelfionag
@rachelfionag
29 Jul, 25
7.9k
780
@the_oodie Summer Sales are on☀️ #TheOodie #oodiewishlist #summersales #summer [...]
Get a free trial to find more data on influencer audiences, performance, and collaborations.
The Oodie's repeat partnerships
Out of 445 unique influencers in our dataset, 23 of them (5%) posted content for The Oodie in 3 or more separate calendar months. The most consistent partner is @ASMRJADE, who has collaborated across 11 months with 105 total posts. @ASMRJADE alone accounts for 11% of all tracked sponsored content.
Here are 3 examples of The Oodie's repeat influencer partnerships, with links to the sponsored content.
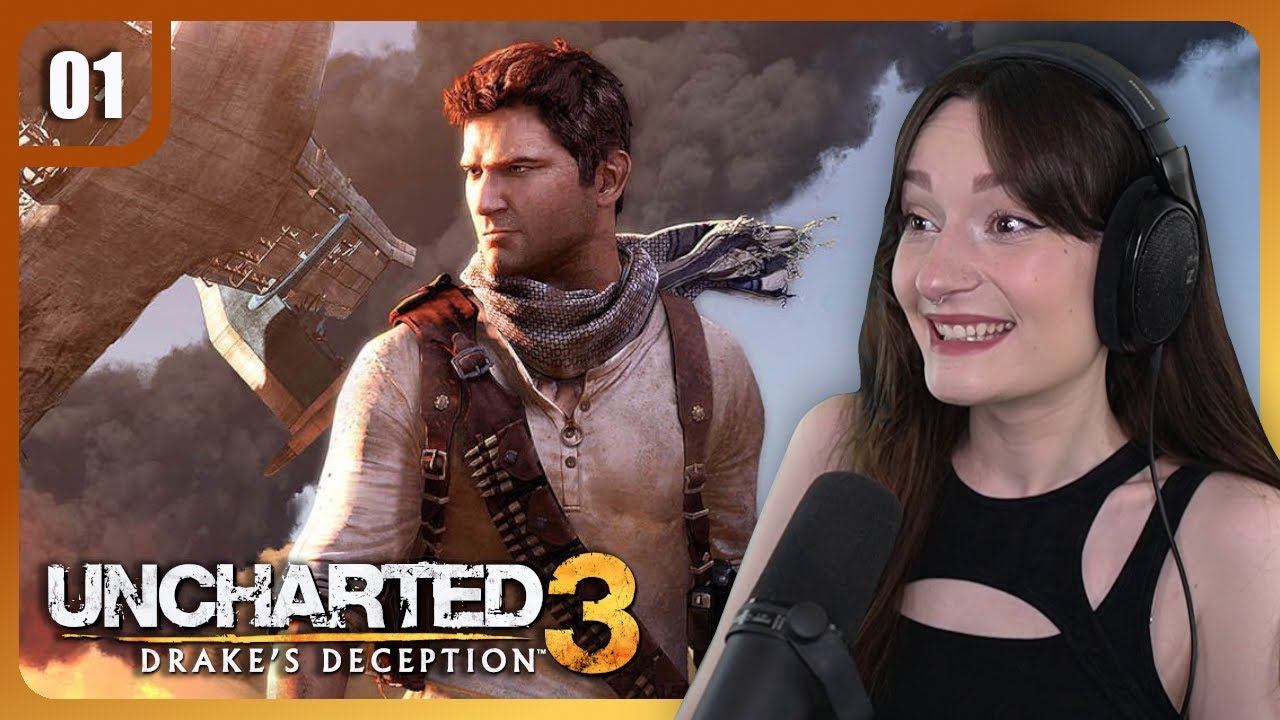
WhimsyPsyche x The Oodie
WhimsyPsyche
@WhimsyPsyche
27 Jul, 25
9k
612
Welcome to my first ever playthrough of Uncharted 3: Drake's Deception! I fell absolutely in love with the first two games, so I'm very excited to continue playing this franchise! This will be a thorough playthrough (pre-recorded, not streamed) with lots of talks about the characters and what I think of them, my own theories on the story and so on, so if you're interested in that, subscribe for more and like the videos if you enjoy! It helps a lot with growing the channel ❤️ Uncharted: Drake's Fortune first playthrough → • UNCHARTED: DRAKE'S FORTUNE Uncharted 2: Among Thieves → • UNCHARTED 2: AMONG THIEVES Chapters 0:00 intro 2:30 game starts 9:00 Chapter 1: Another Round 16:02 Chapter 2: Greatness from Small Beginnings 32:51 Chapter 3: Second-Story Work 47:35 Chapter 4: Run to Ground 1:07:38 Chapter 5: London Underground 1:08:06 thoughts & outro Edited by Eric from @EricSarahLevelUp MY OTHER CHANNELS: ✫ Past Streams Channel → / @whimsicalarchive ✫ Movies & TV Series Reaction Channel → / @whimcinema ________________________________________________________________ | SOCIALS | 🌳 Linktree → 💜 Twitch → / whimsypsyche 📸 Instagram → / whimsy.psyche 💬 Discord → / discord 👀 TikTok → / whimsypsyche 🐦 Twitter → / whimsypsyche 🎁 Throne wishlist → 💲 If you want to financially support me directly → | DON’T BE SHY! | ❤️ Subscribe, like and/or comment! I love responding to comments! 📍 Get 24h early access on ALL videos (except Premieres) and unlock fun emotes and other perks here: / @whimsypsyche Note: be careful to choose the appropriate tier for what you want, read the perks carefully! 💫SHOUT-OUT TO THE MEMBERSHIP FAM💫 Thank you so much to all the members financially supporting the channel! There are so many of you now that it's impossible for me to name you all in the description box, which is crazy! I'm very grateful 🥰 | PARTNERSHIPS | HexGaming : Looking for a new custom controller? HexGaming lets you customize everything from the look to the buttons you can use! Get one here and use code WHIMSY at checkout for 10% off your order 🎮 I have two: a PS5 Phantom in 'vision white' with hall effect, and a PS5 Rival controller with the 'chameleon purple blue' color and I love them so much! FiGGYZ : If you like collectibles, I highly suggest looking into FiGGYZ magnetic pixel art! They have characters from various gaming franchises including Metal Gear Solid, Street Fighter, Sonic, Castlevania, and so many more! These premium collectibles are beyond cute, and won't take much shelf space. Get yours here and use my code WHIMSYPSYCHE at checkout for 5% off your order of over 50$! Oodie : Interested in the most comfortable piece of clothing you'll ever own? Oodie makes a hybrid between a oversized hoodie and a blanket. You can get yours here and use code WHIMSYPSYCHE at checkout for 35$/€ off your order! | WHAT I USED TO MAKE THIS VIDEO | Headphones → Camera → Lens → Camera capture device → Mic → with and Lights → + (front), and two soft boxes by Neewer (for the green screen if used) Gaming chair → Secretlab Titan Evo 2022 Game capture card → Green screen → Recording software → OBS studio Editing software → Davinci Resolve ________________________________ Intro video based on: cottonbro from Pexels Outro video based on: StockSnap from Pixabay #firstplaythrough #letsplay #uncharted #uncharted3 #drakesdeception #playstation
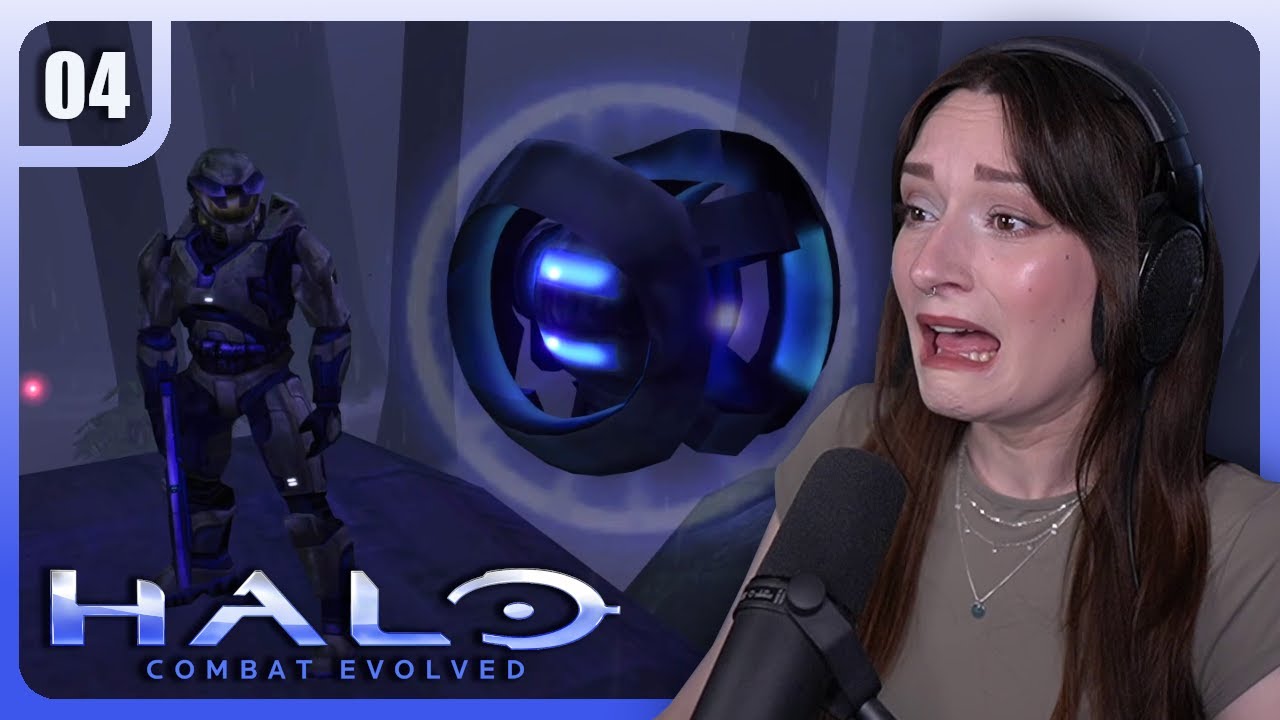
WhimsyPsyche
@WhimsyPsyche
25 Jul, 25
8.8k
612
Welcome to my first playthrough of Halo: Combat Evolved! This will be a thorough playthrough with a focus on the lore, the characters, my own theories on the story and so on, so if you're interested in that, subscribe for more and like the videos if you enjoy! It helps a lot with growing the channel 💚 Chapters 0:00 intro 3:07 Terminal 5 5:45 thoughts/theories 7:20 Mission 6: 343 Guilty Spark 55:55 thoughts & outro Edited by Eric from @EricSarahLevelUp MY OTHER CHANNELS: ✫ Past Streams Channel → / @whimsicalarchive ✫ Movies & TV Series Reaction Channel → / @whimcinema ________________________________________________________________ | SOCIALS | 🌳 Linktree → 💜 Twitch → / whimsypsyche 📸 Instagram → / whimsy.psyche 💬 Discord → / discord 👀 TikTok → / whimsypsyche 🐦 Twitter → / whimsypsyche 🎁 Throne wishlist → 💲 If you want to financially support me directly → | DON’T BE SHY! | ❤️ Subscribe, like and/or comment! I love responding to comments! 📍 Get 24h early access on ALL videos (except Premieres) and unlock fun emotes and other perks here: / @whimsypsyche Note: be careful to choose the appropriate tier for what you want, read the perks carefully! 💫SHOUT-OUT TO THE MEMBERSHIP FAM💫 Thank you so much to all the members financially supporting the channel! There are so many of you now that it's impossible for me to name you all in the description box, which is crazy! I'm very grateful 🥰 | PARTNERSHIPS | HexGaming : Looking for a new custom controller? HexGaming lets you customize everything from the look to the buttons you can use! Get one here and use code WHIMSY at checkout for 10% off your order 🎮 I have two: a PS5 Phantom in 'vision white' with hall effect, and a PS5 Rival controller with the 'chameleon purple blue' color and I love them so much! FiGGYZ : If you like collectibles, I highly suggest looking into FiGGYZ magnetic pixel art! They have characters from various gaming franchises including Metal Gear Solid, Street Fighter, Sonic, Castlevania, and so many more! These premium collectibles are beyond cute, and won't take much shelf space. Get yours here and use my code WHIMSYPSYCHE at checkout for 5% off your order of over 50$! Oodie : Interested in the most comfortable piece of clothing you'll ever own? Oodie makes a hybrid between a oversized hoodie and a blanket. You can get yours here and use code WHIMSYPSYCHE at checkout for 35$/€ off your order! | WHAT I USED TO MAKE THIS VIDEO | Headphones → Camera → Lens → Camera capture device → Mic → with and Lights → + (front), and two soft boxes by Neewer (for the green screen if used) Gaming chair → Secretlab Titan Evo 2022 Game capture card → Green screen → Recording software → OBS studio Editing software → Davinci Resolve ________________________________ Intro video based on: cottonbro from Pexels Outro video based on: StockSnap from Pixabay #firstplaythrough #letsplay #halo #halo1 #combatevolved #halocombatevolved #masterchiefcollection
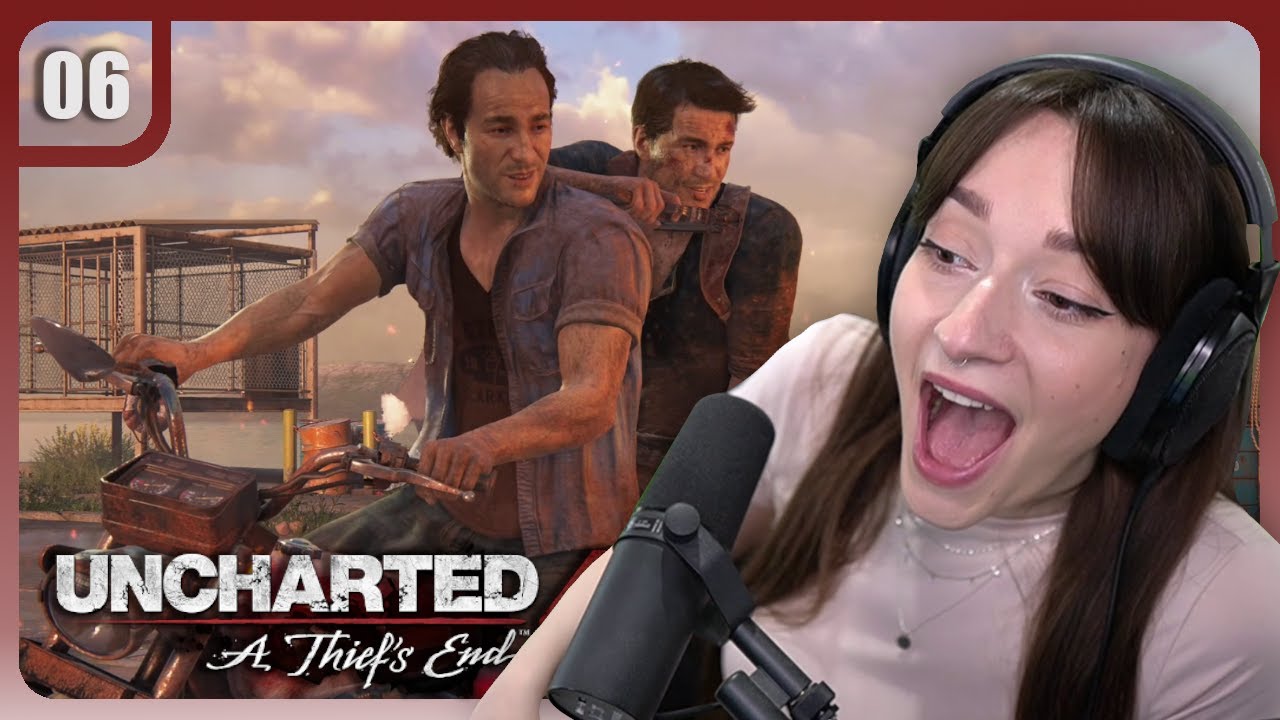
WhimsyPsyche
@WhimsyPsyche
16 Sep, 25
8.7k
474
Welcome to my first ever playthrough of Uncharted 4: A Thief's End! I fell absolutely in love with the first three games, so I'm very excited to continue playing this franchise! This will be a thorough playthrough (pre-recorded, not streamed) with lots of talks about the characters and what I think of them, my own theories on the story and so on, so if you're interested in that, subscribe for more and like the videos if you enjoy! It helps a lot with growing the channel ❤️ Uncharted: Drake's Fortune first playthrough → • UNCHARTED: DRAKE'S FORTUNE Uncharted 2: Among Thieves → • UNCHARTED 2: AMONG THIEVES Uncharted 3: Drake's Deception → • UNCHARTED 3: DRAKE'S DECEPTION Chapters 0:00 intro 0:51 Chapter 10: The Twelve Towers 51:58 Chapter 11: Hidden in Plain Sight 2:02:31 Chapter 12: At Sea 2:04:59 thoughts & outro Edited by Eric from @EricSarahLevelUp MY OTHER CHANNELS: ✫ Past Streams Channel → / @whimsicalarchive ✫ Movies & TV Series Reaction Channel → / @whimcinema ________________________________________________________________ | SOCIALS | 🌳 Linktree → 💜 Twitch → / whimsypsyche 📸 Instagram → / whimsy.psyche 💬 Discord → / discord 👀 TikTok → / whimsypsyche 🐦 Twitter → / whimsypsyche 🎁 Throne wishlist → 💲 If you want to financially support me directly → | DON’T BE SHY! | ❤️ Subscribe, like and/or comment! I love responding to comments! 📍 Get 24h early access on ALL videos (except Premieres) and unlock fun emotes and other perks here: / @whimsypsyche Note: be careful to choose the appropriate tier for what you want, read the perks carefully! 💫SHOUT-OUT TO THE MEMBERSHIP FAM💫 Thank you so much to all the members financially supporting the channel! There are so many of you now that it's impossible for me to name you all in the description box, which is crazy! I'm very grateful 🥰 | PARTNERSHIPS | HexGaming : Looking for a new custom controller? HexGaming lets you customize everything from the look to the buttons you can use! Get one here and use code WHIMSY at checkout for 10% off your order 🎮 I have two: a PS5 Phantom in 'vision white' with hall effect, and a PS5 Rival controller with the 'chameleon purple blue' color and I love them so much! FiGGYZ : If you like collectibles, I highly suggest looking into FiGGYZ magnetic pixel art! They have characters from various gaming franchises including Metal Gear Solid, Street Fighter, Sonic, Castlevania, and so many more! These premium collectibles are beyond cute, and won't take much shelf space. Get yours here and use my code WHIMSYPSYCHE at checkout for 5% off your order of over 50$! Oodie : Interested in the most comfortable piece of clothing you'll ever own? Oodie makes a hybrid between a oversized hoodie and a blanket. You can get yours here and use code WHIMSYPSYCHE at checkout for 35$/€ off your order! | WHAT I USED TO MAKE THIS VIDEO | Headphones → Camera → Lens → Camera capture device → Mic → with and Lights → + (front), and two soft boxes by Neewer (for the green screen if used) Gaming chair → Secretlab Titan Evo 2022 Game capture card → Green screen → Recording software → OBS studio Editing software → Davinci Resolve ________________________________ Intro video based on: cottonbro from Pexels Outro video based on: StockSnap from Pixabay #firstplaythrough #letsplay #uncharted #uncharte43 #athiefsend #playstation
libraryofkate x The Oodie
libraryofkate
@libraryofkate
29 Aug, 25
967
69
[...] LANE / KATE10 for 10% off ○ THE OODIE / LIBRARYOFKATE20 for 15% [...]
libraryofkate
@libraryofkate
20 Sep, 25
724
64
[...] LANE / KATE10 for 10% off ○ THE OODIE / LIBRARYOFKATE20 for 15% [...]
libraryofkate
@libraryofkate
05 Sep, 25
659
59
[...] LANE / KATE10 for 10% off ○ THE OODIE / LIBRARYOFKATE20 for 15% [...]
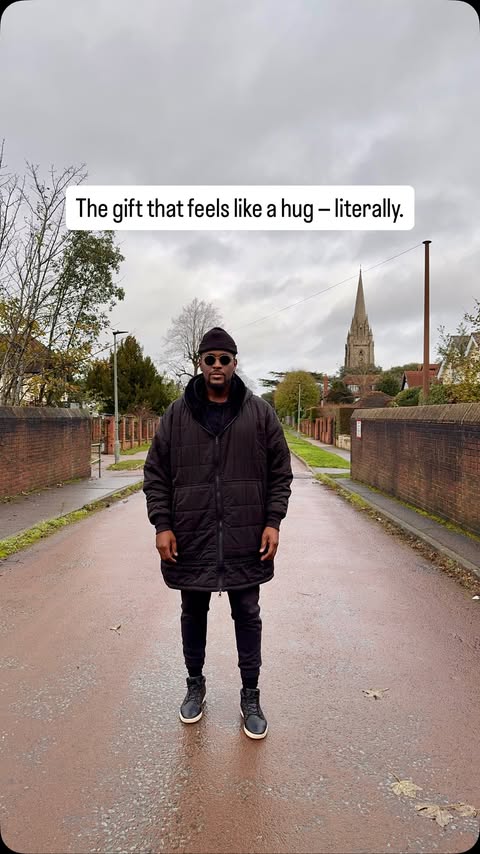
alfredinho.carreira x The Oodie
alfredinho.carreira
@alfredinho.carreira
27 Oct, 25
3.9k
125
Watch until the end 😂😂 🙌🏾 @the_oodie “Get 15% off your order with my code “Carreira3” What are you waiting for? You can look this dope too 🤓🔥🔥 #oodiesquad #oodieuk #oodie #outdoorjacket #premierleague #footballcoach #sundayleaguefootball
alfredinho.carreira
@alfredinho.carreira
03 Dec, 25
1.8k
157
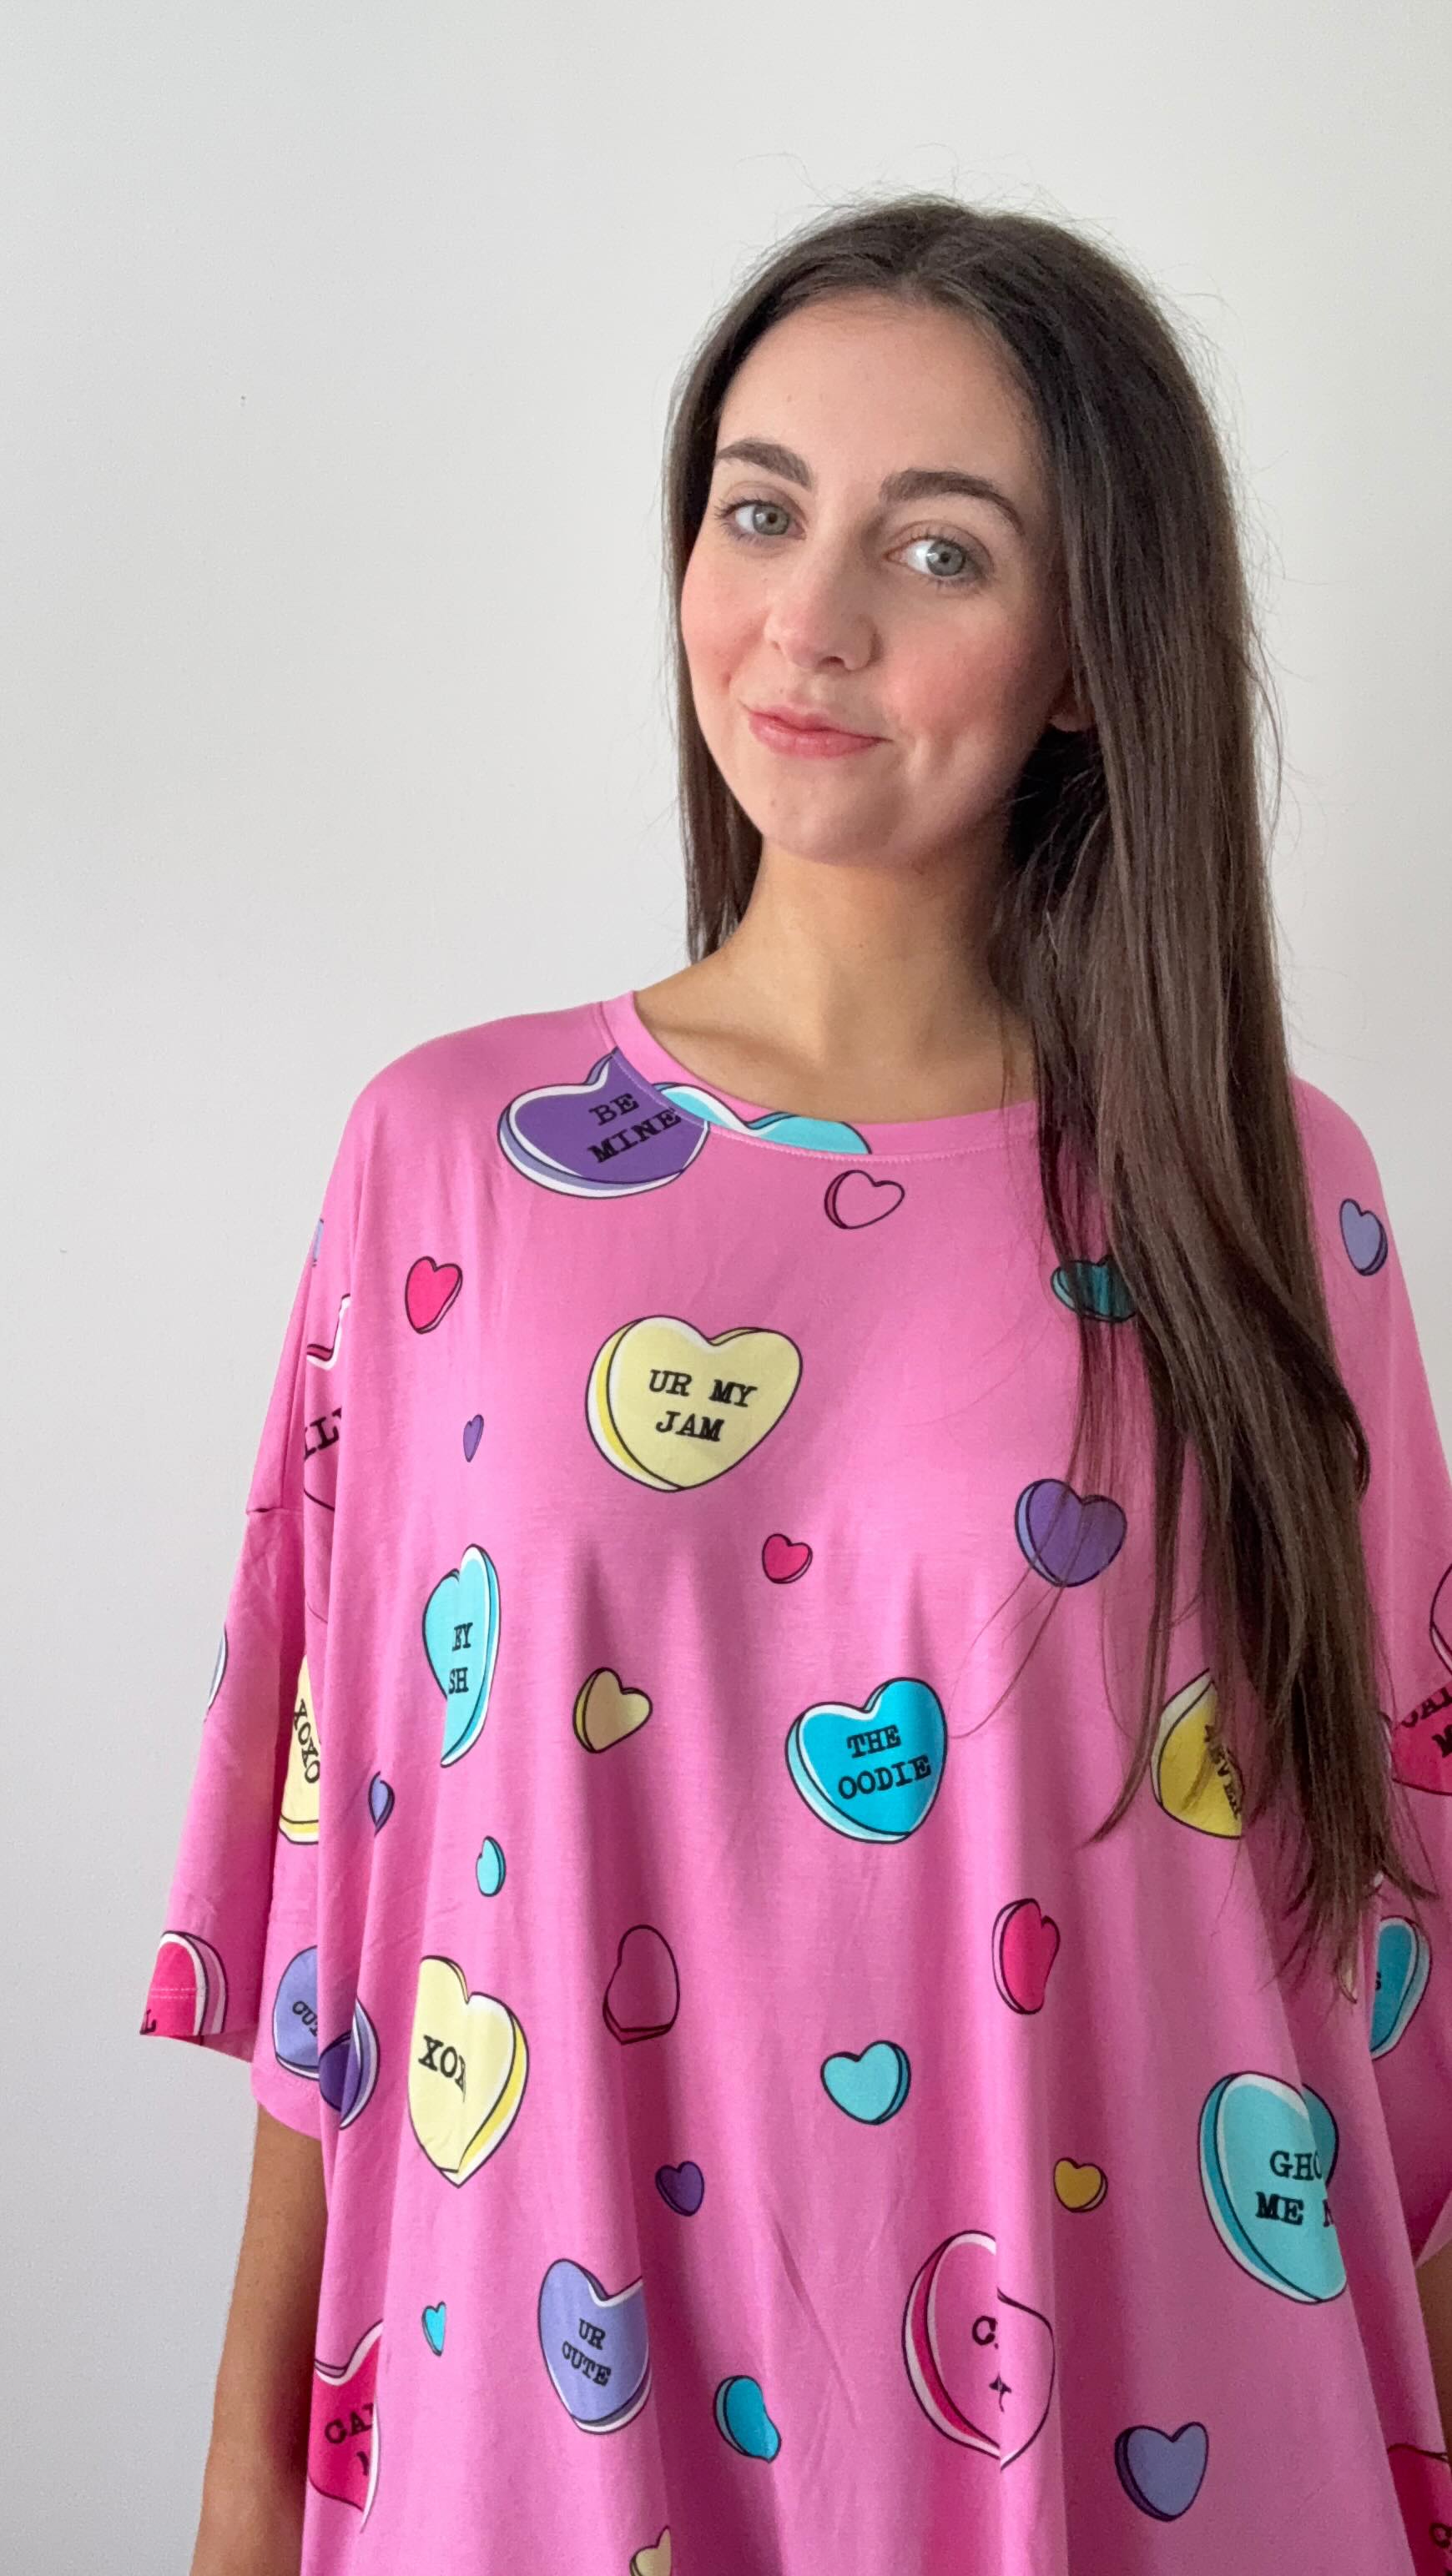
Loving my new Oodie Sleep Tee 🔥 Link 🔗 in my bio, Use my code “Carreira3” @the_oodie #oodie #oodiesquad #perfectpresent #oodiesleeptee #sleeptee #pyjamas #oversizedtees
alfredinho.carreira
@alfredinho.carreira
28 Nov, 25
1.6k
86
“Get 15% off your order with my code “Carreira3” link 🔗 in my bio. @the_oodie What are you waiting for go go go 🔥🔥 #oodiesquad #oodieuk #oodie #outdoorjacket #perfectpresent #blackfridaydeals
In our dataset, United States is where The Oodie had the most influencer activity. 32% of their live influencer content in the last 12 months was posted by American influencers.
Based on the percentage of influencer content per market, other important markets include:
United Kingdom (27.9%)
Australia (20.1%)
Canada (4.2%)
powered by
The Oodie's influencer activity by market
United States32.0%
United Kingdom27.9%
Australia20.1%
Canada4.2%
India3.7%
Other12.1%
Here is another example of The Oodie collaborating with an influencer in Australia.
thepetardimovski x The Oodie
thepetardimovski
@thepetardimovski
26 Jul, 25
42.2k
3k
[...] for %15 on your next purchase at @The Oodie 🛍️ #theoodie #OodieWishlist [...]
The Oodie's influencer activity vs. related brands
The Oodie’s comfortwear niche maps closely to Comfrt’s cozy basics and THE COMMENSE’s casual apparel, all competing for loungewear audiences through “cozy season” and at-home lifestyle creator content.
Total influencer content
powered by
The Oodie vs. related brands influencer activity
Total sponsored posts tracked (last 12 months)
The Oodie
THE COMMENSE
Comfrt
Comfrt leads with 61k sponsored posts, significantly outpacing THE COMMENSE (10.3k posts) and The Oodie (934 posts). Across all three brands, the average volume is 24.1k posts, indicating mature, scaled influencer programs. Comfrt has many more total posts than both The Oodie and THE COMMENSE.
By social platform
powered by
The Oodie vs. related brands influencer activity (by social platform)
Sponsored posts by platform
The Oodie
THE COMMENSE
Comfrt
The Oodie leads on YouTube, while THE COMMENSE has the most activity on Instagram and Comfrt has the most activity on TikTok. The gap is most notable on TikTok, with Comfrt at 59.5k, THE COMMENSE at 1.9k, The Oodie at 244 posts. THE COMMENSE's activity is particularly concentrated on Instagram. On TikTok, Comfrt has far more posts than The Oodie and THE COMMENSE, and on Instagram, THE COMMENSE has far more posts than The Oodie and Comfrt.
By geographical market
powered by
The Oodie vs. related brands influencer activity (by country)
Estimated sponsored posts in The Oodie's top markets
The Oodie
THE COMMENSE
Comfrt
Comfrt has the highest estimated sponsored-post volume in United States (50k posts, 81.6%), Brazil (2.3k posts, 3.8%), Canada (2k posts, 3.2%), suggesting a North America focus, while THE COMMENSE leads in United Kingdom with 691 posts (6.7%), while The Oodie leads in Australia with 188 posts (20.1%). Looking at United States specifically, the split is Comfrt at 50k posts (81.6%), THE COMMENSE at 4.1k posts (39.6%), The Oodie at 299 posts (32%).
Read more influencer strategy breakdowns
Looking for more like this? Here are 5 similar influencer marketing strategy breakdowns for other brands:
The Oodie's top social channel for sponsored influencer content is Instagram (44.8% of their total content). On Instagram, Reels are their most-sponsored format, accounting for the majority of their sponsored Instagram content.
Yes, there are at least some influencer posts sponsored by The Oodie that contain discount codes. Here is one example, where "AMYLIEN" is visible in the caption.
When you outgrow your mishmash of spreadsheets & free tools, try Modash. Find & email influencers, track campaigns, ship products & more - all in one place.
![Instagram post by @tianaawadsworthh for The Oodie. Caption reads: [...] winter 🥰🥰 DISCOUNT CODE: TIANA20 #theoodie....](https://images.od.modash.io/28f5866a790a64f5cf86db0b26bec0ddb72ee439)
![TikTok post by @dhen.mua for The Oodie. Caption reads: [...] “DANIELLE41670”. Always been a fan of @The....](https://images.od.modash.io/0ce51a22353c0eb0943ac323970a92ebb3cca200)
![YouTube post by @JBroAlsoDraws for The Oodie. Caption reads: [...] Link: respawnproducts.sjv.io/mOZAjX ✨The....](https://images.od.modash.io/299ed4f4308d2b7ad25ecdf068aa103ef1bcdd31)
![Instagram post by @kostagenaris for The Oodie. Caption reads: [...] discount or follow link in bio #theoodie....](https://images.od.modash.io/47af39d1ed2d758e29c95a32884f4112e5dd4604)
![YouTube post by @libraryofkate for The Oodie. Caption reads: [...] LANE / KATE10 for 10% off ○ THE OODIE /....](https://images.od.modash.io/d3a63f1492e74fce03c9464cfd10b51cd069bfe4)
![YouTube post by @libraryofkate for The Oodie. Caption reads: [...] LANE / KATE10 for 10% off ○ THE OODIE /....](https://images.od.modash.io/b197b17866811df7c99e9cb4b9d427e5b327aa8e)
![YouTube post by @libraryofkate for The Oodie. Caption reads: [...] LANE / KATE10 for 10% off ○ THE OODIE /....](https://images.od.modash.io/6f36bbcf81a386be034d33f0476537dbf4cc04be)

![TikTok post by @thepetardimovski for The Oodie. Caption reads: [...] for %15 on your next purchase at @The Oodie....](https://images.od.modash.io/c9cd5a16736d59a367e068eaeb5a06477aeb7952)