Native Influencer Marketing Strategy
(2026 Data & Insights)
We analyzed 6.2k pieces of influencer content sponsored by Native over the last 12 months.
This report breaks down where & how Native invests in influencer marketing, which social platforms they prioritize, top geographical markets, and more.
The data in this report comes from Modash's Brand Collaborations API.
P.S. for a simple list of influencers who have collaborated with Native, see here: Native influencers.
Influencer activity throughout the year
Native's influencer marketing output shows strong seasonal variation, with some months seeing 3x or more activity than others. The chart below shows month-by-month data for total sponsored posts tracked.
Native's influencer activity by month
Number of sponsored posts
Native's influencer activity appears to have tapered over the year, from 203 posts in January down to 270 in December. April was the busiest month at 1.9k posts, 259% above the monthly average.
Social platforms breakdown
In our dataset (which only includes Instagram, YouTube, and TikTok), this is how the volume of Native's sponsored influencer collaborations break down by social platform:
- TikTok: 6.2k posts (99.7%)
- YouTube: 18 posts (0.3%)
Native's influencer activity by platform
Share of sponsored content by social network
TikTok influencer marketing is a clear focus for Native.
Here are 2 examples of Native's recent sponsored collaborations (one each for TikTok, YouTube).
kiraelon x Native
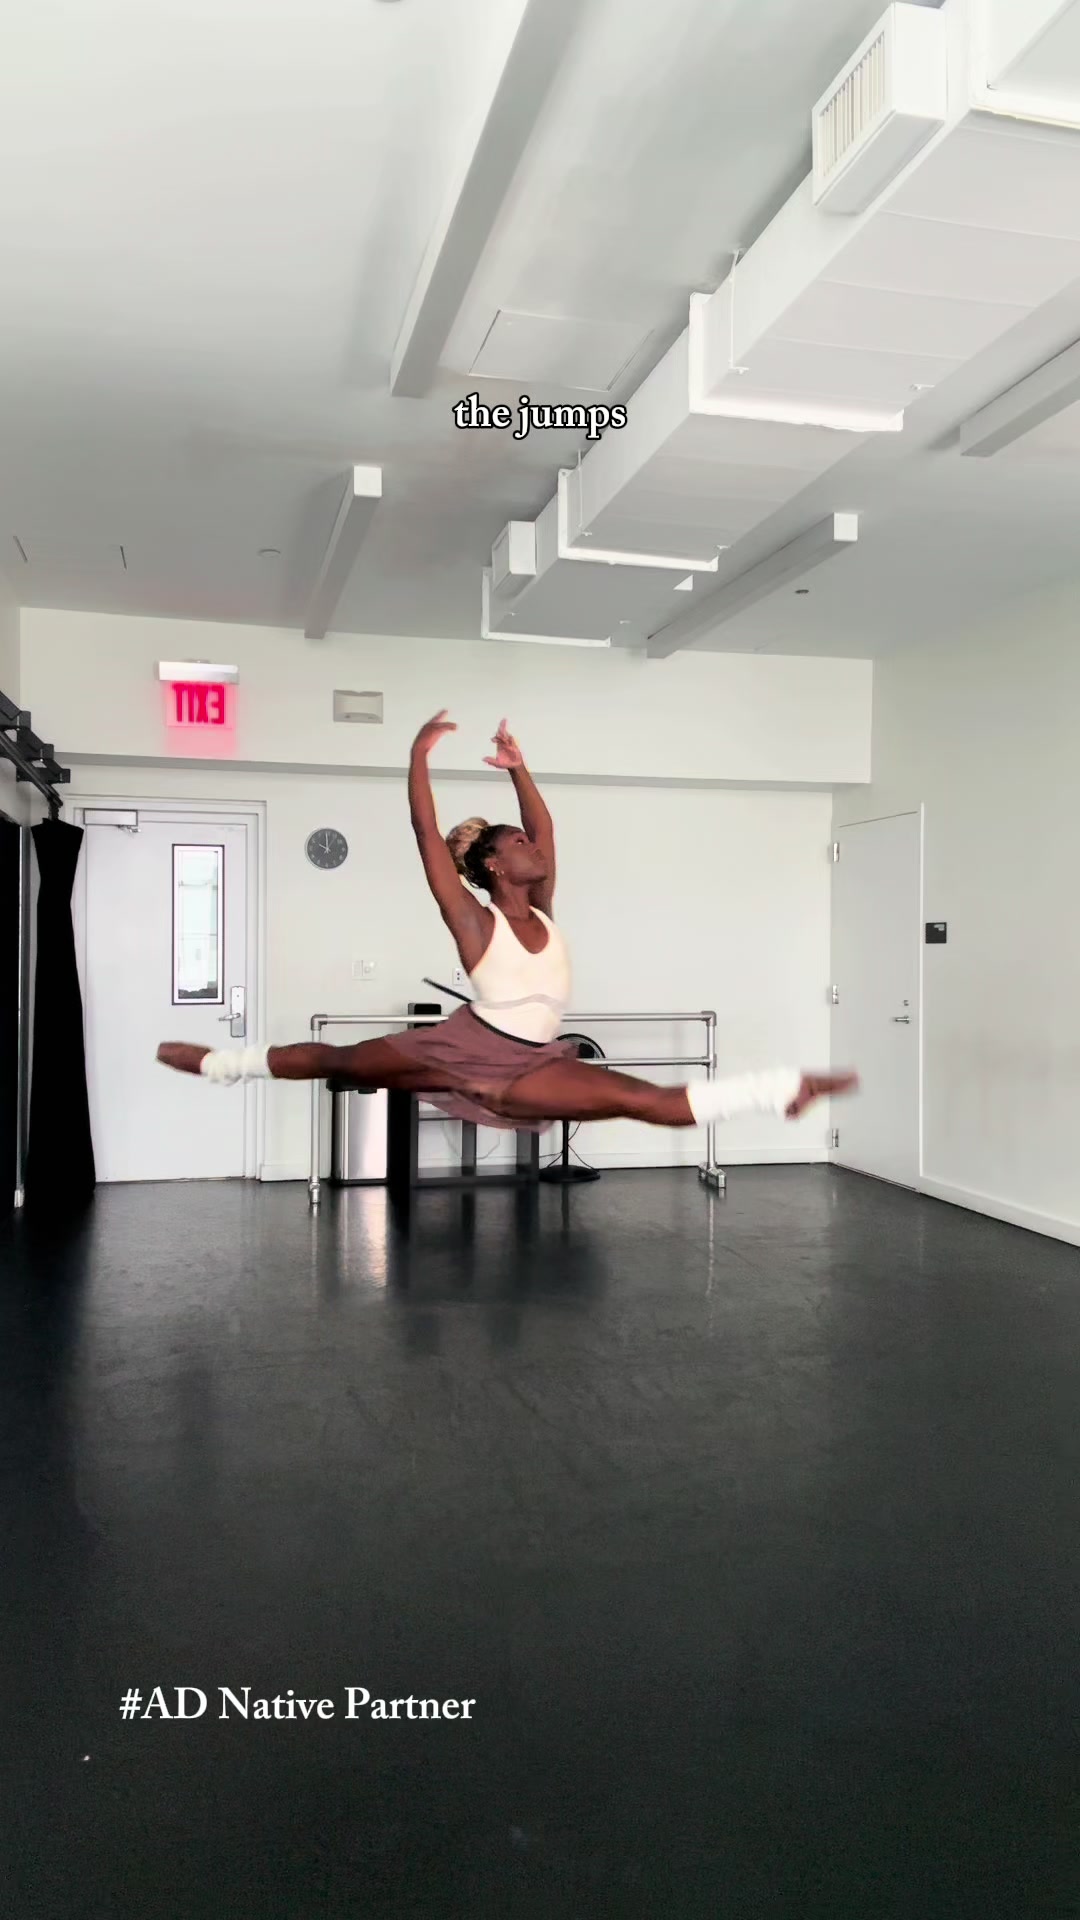
Influencer bio
black ballerina/content creator bride to be 💍 || 1908 💕💚 💌kira@a-listme.com
Collaboration metrics
Get a free trial to find more data on influencer audiences, performance, and collaborations.
MichelleKhare x Native
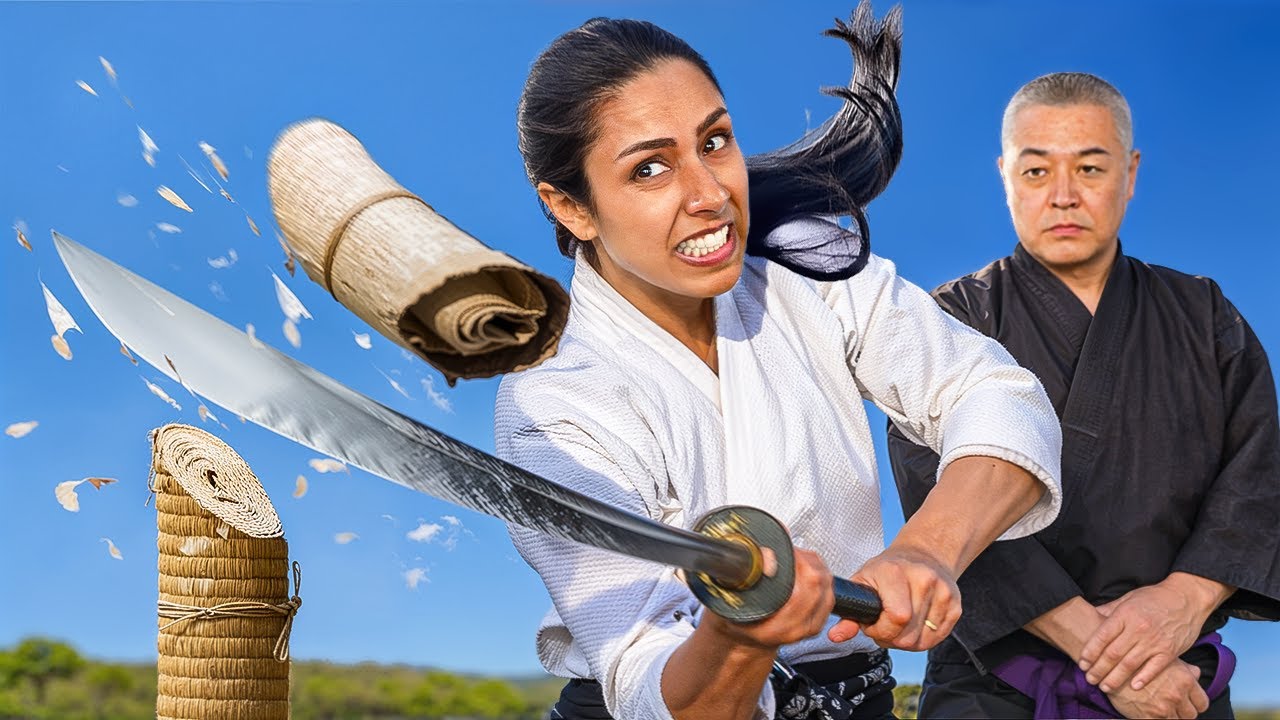
Influencer bio
YouTube's Daredevil 😈 For business Inquiries: michellekhare+business@gmail.com Challenge Accepted follows Michelle Khare as she attempts the world's most difficult lifestyles, stunts, and professions. AWARDS: 2023 Streamy WINNER - Show of the Year - Challenge Accepted 2022 Streamy WINNER - Best Unscripted Series - Challenge Accepted 2022 Streamy Nominee - Show of The Year 2019 Shorty Nominee - Creator of The Year REPRESENTATION: Gersh - Keith Bielory PUBLICITY: imPRint - Emily Rennert, Lauren Denker SPEAKING ENGAGEMENTS: Lavin - Charles Yao
Collaboration metrics
Get a free trial to find more data on influencer audiences, performance, and collaborations.
If you break this down further by content type on TikTok, this is what it looks like:
- Videos: 96.4%
- Carousels: 3.6%
💡 Related resource: How To Find TikTok Influencers.
Influencer audience size breakdown (by views)
For their top social platform (TikTok), here is a breakdown of the type of influencers Native are collaborating with, by audience size.
Note: this breakdown is based on each influencer's average views (not follower/subscriber count), because views typically correlate more closely with influencer pricing and impact.
Native's influencers average views (TikTok)
Based on each influencer's average views per post
With 78% of partnerships featuring creators averaging <1K views, Native's strategy suggests niche targeting and authenticity, likely leveraging collaboration models like gifting and affiliates to work with smaller creators.
Here is an example of a sponsored collaboration with a larger-audience creator on TikTok (11.7M avg views/post):
katie.duarte x Native
![TikTok post by @katie.duarte for Native. Caption reads: [...] was going from an antiperspirant to the....](https://images.od.modash.io/2c114c5dc275f4040afcb4affde294ea7a1a3019)
Influencer bio
🍓mum of 2 life & healthy family food🍓 📍London 💌 katieduarte@thestand.agency
Collaboration metrics
Get a free trial to find more data on influencer audiences, performance, and collaborations.
And here is another example with a smaller creator on TikTok (9.1k avg views/post):
pippa_the_prius x Native
![TikTok post by @pippa_the_prius for Native. Caption reads: [...] though lol) #complimentary #GiftedByNative....](https://images.od.modash.io/3a747a3e4f15e6d844e3641c0b4290780ac66550)
Influencer bio
Luthier + Artist 📍Nashville bus ✉️ pipbuilds308@gmail.com 🎸23🎸 insta@/pippa_prius
Collaboration metrics
Get a free trial to find more data on influencer audiences, performance, and collaborations.
Native's repeat partnerships
Out of 3.9k unique influencers in our dataset, 155 of them (4%) posted content for Native in 3 or more separate calendar months. The most consistent partner is @thepixiesapothecary, who has collaborated across 6 months with 11 total posts.
Here are 3 examples of Native's repeat influencer partnerships, with links to the sponsored content.
thepixiesapothecary x Native
![TikTok post by @thepixiesapothecary for Native. Caption reads: [...] @pigletinbed @rhode skin @Native @laneige_us....](https://images.od.modash.io/8f3b87c98a33345d5cdb2adefd0faeaf21344b5a)
![TikTok post by @thepixiesapothecary for Native. Caption reads: [...] @rhode skin @eos Products @Native....](https://images.od.modash.io/59c24b8e39e5c481a3e30ab8e939ca838e209f62)
![TikTok post by @thepixiesapothecary for Native. Caption reads: [...] @rhode skin @Glossier @Native @Hobby Lobby....](https://images.od.modash.io/1d2592a579331ee9f1de36963216b398622cdd0c)
katelynpaige850 x Native
![TikTok post by @katelynpaige850 for Native. Caption reads: [...] this! #complimentary #GiftedByNative....](https://images.od.modash.io/c00d2726946ecc54db324cdd5ea39709f3f45181)
![TikTok post by @katelynpaige850 for Native. Caption reads: [...] it out I used to not like native now I love....](https://images.od.modash.io/bb853e8e50040933afa57d621ba5168db394fa45)
just.beingjessica x Native
![TikTok post by @just.beingjessica for Native. Caption reads: [...] Care @Saltxo @Naturium @Native @Tree Hut....](https://images.od.modash.io/a211e1e2b4b4c8de7a507a5800af93359a2d0f08)
![TikTok post by @just.beingjessica for Native. Caption reads: [...] Care @chubby star @Tree Hut @Native....](https://images.od.modash.io/77a176cecdf2bba1f7af2cc1b12f59fea88a9ad8)
![TikTok post by @just.beingjessica for Native. Caption reads: [...] @Tree Hut @Victoria’s Secret @Native....](https://images.od.modash.io/ec7c18aabd3e1c67408e0e63c0ec780ad82c1067)
💡 Related resource: Long-Term Influencer Partnerships: Pros, Cons & How The Pros Manage Them.
Geographical breakdown
In our dataset, United States is where Native had the most influencer activity. 68.1% of their live influencer content in the last 12 months was posted by American influencers.
Based on the percentage of influencer content per market, other important markets include:
- Canada (10.3%)
- United Kingdom (7.2%)
- France (5%)
Native's influencer activity by market
Here is another example of Native collaborating with an influencer in United States.
seandoesmagic x Native
Native's influencer activity vs. related brands
Native is a personal care brand built around deodorant and clean, scent-forward body products. Salt & Stone and Dr. Squatch overlap on natural positioning and fragrance storytelling, making them close competitors for the same lifestyle audience.
Total influencer content
Native vs. related brands influencer activity
Total sponsored posts tracked (last 12 months)
Dr. Squatch leads with 6.6k sponsored posts, marginally ahead of Native (6.2k posts) and SALT & STONE (4.5k posts). Across all three brands, the average volume is 5.8k posts, indicating mature, scaled influencer programs.
By social platform
Native vs. related brands influencer activity (by social platform)
Sponsored posts by platform
Among these brands, SALT & STONE leads on Instagram and Dr. Squatch leads on TikTok and YouTube. The gap is most notable on Instagram, with SALT & STONE at 1.1k, Dr. Squatch at 283, Native at 0 posts. Native's activity is particularly concentrated on TikTok. Native and Dr. Squatch have far more TikTok posts than SALT & STONE.
By geographical market
Native vs. related brands influencer activity (by country)
Estimated sponsored posts in Native's top markets
Dr. Squatch has the highest estimated sponsored-post volume in United States (4.7k posts, 71.7%), United Kingdom (580 posts, 8.8%), while Native leads in Canada with 641 posts (10.3%). Looking at United States specifically, the split is Dr. Squatch at 4.7k posts (71.7%), Native at 4.2k posts (68.1%), SALT & STONE at 3k posts (66.5%).
Read more influencer strategy breakdowns
Looking for more like this? Here are 5 similar influencer marketing strategy breakdowns for other brands:
- SALT & STONE's Influencer Marketing Strategy
- Dr. Squatch's Influencer Marketing Strategy
- Jaded LDN's Influencer Marketing Strategy
- Paragon Fitwear's Influencer Marketing Strategy
- Tecovas's Influencer Marketing Strategy
Or, if you want to access data like this for your own software or processes, take a look at Modash's API products:
Frequently asked questions
Scaling your influencer program?
When you outgrow your mishmash of spreadsheets & free tools, try Modash. Find & email influencers, track campaigns, ship products & more - all in one place.