Eva NYC Influencer Marketing Strategy
(2026 Data & Insights)
We analyzed 1.3k pieces of influencer content sponsored by Eva NYC over the last 12 months.
This report breaks down where & how Eva NYC invests in influencer marketing, which social platforms they prioritize, top geographical markets, and more.
The data in this report comes from Modash's Brand Collaborations API.
P.S. for a simple list of influencers who have collaborated with Eva NYC, see here: Eva NYC influencers.
Influencer activity throughout the year
Eva NYC's influencer campaigns are active year-round with notable month-to-month fluctuation. The chart below shows month-by-month data for total sponsored posts tracked.
Eva NYC's influencer activity by month
Number of sponsored posts
Eva NYC's influencer output appears relatively consistent throughout the year, averaging about 108 sponsored posts per month. August recorded the highest volume at 165 posts (53% above average), while June was the quietest at 51 posts.
Social platforms breakdown
In our dataset (which only includes Instagram, YouTube, and TikTok), this is how the volume of Eva NYC's sponsored influencer collaborations break down by social platform:
- TikTok: 862 posts (66.6%)
- Instagram: 425 posts (32.8%)
- YouTube: 7 posts (0.5%)
Eva NYC's influencer activity by platform
Share of sponsored content by social network
TikTok influencer marketing is a clear focus for Eva NYC.
Here are 3 examples of Eva NYC's recent sponsored collaborations (one each for Instagram, TikTok, YouTube).
yifan.liii x Eva NYC
![Instagram post by @yifan.liii for Eva NYC. Caption reads: [...] #hairtutorial #hairstyle #hairinspo....](https://images.od.modash.io/9e113c5b3cb771936f859d994b38cfff0cfcec48)
Influencer bio
new york|nyu 🤍 ✉️:yifan@vxmedia.co
Collaboration metrics
Get a free trial to find more data on influencer audiences, performance, and collaborations.
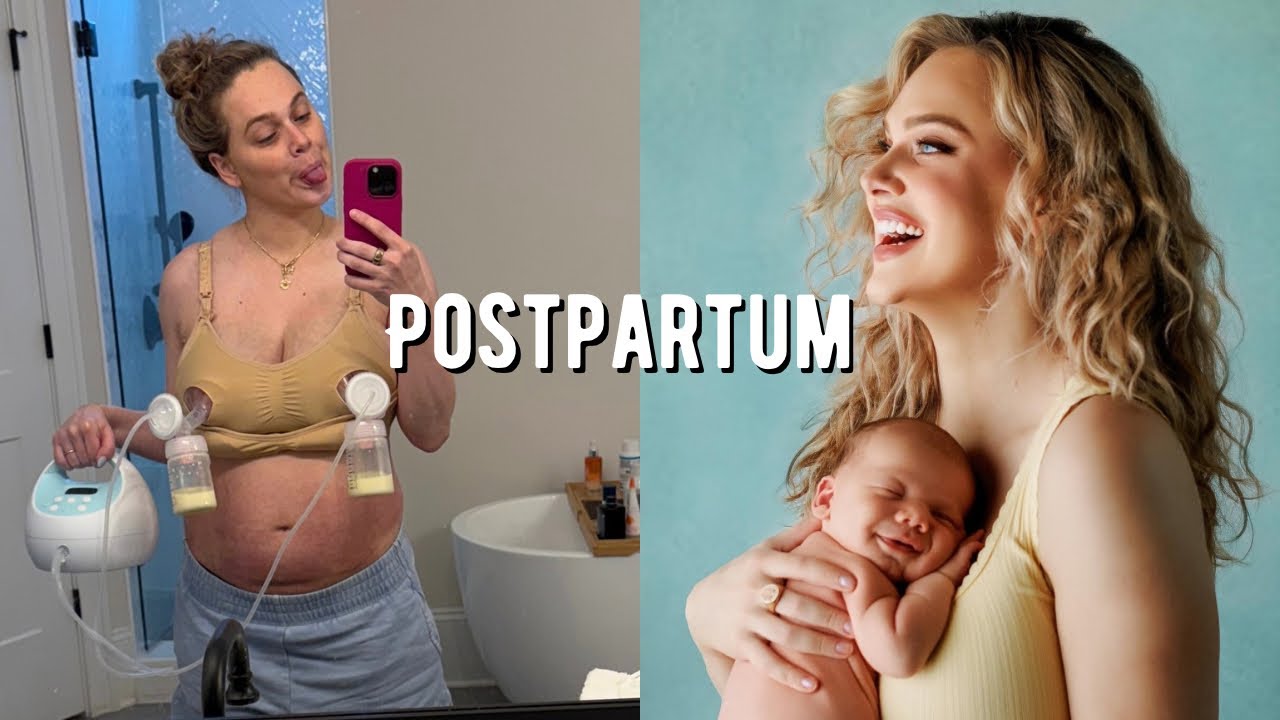
itskathleenngo x Eva NYC
![TikTok post by @itskathleenngo for Eva NYC. Caption reads: [...] w/ H2Woah Hydra-Jelly Hair Mask from @Eva....](https://images.od.modash.io/25baba3ba3d81220a5bb4284f2736e4f85b76fbe)
Influencer bio
beauty | fashion | kpop | los angeles 📧 hello@itskathleenngo.com
Collaboration metrics
Get a free trial to find more data on influencer audiences, performance, and collaborations.
indiabatson26 x Eva NYC
Influencer bio
Collaboration metrics
Get a free trial to find more data on influencer audiences, performance, and collaborations.
If you break this down further by content type on TikTok, this is what it looks like:
- Videos: 96.6%
- Carousels: 3.4%
💡 Related resource: How To Find TikTok Influencers.
Influencer audience size breakdown (by views)
For their top social platform (TikTok), here is a breakdown of the type of influencers Eva NYC are collaborating with, by audience size.
Note: this breakdown is based on each influencer's average views (not follower/subscriber count), because views typically correlate more closely with influencer pricing and impact.
Eva NYC's influencers average views (TikTok)
Based on each influencer's average views per post
With 37.4% of partnerships featuring creators averaging 1K-5K views, Eva NYC's strategy suggests niche targeting and authenticity, likely leveraging collaboration models like gifting and affiliates to work with smaller creators.
Here is an example of a sponsored collaboration with a larger-audience creator on TikTok (274.8k avg views/post):
oliviaowassa x Eva NYC
Influencer bio
˗ˏˋ ig: oliviaowassa ˎˊ˗ ✉︎ oliviaowassa@currentsmgmt.com ↓ all my links
Collaboration metrics
Get a free trial to find more data on influencer audiences, performance, and collaborations.
And here is another example with a smaller creator on TikTok (8.7k avg views/post):
nana.barajas0 x Eva NYC
Influencer bio
Girly things🎀
Collaboration metrics
Get a free trial to find more data on influencer audiences, performance, and collaborations.
Eva NYC's repeat partnerships
Out of 926 unique influencers in our dataset, 31 of them (3%) posted content for Eva NYC in 3 or more separate calendar months. The most consistent partner is @manesbymell, who has collaborated across 5 months with 9 total posts.
Here are 3 examples of Eva NYC's repeat influencer partnerships, with links to the sponsored content.
delaneychilds x Eva NYC
![Instagram post by @delaneychilds for Eva NYC. Caption reads: [...] for $ off! #evaynycpartner #evanyc.](https://images.od.modash.io/f4cff7b875bb7535cef2c09469421af4de1ac8f6)
![Instagram post by @delaneychilds for Eva NYC. Caption reads: [...] for an extra discount! #evanyc....](https://images.od.modash.io/6100a123125f3c7eb5e3d37d53d3c2d6a75a7548)
![Instagram post by @delaneychilds for Eva NYC. Caption reads: [...] primer to heat protect! #evanycpartner.](https://images.od.modash.io/38d0093b43e7db66d6a67ffd86ed6cef65d54da9)
cassidyaleksa x Eva NYC
![TikTok post by @cassidyaleksa for Eva NYC. Caption reads: @Eva NYC I am absolutely GIDDY over [...].](https://images.od.modash.io/eb24f63dcb1c299e9971bfd30a52467dc2324f12)
![TikTok post by @cassidyaleksa for Eva NYC. Caption reads: [...] mentioned: @Dairy Boy @Eva NYC @Fenty Beauty....](https://images.od.modash.io/b78c1973415eb1cd81ee83be7af1a7122c44b223)
itsamandapasceri x Eva NYC
![Instagram post by @itsamandapasceri for Eva NYC. Caption reads: [...] use code AMANDA20 to save💗 #evanycpartner....](https://images.od.modash.io/d1f7ae28366efa54b6f50dcd2e1e8ea12d8eeb96)
![Instagram post by @itsamandapasceri for Eva NYC. Caption reads: [...] impressed with the results. #evanyc....](https://images.od.modash.io/eb0308a8e0aa36b688aab83583856b1dfecf0a9f)
![Instagram post by @itsamandapasceri for Eva NYC. Caption reads: [...] with a luxury price tag🌀 #evanycpartner The....](https://images.od.modash.io/c16de6ec86a6ea6a55e76e90eeab3613d52337f0)
💡 Related resource: Long-Term Influencer Partnerships: Pros, Cons & How The Pros Manage Them.
Geographical breakdown
In our dataset, United States is where Eva NYC had the most influencer activity. 69.6% of their live influencer content in the last 12 months was posted by American influencers.
Based on the percentage of influencer content per market, other important markets include:
- United Kingdom (5.9%)
- Canada (5.5%)
- Brazil (3.6%)
Eva NYC's influencer activity by market
Here is another example of Eva NYC collaborating with an influencer in United States.
thekarlasalmeron x Eva NYC
Eva NYC's influencer activity vs. related brands
Eva NYC competes with OUAI and Living Proof in haircare and styling products that balance performance with strong brand identity. They target similar shoppers through tutorials, routine content, and product recommendations from creators.
Total influencer content
Eva NYC vs. related brands influencer activity
Total sponsored posts tracked (last 12 months)
Living Proof leads with 6.1k sponsored posts, marginally ahead of OUAI (5.8k posts) and Eva NYC (1.3k posts). Across all three brands, the average volume is 4.4k posts, indicating mature, scaled influencer programs. OUAI and Living Proof have several times more total posts than Eva NYC.
By social platform
Eva NYC vs. related brands influencer activity (by social platform)
Sponsored posts by platform
Among these brands, Living Proof leads on Instagram and OUAI leads on TikTok and YouTube. The gap is most notable on Instagram, with Living Proof at 2.5k, OUAI at 1.5k, Eva NYC at 425 posts. OUAI's activity is particularly concentrated on TikTok. On TikTok, OUAI and Living Proof have several times more posts than Eva NYC.
By geographical market
Eva NYC vs. related brands influencer activity (by country)
Estimated sponsored posts in Eva NYC's top markets
Living Proof has the highest estimated sponsored-post volume in United States (3.7k posts, 60.4%), United Kingdom (681 posts, 11.2%), Canada (207 posts, 3.4%), suggesting a North America focus, while OUAI leads in Indonesia with 285 posts (4.9%). Looking at United States specifically, the split is Living Proof at 3.7k posts (60.4%), OUAI at 3.2k posts (55.2%), Eva NYC at 901 posts (69.6%).
Read more influencer strategy breakdowns
Looking for more like this? Here are 5 similar influencer marketing strategy breakdowns for other brands:
- OUAI's Influencer Marketing Strategy
- Living Proof's Influencer Marketing Strategy
- SALT & STONE's Influencer Marketing Strategy
- Triquetra Health's Influencer Marketing Strategy
- COROS's Influencer Marketing Strategy
Or, if you want to access data like this for your own software or processes, take a look at Modash's API products:
Frequently asked questions
Scaling your influencer program?
When you outgrow your mishmash of spreadsheets & free tools, try Modash. Find & email influencers, track campaigns, ship products & more - all in one place.