Adanola Influencer Marketing Strategy
(2026 Data & Insights)
We analyzed 2.2k pieces of influencer content sponsored by Adanola over the last 12 months.
This report breaks down where & how Adanola invests in influencer marketing, which social platforms they prioritize, top geographical markets, and more.
The data in this report comes from Modash's Brand Collaborations API.
P.S. for a simple list of influencers who have collaborated with Adanola, see here: Adanola influencers.
Influencer activity throughout the year
Adanola's influencer campaigns are active year-round with notable month-to-month fluctuation. The chart below shows month-by-month data for total sponsored posts tracked.
Adanola's influencer activity by month
Number of sponsored posts
Adanola's influencer posting pattern appears irregular, with notable fluctuations month to month. January saw the highest output at 270 posts (50% above the 180 monthly average), while June was the quietest at 39 posts.
Social platforms breakdown
In our dataset (which only includes Instagram, YouTube, and TikTok), this is how the volume of Adanola's sponsored influencer collaborations break down by social platform:
- Instagram: 1.3k posts (58.3%)
- TikTok: 878 posts (40.5%)
- YouTube: 27 posts (1.2%)
Adanola's influencer activity by platform
Share of sponsored content by social network
Instagram influencer marketing is a clear focus for Adanola.
Here are 3 examples of Adanola's recent sponsored collaborations (one each for Instagram, TikTok, YouTube).
marsha_du_ x Adanola
![Instagram post by @marsha_du_ for Adanola. Caption reads: [...] with a friend>>> New seamless outfit....](https://images.od.modash.io/1aadf65e973d9e80021696956cb7ed0d00f88191)
Influencer bio
🏃🏽♀️ Track & Field Athlete 👩🏽🔬 BSc Biochem 📧 Collab | Marsha.dunkel@outlook.com
Collaboration metrics
Get a free trial to find more data on influencer audiences, performance, and collaborations.
palomameehan x Adanola
Influencer bio
Professional Dreamer Paloma Bella on Substack!
Collaboration metrics
Get a free trial to find more data on influencer audiences, performance, and collaborations.
karennapoly x Adanola
![YouTube post by @karennapoly for Adanola. Caption reads: [...] West Small En Cuir: Le Baume Fertile:....](https://images.od.modash.io/fa6dd53fbcca7affdc0c8043413320c384df44f1)
Influencer bio
Welcome 🤍 I share my life in Paris and all the things that I love ! For any inquiries, please write to this email address : karen@studiosonnois.com
Collaboration metrics
Get a free trial to find more data on influencer audiences, performance, and collaborations.
If you break this down further by content type on Instagram, this is what it looks like:
- Posts: 59.4%
- Reels: 40.6%
💡 Related resource: How To Find Instagram Influencers.
Influencer audience size breakdown (by views)
For their top social platform (Instagram), here is a breakdown of the type of influencers Adanola are collaborating with, by audience size.
Note: this breakdown is based on each influencer's average views (not follower/subscriber count), because views typically correlate more closely with influencer pricing and impact.
Adanola's influencers average views (Instagram)
Based on each influencer's average views per post
With 31.8% of partnerships featuring creators averaging 10K-50K views, Adanola's strategy suggests cost-efficiency and engagement-focused partnerships. The 1K-5K views segment is also prominent at 28.8%, indicating investment across adjacent tiers.
Here is an example of a sponsored collaboration with a larger-audience creator on Instagram (143.7k avg views/post):
carla_ginola x Adanola
Influencer bio
🦦
Collaboration metrics
Get a free trial to find more data on influencer audiences, performance, and collaborations.
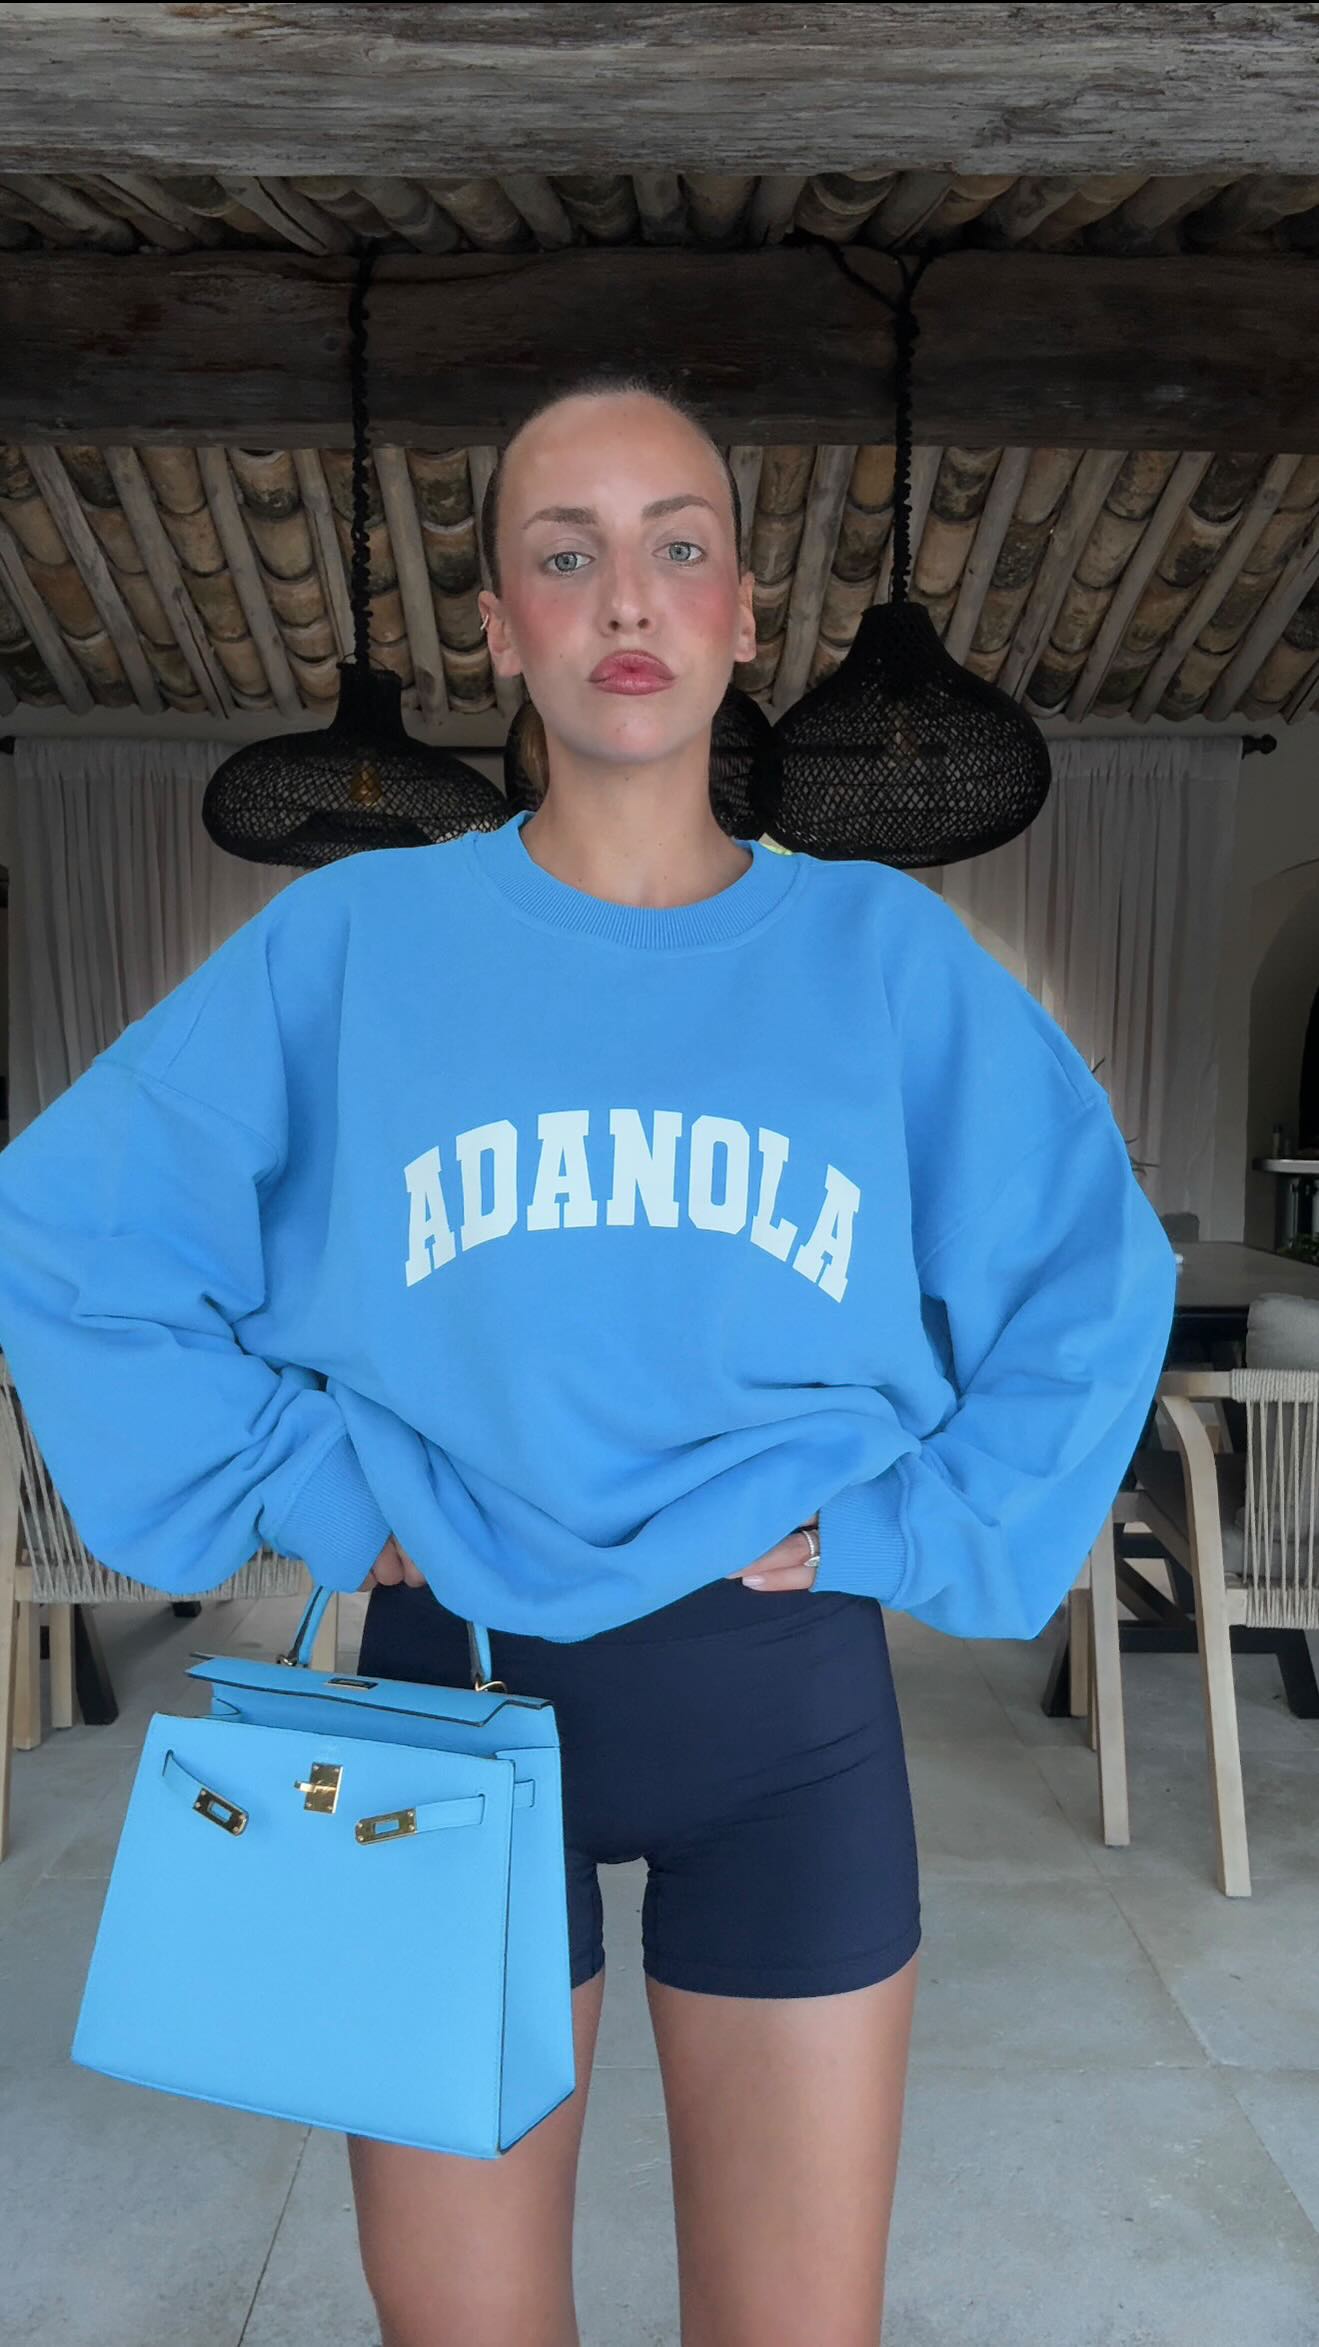
And here is another example with a smaller creator on Instagram (8.8k avg views/post):
sarahlysander x Adanola
![Instagram post by @sarahlysander for Adanola. Caption reads: [...] are over.. the ultimate collection🤌🏼....](https://images.od.modash.io/e39705ba16910ebdec68dfa27c93be12ea8fbb8e)
Influencer bio
📍BRITISH GIRL Enquiries: bashir@lysandersocial.com
Collaboration metrics
Get a free trial to find more data on influencer audiences, performance, and collaborations.
Adanola's repeat partnerships
Out of 1.4k unique influencers in our dataset, 55 of them (4%) posted content for Adanola in 3 or more separate calendar months. The most consistent partner is @katageridou, who has collaborated across 11 months with 17 total posts.
Here are 3 examples of Adanola's repeat influencer partnerships, with links to the sponsored content.
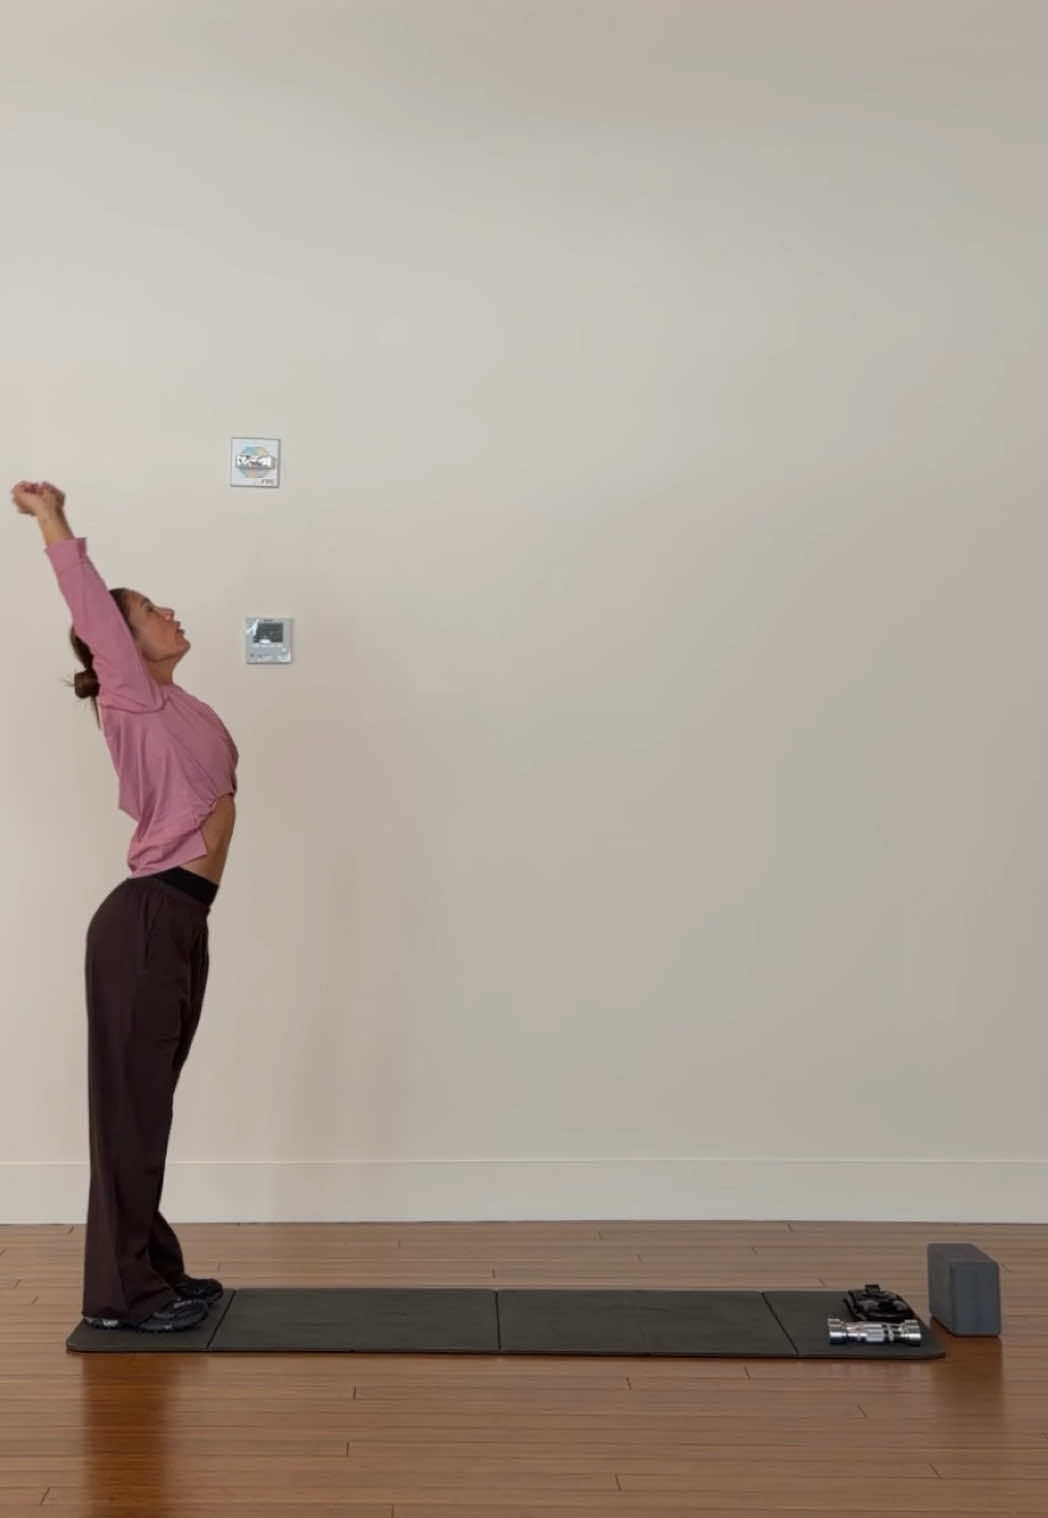
katageridou x Adanola
![Instagram post by @katageridou for Adanola. Caption reads: 🩰🩷 @adanola . . #ad#pilates [...].](https://images.od.modash.io/a9c05eae008fd2127f0a3f692ae8f67b063ce614)
![Instagram post by @katageridou for Adanola. Caption reads: Obliques 🤎 @adanola . . #ad#pilates [...].](https://images.od.modash.io/d8091ea036829c1f36bbf5b1e7e986a797432334)
![Instagram post by @katageridou for Adanola. Caption reads: Clamshells ❤️🔥 @adanola . . #ad#pilates [...].](https://images.od.modash.io/a3546d9220657ce18caeb9a4713ba16619a4a5b0)
leticiaesparza x Adanola
![Instagram post by @leticiaesparza for Adanola. Caption reads: [...] work. . In that new color way @adanola 💅 .....](https://images.od.modash.io/89347eb18d5b7b6e853bc94378b5370f8fda7b1a)
![Instagram post by @leticiaesparza for Adanola. Caption reads: @adanola new seamless. . Tried and [...].](https://images.od.modash.io/e69db105e571958ff60cd6966233798ec6fe719f)
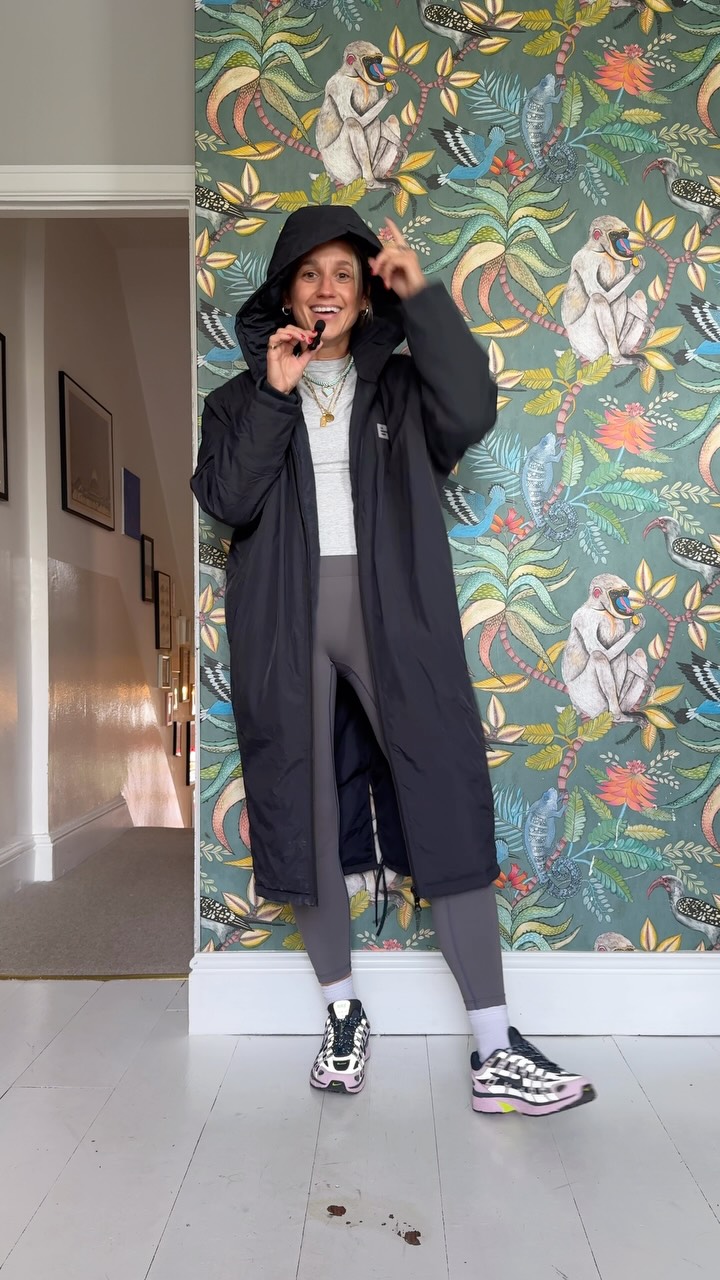
goodmannersstyle x Adanola
![Instagram post by @goodmannersstyle for Adanola. Caption reads: [...] in 👌🏻 Coat @sezane Leggings @adanola....](https://images.od.modash.io/2c1ff2832eac0eab09cc8b8616726c2289fcb0fc)
![Instagram post by @goodmannersstyle for Adanola. Caption reads: [...] Puffa @bittekairand Leggings @adanola....](https://images.od.modash.io/980147270ad29c06f97aa0498a5691b455cb029c)
💡 Related resource: Long-Term Influencer Partnerships: Pros, Cons & How The Pros Manage Them.
Geographical breakdown
In our dataset, United Kingdom is where Adanola had the most influencer activity. 38.9% of their live influencer content in the last 12 months was posted by British influencers.
Based on the percentage of influencer content per market, other important markets include:
- United States (30.7%)
- Brazil (3.3%)
- France (2.9%)
Adanola's influencer activity by market
Here is another example of Adanola collaborating with an influencer in United Kingdom.
carasuthers x Adanola
![Instagram post by @carasuthers for Adanola. Caption reads: [...] @sloppyjoesweatshirts Ad/pr Leggings....](https://images.od.modash.io/be0bb96dd11a0e0702a4901c3aaa263c47b233e9)
Adanola's influencer activity vs. related brands
Adanola’s minimalist activewear aesthetic competes with Alo Yoga and LSKD for style-meets-performance buyers, where creator content emphasizes set styling, workouts, and athleisure everyday wear.
Total influencer content
Adanola vs. related brands influencer activity
Total sponsored posts tracked (last 12 months)
Alo Yoga leads with 29.8k sponsored posts, significantly outpacing LSKD (8.4k posts) and Adanola (2.2k posts). Across all three brands, the average volume is 13.5k posts, indicating mature, scaled influencer programs. Alo Yoga has posted many more times overall than Adanola and LSKD.
By social platform
Adanola vs. related brands influencer activity (by social platform)
Sponsored posts by platform
Among these brands, Alo Yoga leads on Instagram and TikTok and LSKD leads on YouTube. The gap is most notable on Instagram, with Alo Yoga at 25.3k, LSKD at 5.7k, Adanola at 1.3k posts. Alo Yoga's activity is particularly concentrated on Instagram. On Instagram, Alo Yoga has posted many more times than Adanola and LSKD.
By geographical market
Adanola vs. related brands influencer activity (by country)
Estimated sponsored posts in Adanola's top markets
Alo Yoga has the highest estimated sponsored-post volume in United States (12k posts, 38.7%), Brazil (2.5k posts, 8.4%), India (1.4k posts, 4.7%), while LSKD leads in Australia with 2k posts (23.9%), while Adanola leads in United Kingdom with 843 posts (38.9%). Looking at United States specifically, the split is Alo Yoga at 12k posts (38.7%), LSKD at 4k posts (48%), Adanola at 666 posts (30.7%). Adanola's strength in United Kingdom may indicate a home-market focus, while Alo Yoga shows broader regional investment.
Read more influencer strategy breakdowns
Looking for more like this? Here are 5 similar influencer marketing strategy breakdowns for other brands:
- Alo Yoga's Influencer Marketing Strategy
- LSKD's Influencer Marketing Strategy
- Qure Skincare's Influencer Marketing Strategy
- In Print We Trust's Influencer Marketing Strategy
- OGL Move's Influencer Marketing Strategy
Or, if you want to access data like this for your own software or processes, take a look at Modash's API products:
Frequently asked questions
Scaling your influencer program?
When you outgrow your mishmash of spreadsheets & free tools, try Modash. Find & email influencers, track campaigns, ship products & more - all in one place.