LSKD Influencer Marketing Strategy
(2026 Data & Insights)
We analyzed 8.4k pieces of influencer content sponsored by LSKD over the last 12 months.
This report breaks down where & how LSKD invests in influencer marketing, which social platforms they prioritize, top geographical markets, and more.
The data in this report comes from Modash's Brand Collaborations API.
P.S. for a simple list of influencers who have collaborated with LSKD, see here: LSKD influencers.
Influencer activity throughout the year
LSKD's influencer campaigns are active year-round with notable month-to-month fluctuation. The chart below shows month-by-month data for total sponsored posts tracked.
LSKD's influencer activity by month
Number of sponsored posts
LSKD's influencer output appears relatively consistent throughout the year, averaging about 698 sponsored posts per month. April recorded the highest volume at 954 posts (37% above average), while June was the quietest at 442 posts.
Social platforms breakdown
In our dataset (which only includes Instagram, YouTube, and TikTok), this is how the volume of LSKD's sponsored influencer collaborations break down by social platform:
- Instagram: 5.7k posts (67.7%)
- TikTok: 2.6k posts (30.8%)
- YouTube: 126 posts (1.5%)
LSKD's influencer activity by platform
Share of sponsored content by social network
Instagram influencer marketing is a clear focus for LSKD.
Here are 3 examples of LSKD's recent sponsored collaborations (one each for Instagram, TikTok, YouTube).
ej_mangilit x LSKD
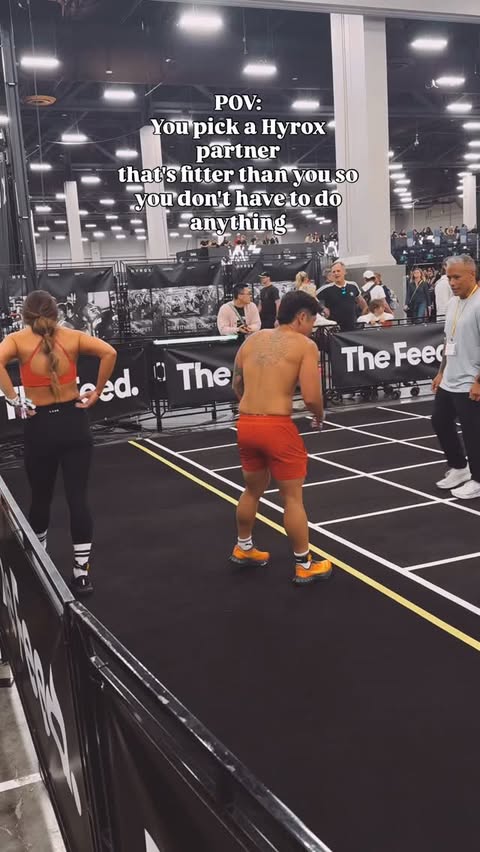
Influencer bio
▫️Official HYROX North American Ambassador ▪️Functional Fitness Enthusiast ▪️ @hyroxamerica @team.myzone
Collaboration metrics
Get a free trial to find more data on influencer audiences, performance, and collaborations.
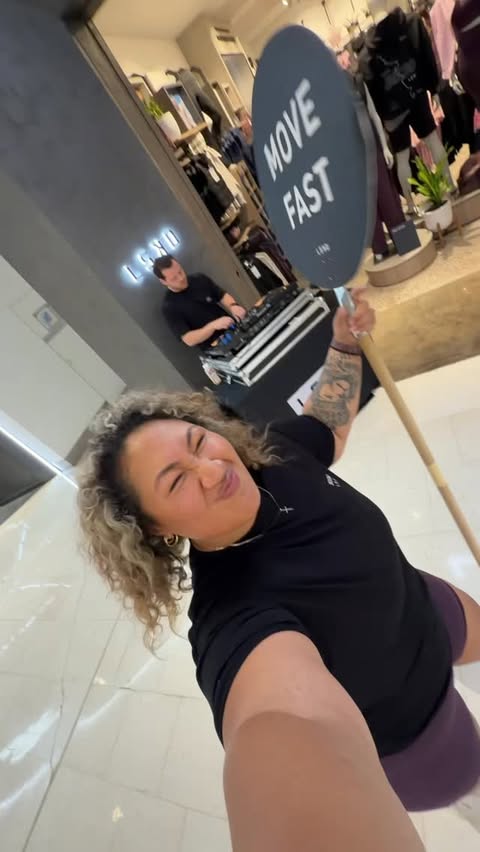
sallyrunssydney x LSKD
![TikTok post by @sallyrunssydney for LSKD. Caption reads: @LSKD - obsessed and comfortable is a huge [...].](https://images.od.modash.io/0596af81ac4c4cbcf39b2c56f0d680f75de514c3)
Influencer bio
Avid lover of running! Mara PB 3 hrs 25 mins.. Half Mara PB 1 hr 31 mins! 🏃🏼♀️ sallyrunssydney@hotmail.com
Collaboration metrics
Get a free trial to find more data on influencer audiences, performance, and collaborations.
Lottiealicelamb x LSKD
![YouTube post by @Lottiealicelamb for LSKD. Caption reads: [...] Trainer - Code: CHARLOTTEL Gym fits LSKD....](https://images.od.modash.io/252451f71798dfab3d689a5142f1cfcd79ee3426)
Influencer bio
Hybrid / Crossfit girl Mother to Hercules Building my way up one day at a time. Please like any videos you watch and subscribe to my channel, you can also follow me over on Instagram too for more inspiring and relatable fitness content @lottiealicelamb Love Charlotte
Collaboration metrics
Get a free trial to find more data on influencer audiences, performance, and collaborations.
If you break this down further by content type on Instagram, this is what it looks like:
- Reels: 66.7%
- Posts: 33.3%
💡 Related resource: How To Find Instagram Influencers.
Influencer audience size breakdown (by views)
For their top social platform (Instagram), here is a breakdown of the type of influencers LSKD are collaborating with, by audience size.
Note: this breakdown is based on each influencer's average views (not follower/subscriber count), because views typically correlate more closely with influencer pricing and impact.
LSKD's influencers average views (Instagram)
Based on each influencer's average views per post
LSKD's creator selection appears relatively diversified across size tiers, with no single segment dominating. This suggests a balanced approach to influencer partnerships, spreading investment across different audience sizes.
Here is an example of a sponsored collaboration with a larger-audience creator on Instagram (184.6k avg views/post):
jonsrunning x LSKD
![Instagram post by @jonsrunning for LSKD. Caption reads: [...] between peace and chaos. 🧘 Full Outfit:....](https://images.od.modash.io/7b5c54ef89d839d3e3f42dc7ad4318dd1cf37e7f)
Influencer bio
♾️ | Team @lskd.usa ✖️ | Sub 2:45 Marathon Runner 🇸🇪 | Chicago based student 📩 | Contact.jonsrunning@gmail.com
Collaboration metrics
Get a free trial to find more data on influencer audiences, performance, and collaborations.
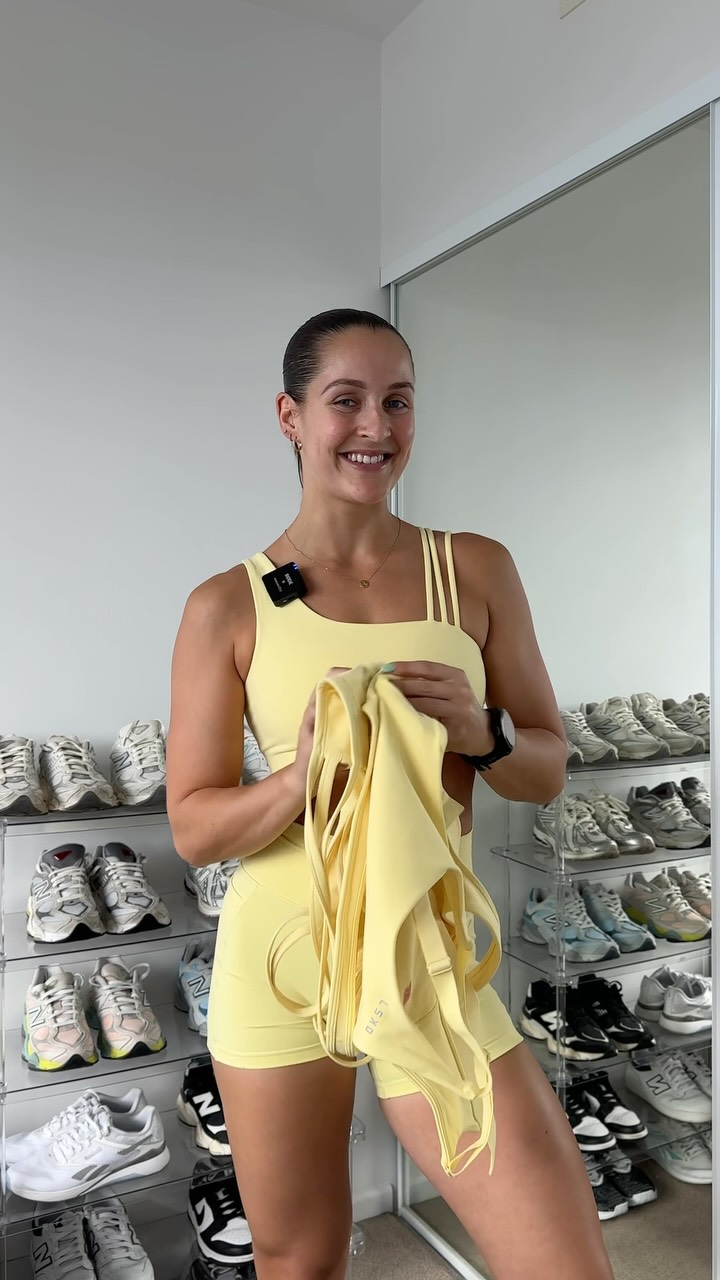
And here is another example with a smaller creator on Instagram (9.9k avg views/post):
charlie.williams x LSKD
![Instagram post by @charlie.williams for LSKD. Caption reads: [...] Velocity Bra in Energy Print Black 🖤 @lskd....](https://images.od.modash.io/4f6597ad8723ef7913310cadd96888b85e81c297)
Influencer bio
I like running
Collaboration metrics
Get a free trial to find more data on influencer audiences, performance, and collaborations.
LSKD's repeat partnerships
Out of 2.2k unique influencers in our dataset, 210 of them (10%) posted content for LSKD in 3 or more separate calendar months. The most consistent partner is @abrittslife, who has collaborated across 13 months with 61 total posts.
Here are 3 examples of LSKD's repeat influencer partnerships, with links to the sponsored content.
isabella.sievers x LSKD
![Instagram post by @isabella.sievers for LSKD. Caption reads: [...] possible, one mum at a time. @lskd 💙 dc....](https://images.od.modash.io/d0e2d16497d92dbe19edbed85f30bc3032af75f3)
![Instagram post by @isabella.sievers for LSKD. Caption reads: [...] of me 🤣🤣 🎒Backpack from @lskd discount:....](https://images.od.modash.io/53c710c04e9389a4e61642629e5031c87cb63717)
![Instagram post by @isabella.sievers for LSKD. Caption reads: [...] 🫶🏼 As always Running in @lskd ⚡️discount:....](https://images.od.modash.io/6920921c2f0fa77eb66b7459e3a03a46ccf0659c)
abbeyhallfitness x LSKD
![Instagram post by @abbeyhallfitness for LSKD. Caption reads: [...] that! ❤️🔥🚀 📸 @beccie.tsao @lskd #lskd....](https://images.od.modash.io/90461b86163ecbf76317b37deaaa2177423f3acb)
crossthick x LSKD
![Instagram post by @crossthick for LSKD. Caption reads: [...] How I actually got sponsored by LSKD ✨ •....](https://images.od.modash.io/88a15a88fa6151ef5051215c607f8ef9088a2f0e)
![Instagram post by @crossthick for LSKD. Caption reads: [...] How I actually got sponsored by LSKD ✨ •....](https://images.od.modash.io/7b4ceaf3583591cac00fed94292433cba9e20000)
💡 Related resource: Long-Term Influencer Partnerships: Pros, Cons & How The Pros Manage Them.
Geographical breakdown
In our dataset, United States is where LSKD had the most influencer activity. 48% of their live influencer content in the last 12 months was posted by American influencers.
Based on the percentage of influencer content per market, other important markets include:
- Australia (23.9%)
- United Kingdom (8%)
- New Zealand (4.3%)
LSKD's influencer activity by market
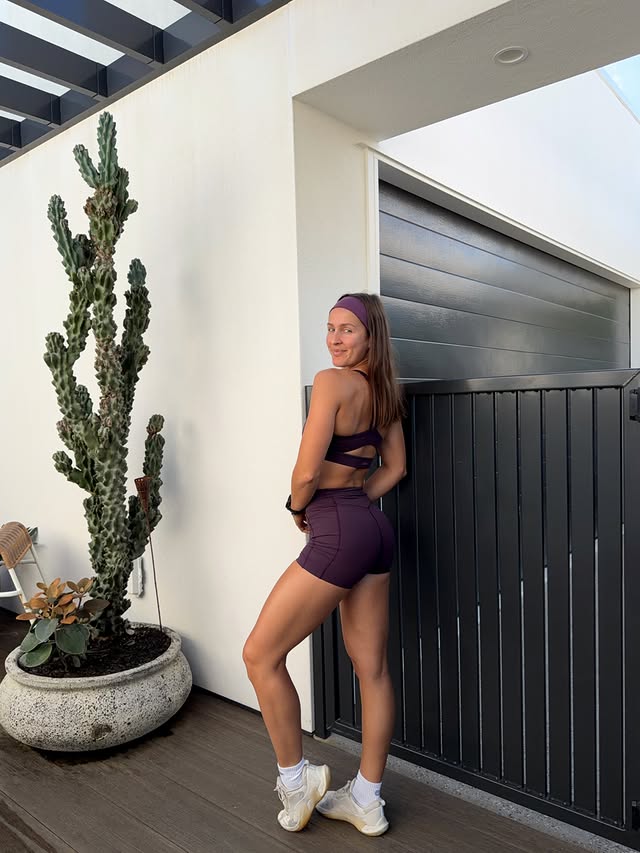
Here is another example of LSKD collaborating with an influencer in United States.
sarah_g1303 x LSKD
LSKD's influencer activity vs. related brands
LSKD competes directly with Gymshark and YoungLA in performance-driven gym apparel, sharing the same influencer playbook of athlete partnerships, training content, and community-led drops.
Total influencer content
LSKD vs. related brands influencer activity
Total sponsored posts tracked (last 12 months)
Gymshark leads with 39.2k sponsored posts, notably outpacing YoungLA (33.6k posts) and LSKD (8.4k posts). Across all three brands, the average volume is 27.1k posts, indicating mature, scaled influencer programs. Gymshark and YoungLA each have multiple times more total posts than LSKD.
By social platform
LSKD vs. related brands influencer activity (by social platform)
Sponsored posts by platform
Among these brands, YoungLA leads on Instagram and YouTube and Gymshark leads on TikTok. The gap is most notable on TikTok, with Gymshark at 26.5k, YoungLA at 8.9k, LSKD at 2.6k posts. On YouTube, YoungLA has multiple times more posts than both Gymshark and LSKD.
By geographical market
LSKD vs. related brands influencer activity (by country)
Estimated sponsored posts in LSKD's top markets
Gymshark has the highest estimated sponsored-post volume in United States (22k posts, 56%), United Kingdom (4.9k posts, 12.4%), while LSKD leads in Australia with 2k posts (23.9%), while YoungLA leads in Mexico with 1.8k posts (5.4%). Looking at United States specifically, the split is Gymshark at 22k posts (56%), YoungLA at 21k posts (63.9%), LSKD at 4k posts (48%).
Read more influencer strategy breakdowns
Looking for more like this? Here are 5 similar influencer marketing strategy breakdowns for other brands:
- Gymshark's Influencer Marketing Strategy
- YoungLA's Influencer Marketing Strategy
- Daniel Wellington's Influencer Marketing Strategy
- zasuwasportswear's Influencer Marketing Strategy
- Meshki's Influencer Marketing Strategy
Or, if you want to access data like this for your own software or processes, take a look at Modash's API products:
Frequently asked questions
Scaling your influencer program?
When you outgrow your mishmash of spreadsheets & free tools, try Modash. Find & email influencers, track campaigns, ship products & more - all in one place.