Better Alt Influencer Marketing Strategy
(2026 Data & Insights)
We analyzed 6.9k pieces of influencer content sponsored by Better Alt over the last 12 months.
This report breaks down where & how Better Alt invests in influencer marketing, which social platforms they prioritize, top geographical markets, and more.
The data in this report comes from Modash's Brand Collaborations API.
P.S. for a simple list of influencers who have collaborated with Better Alt, see here: Better Alt influencers.
Influencer activity throughout the year
Better Alt's influencer marketing output shows strong seasonal variation, with some months seeing 3x or more activity than others. The chart below shows month-by-month data for total sponsored posts tracked.
Better Alt's influencer activity by month
Number of sponsored posts
Better Alt's sponsored post volume appears to trend upward over the 12-month period, rising from 537 posts in January to 470 in December. The peak month, July, reached 1.3k posts, 126% higher than the monthly average of 571.
Social platforms breakdown
In our dataset (which only includes Instagram, YouTube, and TikTok), this is how the volume of Better Alt's sponsored influencer collaborations break down by social platform:
- TikTok: 6.9k posts (100%)
- YouTube: 1 posts (0%)
Better Alt's influencer activity by platform
Share of sponsored content by social network
TikTok influencer marketing is a clear focus for Better Alt.
Here are 1 examples of Better Alt's recent sponsored collaborations (one each for TikTok).
travelsntrends x Better Alt
![TikTok post by @travelsntrends for Better Alt. Caption reads: [...] #energyboost #naturalremedy @Better Alt this....](https://images.od.modash.io/5c65a418b1cb474b199c9309a06e0d8a12f503f6)
Influencer bio
Millennial ✨ Caffeine Addict ☕️ courtsward23@gmail.com
Collaboration metrics
Get a free trial to find more data on influencer audiences, performance, and collaborations.
If you break this down further by content type on TikTok, this is what it looks like:
- Videos: 92.3%
- Carousels: 7.7%
💡 Related resource: How To Find TikTok Influencers.
Influencer audience size breakdown (by views)
For their top social platform (TikTok), here is a breakdown of the type of influencers Better Alt are collaborating with, by audience size.
Note: this breakdown is based on each influencer's average views (not follower/subscriber count), because views typically correlate more closely with influencer pricing and impact.
Better Alt's influencers average views (TikTok)
Based on each influencer's average views per post
With 81.9% of partnerships featuring creators averaging <1K views, Better Alt's strategy suggests niche targeting and authenticity, likely leveraging collaboration models like gifting and affiliates to work with smaller creators.
Here is an example of a sponsored collaboration with a larger-audience creator on TikTok (616.4k avg views/post):
callmerose333 x Better Alt
![TikTok post by @callmerose333 for Better Alt. Caption reads: [...] #gymgirls #viraall #fyyppp @Better Alt.](https://images.od.modash.io/442dca48b2b3edec605801b697354423d07f0033)
Influencer bio
UGC creator/TTshop❤️join me!Business inq: rosemason0401@gmail.com IG Callmer0se_
Collaboration metrics
Get a free trial to find more data on influencer audiences, performance, and collaborations.
And here is another example with a smaller creator on TikTok (9.9k avg views/post):
graveyardgoonz x Better Alt
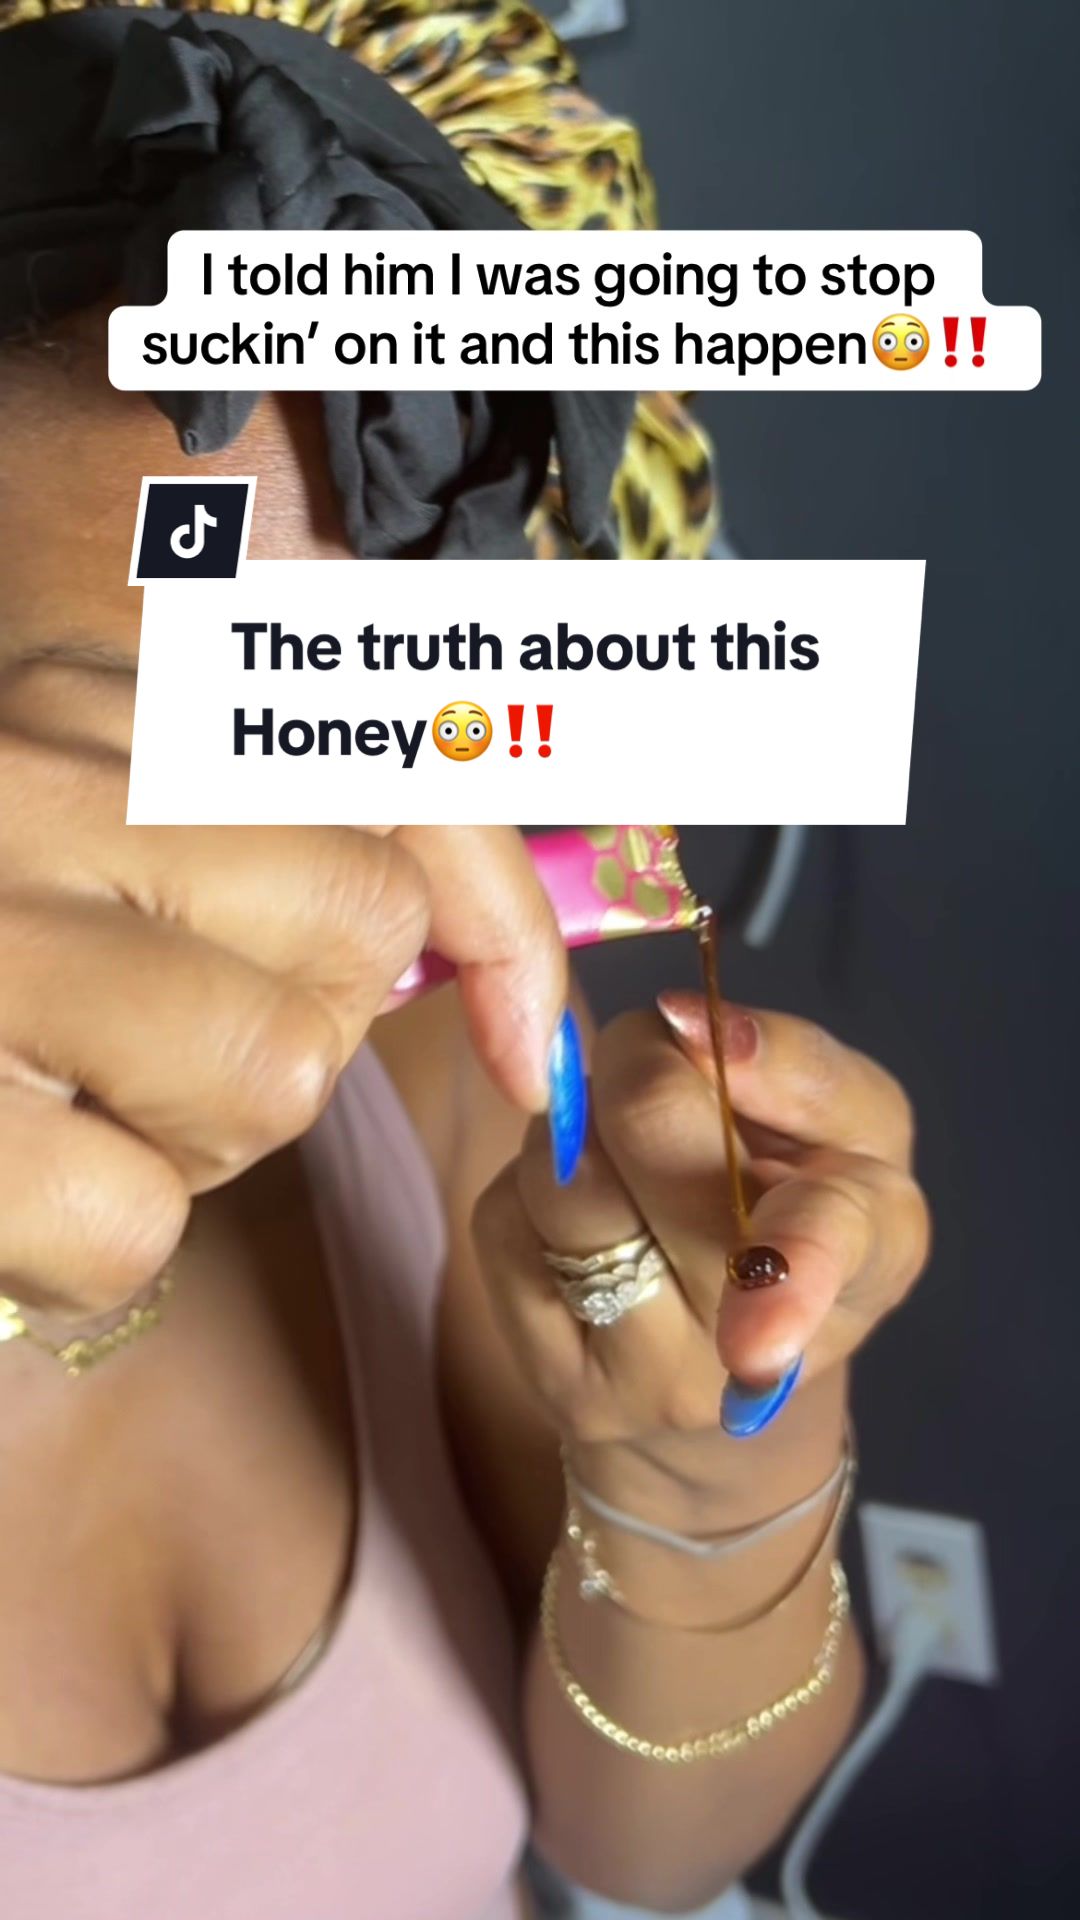
![TikTok post by @graveyardgoonz for Better Alt. Caption reads: @Better Alt is the real deal #shilajit [...].](https://images.od.modash.io/42a6b79d806db32a996f8f145903a7875ff753b5)
Influencer bio
Occult Obsessed Couple that LIVE Prank Calls people from a Graveyard on YouTube
Collaboration metrics
Get a free trial to find more data on influencer audiences, performance, and collaborations.
Better Alt's repeat partnerships
Out of 2.8k unique influencers in our dataset, 172 of them (6%) posted content for Better Alt in 3 or more separate calendar months. The most consistent partner is @graveyardgoonz, who has collaborated across 12 months with 49 total posts.
Here are 3 examples of Better Alt's repeat influencer partnerships, with links to the sponsored content.
graveyardgoonz x Better Alt
![TikTok post by @graveyardgoonz for Better Alt. Caption reads: [...] #tiktokshopblackfriday @Better Alt *Results....](https://images.od.modash.io/26037ec861e17047952fb7ca978b05d54b7673a0)
![TikTok post by @graveyardgoonz for Better Alt. Caption reads: [...] #christmasgiftideas @Better Alt *Results may....](https://images.od.modash.io/507617592bf7cfdbdd81429a4e2e26c4207ce832)
sweetsuncut x Better Alt
![TikTok post by @sweetsuncut for Better Alt. Caption reads: [...] alignment. It’s her return.@Better Alt....](https://images.od.modash.io/5d8b633a6f261fae8959768c162188c079125bb2)
![TikTok post by @sweetsuncut for Better Alt. Caption reads: [...] hit different. 😮💨🍯@Better Alt @CANVAS....](https://images.od.modash.io/946631eb768255bf1c315a2487d35fcf6b61dfb7)
feral_and_free x Better Alt
![TikTok post by @feral_and_free for Better Alt. Caption reads: [...] #TikTokShopCreatorCommunity @Better Alt.](https://images.od.modash.io/3e216d43ad41b16e898a0ff3c005dde9407f12e9)
![TikTok post by @feral_and_free for Better Alt. Caption reads: [...] #summerbodyloading @Better Alt @Feral_Harry.](https://images.od.modash.io/6e52f538028b1cb9d455d2229bc300d1a920e11f)
![TikTok post by @feral_and_free for Better Alt. Caption reads: [...] over a year ago with @Better Alt #marriage....](https://images.od.modash.io/35965fce8c46cea84bf3ee29ae3bf297753cf384)
💡 Related resource: Long-Term Influencer Partnerships: Pros, Cons & How The Pros Manage Them.
Better Alt's influencer activity vs. related brands
Better Alt sits in the supplements/wellness space, where Magic Mind (focus/functional shots) and Goli (gummies) compete for similar “daily routine” buyers. All three brands are influencer-friendly due to repeatable use-cases and clear benefit messaging.
Total influencer content
Better Alt vs. related brands influencer activity
Total sponsored posts tracked (last 12 months)
Goli leads with 40.3k sponsored posts, significantly outpacing Better Alt (6.9k posts) and Magic Mind (688 posts). Across all three brands, the average volume is 15.9k posts, indicating mature, scaled influencer programs. Goli has substantially more total posts than Better Alt and Magic Mind.
By social platform
Better Alt vs. related brands influencer activity (by social platform)
Sponsored posts by platform
Among these brands, Goli leads on Instagram and TikTok and Magic Mind leads on YouTube. The gap is most notable on TikTok, with Goli at 39.4k, Better Alt at 6.9k, Magic Mind at 77 posts. Better Alt's activity is particularly concentrated on TikTok. Most of Better Alt and Goli’s posts are on TikTok, while Magic Mind has far fewer TikTok posts and more activity on Instagram and YouTube compared to Better Alt.
Read more influencer strategy breakdowns
Looking for more like this? Here are 5 similar influencer marketing strategy breakdowns for other brands:
- Magic Mind's Influencer Marketing Strategy
- Goli's Influencer Marketing Strategy
- Fender's Influencer Marketing Strategy
- La La Land Kind Cafe's Influencer Marketing Strategy
- Pacifica Beauty's Influencer Marketing Strategy
Or, if you want to access data like this for your own software or processes, take a look at Modash's API products:
Frequently asked questions
Scaling your influencer program?
When you outgrow your mishmash of spreadsheets & free tools, try Modash. Find & email influencers, track campaigns, ship products & more - all in one place.