Beyond The Vines Influencer Marketing Strategy
(2026 Data & Insights)
We analyzed 1.4k pieces of influencer content sponsored by Beyond The Vines over the last 12 months.
This report breaks down where & how Beyond The Vines invests in influencer marketing, which social platforms they prioritize, top geographical markets, and more.
The data in this report comes from Modash's Brand Collaborations API.
P.S. for a simple list of influencers who have collaborated with Beyond The Vines, see here: Beyond The Vines influencers.
Influencer activity throughout the year
Beyond The Vines's influencer campaigns are active year-round with notable month-to-month fluctuation. The chart below shows month-by-month data for total sponsored posts tracked.
Beyond The Vines's influencer activity by month
Number of sponsored posts
Beyond The Vines's sponsored post volume appears to trend upward over the 12-month period, rising from 108 posts in January to 158 in December. The peak month, December, reached 158 posts, 33% higher than the monthly average of 119.
Social platforms breakdown
In our dataset (which only includes Instagram, YouTube, and TikTok), this is how the volume of Beyond The Vines's sponsored influencer collaborations break down by social platform:
- Instagram: 1.2k posts (83.7%)
- TikTok: 231 posts (16.1%)
- YouTube: 2 posts (0.1%)
Beyond The Vines's influencer activity by platform
Share of sponsored content by social network
Instagram influencer marketing is a clear focus for Beyond The Vines.
Here are 2 examples of Beyond The Vines's recent sponsored collaborations (one each for Instagram, TikTok).
anktsn x Beyond The Vines

Influencer bio
@kiyoi_ko @haruo_film
Collaboration metrics
Get a free trial to find more data on influencer audiences, performance, and collaborations.
komaki2002 x Beyond The Vines
Influencer bio
Hiroshima→osaka Instagramフォローお待ちしてます
Collaboration metrics
Get a free trial to find more data on influencer audiences, performance, and collaborations.
If you break this down further by content type on Instagram, this is what it looks like:
- Posts: 72.5%
- Reels: 27.5%
💡 Related resource: How To Find Instagram Influencers.
Influencer audience size breakdown (by views)
For their top social platform (Instagram), here is a breakdown of the type of influencers Beyond The Vines are collaborating with, by audience size.
Note: this breakdown is based on each influencer's average views (not follower/subscriber count), because views typically correlate more closely with influencer pricing and impact.
Beyond The Vines's influencers average views (Instagram)
Based on each influencer's average views per post
Beyond The Vines's creator selection appears relatively diversified across size tiers, with no single segment dominating. This suggests a balanced approach to influencer partnerships, spreading investment across different audience sizes.
Here is an example of a sponsored collaboration with a larger-audience creator on Instagram (47.0k avg views/post):
rion01_11a x Beyond The Vines

Influencer bio
+81 play list 🎬
Collaboration metrics
Get a free trial to find more data on influencer audiences, performance, and collaborations.
And here is another example with a smaller creator on Instagram (9.6k avg views/post):
pphuriich x Beyond The Vines

Influencer bio
bkk | outfit repeater collabs via dm
Collaboration metrics
Get a free trial to find more data on influencer audiences, performance, and collaborations.
Beyond The Vines's repeat partnerships
Out of 1.1k unique influencers in our dataset, 4 of them (0%) posted content for Beyond The Vines in 3 or more separate calendar months. The most consistent partner is @merccimakes, who has collaborated across 4 months with 7 total posts.
Here are 1 examples of Beyond The Vines's repeat influencer partnerships, with links to the sponsored content.
____c8y x Beyond The Vines
![Instagram post by @____c8y for Beyond The Vines. Caption reads: @beyondthevines 👩🏻Striped Relaxed T [...].](https://images.od.modash.io/d3ce7e2056f19c4da3160aaae2a41259a11f5c55)
![Instagram post by @____c8y for Beyond The Vines. Caption reads: @beyondthevinesjapan の可愛すぎるデニムのセットアップ。 [...].](https://images.od.modash.io/ec00c56e40b686a02bfeccd2067c2f0534882420)
![Instagram post by @____c8y for Beyond The Vines. Caption reads: . @beyondthevines の新しいバッグ🤍💚 コンパクトでかわいい! [...].](https://images.od.modash.io/945cf0b21278159666b1dd94c3d7e756bf18fb09)
💡 Related resource: Long-Term Influencer Partnerships: Pros, Cons & How The Pros Manage Them.
Geographical breakdown
In our dataset, Thailand is where Beyond The Vines had the most influencer activity. 26.3% of their live influencer content in the last 12 months was posted by Thai influencers.
Based on the percentage of influencer content per market, other important markets include:
- Japan (22.4%)
- Indonesia (22.3%)
- Philippines (11.8%)
Beyond The Vines's influencer activity by market
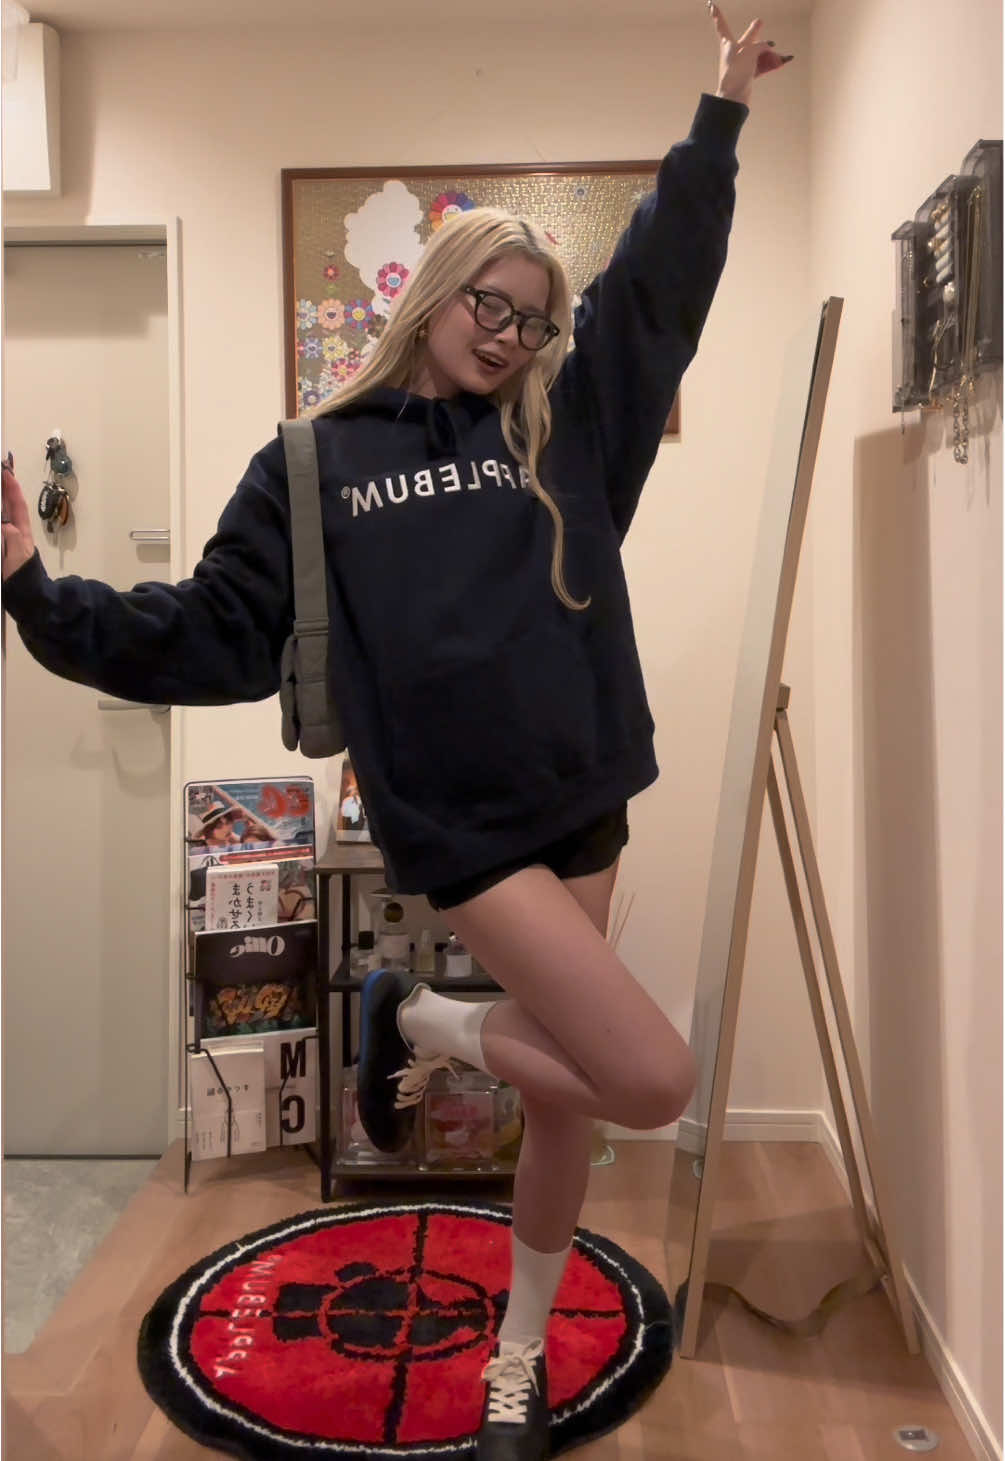
Here is another example of Beyond The Vines collaborating with an influencer in Thailand.
tvoquvu x Beyond The Vines

Beyond The Vines's influencer activity vs. related brands
Beyond The Vines’ lifestyle accessories appeal aligns most with BAGGU’s everyday carry culture and Beyond Yoga’s casual-lifestyle audience, offering comparable benchmarks for aesthetic-led, UGC-heavy creator campaigns.
Total influencer content
Beyond The Vines vs. related brands influencer activity
Total sponsored posts tracked (last 12 months)
BAGGU leads with 3.4k sponsored posts, significantly outpacing Beyond The Vines (1.4k posts) and Beyond Yoga (1.2k posts). Across all three brands, the average volume is 2k posts, indicating mature, scaled influencer programs.
By social platform
Beyond The Vines vs. related brands influencer activity (by social platform)
Sponsored posts by platform
Beyond The Vines leads on Instagram, while BAGGU has the most activity on TikTok and YouTube. The gap is most notable on TikTok, with BAGGU at 2.6k, Beyond Yoga at 365, Beyond The Vines at 231 posts. Beyond The Vines's activity is particularly concentrated on Instagram. TikTok post volume is much higher for BAGGU (2591) than Beyond The Vines (231) and Beyond Yoga (365).
By geographical market
Beyond The Vines vs. related brands influencer activity (by country)
Estimated sponsored posts in Beyond The Vines's top markets
BAGGU has the highest estimated sponsored-post volume in United States (2.3k posts, 67.9%), United Kingdom (182 posts, 5.4%), while Beyond The Vines has the highest estimated sponsored-post volume in Thailand (377 posts, 26.3%), Japan (321 posts, 22.4%), Indonesia (319 posts, 22.3%), suggesting a Asia focus, while Beyond Yoga leads in Canada with 45 posts (3.7%). Looking at United States specifically, the split is BAGGU at 2.3k posts (67.9%), Beyond Yoga at 973 posts (79.2%). Beyond The Vines's strength in Japan may indicate a home-market focus, while Beyond Yoga shows broader regional investment.
Read more influencer strategy breakdowns
Looking for more like this? Here are 5 similar influencer marketing strategy breakdowns for other brands:
- BAGGU's Influencer Marketing Strategy
- Beyond Yoga's Influencer Marketing Strategy
- ILIA Beauty's Influencer Marketing Strategy
- HOVERAir's Influencer Marketing Strategy
- Fanttik's Influencer Marketing Strategy
Or, if you want to access data like this for your own software or processes, take a look at Modash's API products:
Frequently asked questions
Scaling your influencer program?
When you outgrow your mishmash of spreadsheets & free tools, try Modash. Find & email influencers, track campaigns, ship products & more - all in one place.